Abstract
Categorically distinct basic drives (for example, for social versus feeding behaviour1–3) can exert potent influences on each other; such interactions are likely to have important adaptive consequences (such as appropriate regulation of feeding in the context of social hierarchies) and can become maladaptive (such as in clinical settings involving anorexia). It is known that neural systems regulating natural and adaptive caloric intake, and those regulating social behaviours, involve related circuitry4–7, but the causal circuit mechanisms of these drive adjudications are not clear. Here we investigate the causal role in behaviour of cellular-resolution experience-specific neuronal populations in the orbitofrontal cortex, a major reward-processing hub that contains diverse activity-specific neuronal populations that respond differentially to various aspects of caloric intake8–13 and social stimuli14,15. We coupled genetically encoded activity imaging with the development and application of methods for optogenetic control of multiple individually defined cells, to both optically monitor and manipulate the activity of many orbitofrontal cortex neurons at the single-cell level in real time during rewarding experiences (caloric consumption and social interaction). We identified distinct populations within the orbitofrontal cortex that selectively responded to either caloric rewards or social stimuli, and found that activity of individually specified naturally feeding-responsive neurons was causally linked to increased feeding behaviour; this effect was selective as, by contrast, single-cell resolution activation of naturally social-responsive neurons inhibited feeding, and activation of neurons responsive to neither feeding nor social stimuli did not alter feeding behaviour. These results reveal the presence of potent cellular-level subnetworks within the orbitofrontal cortex that can be precisely engaged to bidirectionally control feeding behaviours subject to, for example, social influences.
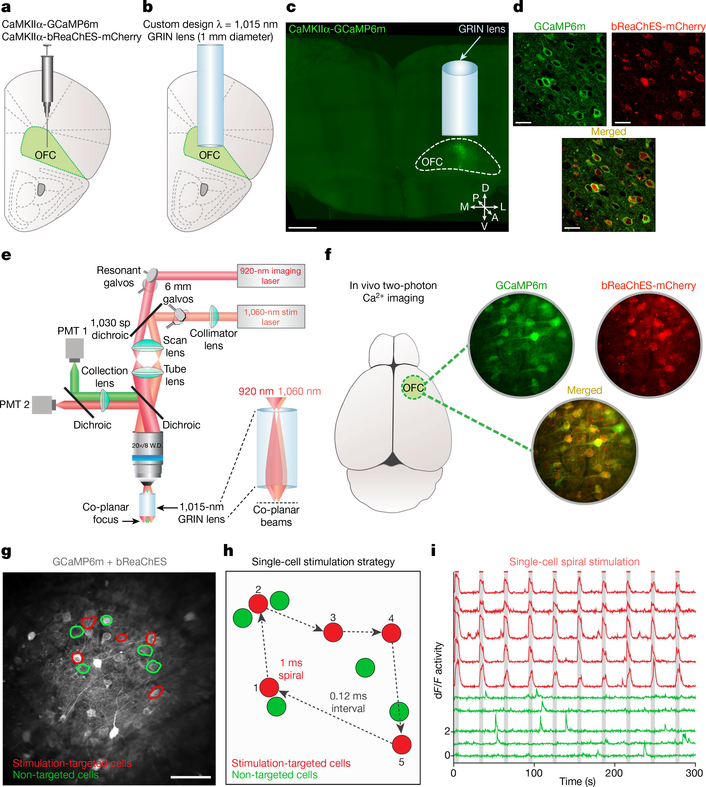
The convergence of progress in several fields—the initial discovery and design of microbial opsins for red-shifted optogenetic perturbation16–18, the advent of single-cell-resolution in vivo optogenetics19 enabled by these opsins16,17, and custom multi-photon microscopy methods19–23 along with the ongoing optimization of genetically encoded Ca2+ indicators such as the GCaMP series24 for readout of neural activity—together has raised the possibility of directly controlling multiple individually specified and natural-activity-defined neurons to modulate animal behaviour. Here we sought to develop an optical approach to simultaneously monitor and modulate the in vivo activity of many individual orbitofrontal cortex (OFC) neurons during multiple distinct behaviours. We injected a mixture of adeno-associated viruses (AAV) encoding the green fluorescent Ca2+ indicator GCaMP6m24 (AAVDJ-CaMKIIα-GCaMP6m) and bReaChES16,25–27, a red-shifted channelrhodopsin derived from the multicellular green algae Volvox carteri16 (AAV8-CaMKIIα--bReaChES-TS-p2A-mCherry), into the OFC and implanted a custom-designed gradient index (GRIN) lens (corrected for wavelength λ = 1,015 nm, diameter = 1 mm, length = 4 mm) directly above the viral targeting site (~2.6 mm ventral; Fig. 1a–c and Extended Data Fig. 1a, b). We observed robust co-expression of GCaMP6m and bReaChES-mCherry in OFC neurons (Fig. 1d and Extended Data Fig. 1c–h). In vivo spiral stimulation of individual OFC cells expressing GCaMP6m and bReaChES using dual two-photon laser beams (920 nm for GCaMP6m excitation and 1,060 nm for bReaChES activation; Fig. 1e–h) yielded time-locked optogenetically evoked responses, which were stable across multiple stimulations, at the single-cell level (5-s stimulation, 20-μm spirals, 1-ms spiral duration, 4 revolutions per site, 0.12-ms inter-site interval; Fig. 1i, Extended Data Fig. 2 and Supplementary Video 1).
Fig. 1 |. Single-cell two-photon readout and control of OFC neuronal activity in vivo.
a, b, Scheme for targeting OFC with a viral mixture of AAVDJ-CaMKIIα-GCaMP6m and AAV8-CaMKIIα-bReaChES-TS-p2A-mCherry (a) and an implanted GRIN lens (1-mm diameter, 4-mm long, corrected for λ = 1,015 nm) ~2–3 mm ventral (b). Image in a and b is adapted from ref.30. c, Confocal 10× image of a 1-mm thick coronal CLARITY section displaying location of GRIN lens and GCaMP6m expression within the OFC. A, anterior; D, dorsal; L, lateral; M, medial; P, posterior; V, ventral. Scale bar, 500 μm. d, Airyscan 40× images showing co-localization (bottom) of GCaMP6m (top left) and bReaChES-mCherry (top right) in OFC cells. Image from a representative mouse; the experiment was repeated in n = 6 mice with similar results. Scale bars, 20 μm. e, Optical design and dual laser beam paths used for single-cell two-photon resonant scanning (λ = 920 nm; 20–30 mW) and optogenetic manipulations (λ = 1,060 nm; 40–60 mW per spiral target). PMT, gallium arsenide phosphide photomultiplier tube; galvos, galvonomic mirrors; dichroic, dichroic mirror. f, In vivo two-photon visualization of OFC cells co-expressing (bottom) GCaMP6m and bReaChES-mCherry (top). Image from a representative mouse; the experiment was repeated in six mice with similar results. g, Example field of view depicting two-photon stimulation-targeted cells (red circles) and non-targeted neighbouring cells (green circles). Scale bar, 100 μm. h, Diagram illustrating sequential single-cell spiral-stimulation parameters (20-μm spirals, 1-ms spiral duration, 4 revolutions per site, 0.12-ms inter-site interval). i, Ca2+ transients of stimulation-targeted (red) and non-targeted (green) neurons, measured as the relative change in fluorescence (dF/F), demonstrating precise optogenetic activation across multiple stimulations at the single-cell level.
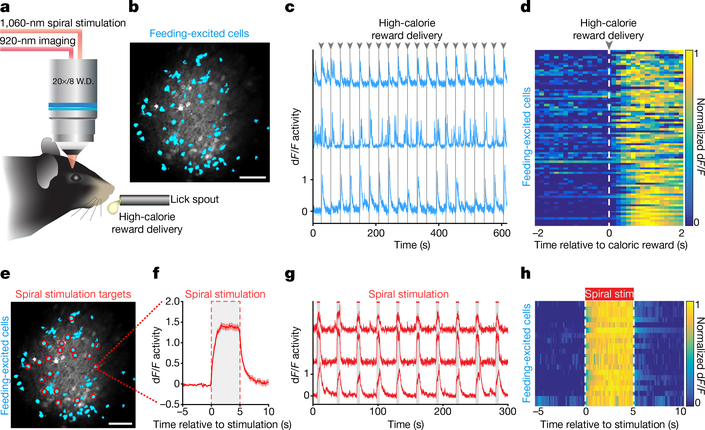
To identify and individually target feeding-responsive OFC neurons for optogenetic spiral stimulation, we first imaged neuronal activity in head-fixed mice while they received a high-calorie liquid reward every 30 s across 20 trials (Fig. 2a, b). Distinct OFC neurons that demonstrated significant excitatory responses (using Wilcoxon signed-rank test) during the first 2 s of caloric-reward consumption compared to the previous baseline 2 s (Fig. 2c, d and Supplementary Video 2) were classified as feeding-responsive cells, and were selectively targeted for two-photon spiral stimulation (Fig. 2e and Extended Data Fig. 3a–c). Optogenetic stimulation of single feeding-identified OFC neurons resulted in reliable and temporally precise neuronal activity responses (5-s stimulation, 20-μm spirals, 1-ms spiral duration, 4 revolutions per site, 0.12 ms inter-site interval; Fig. 2f–h and Supplementary Video 3).
Fig. 2 |. Identifying and targeting activity-specific OFC neurons for cellular-resolution optogenetic perturbations.
a, Design for classifying feeding-responsive OFC neurons during head-fixed licking behaviour (liquid high-calorie reward delivered every 30 s across a 10-min session). b, Identified feeding-responsive cells (cyan) from a GCaMP6m-bReaChES mouse. Image from a representative mouse; the experiment was repeated in six mice with similar results. Scale bar, 100 μm. c, Example Ca2+ traces of feeding-responsive neurons reliably responding to multiple reward deliveries. d, Normalized average Ca2+ responses to caloric rewards delivered every 30 s across 20 trials from an example animal (n = 81 feeding-responsive cells). e, Individual feeding-responsive neurons were selectively targeted for spiral stimulation (n = 20 stimulation-targeted feeding cells). Scale bar, 100 μm. f, Mean Ca2+ response to 20 trials of 5-s stimulation from an individual feeding-responsive neuron. Region between dashed lines indicates stimulation period. g, Example Ca2+ traces of feeding-responsive cells displaying responses to 5-s stimulation. Note that, if desired, the method allows temporal dispersion or staggering of stimulation timing across individual cells. h, Normalized average Ca2+ activity of feeding-responsive neurons across 20 trials of 5-s stimulation (n = 20 cells).
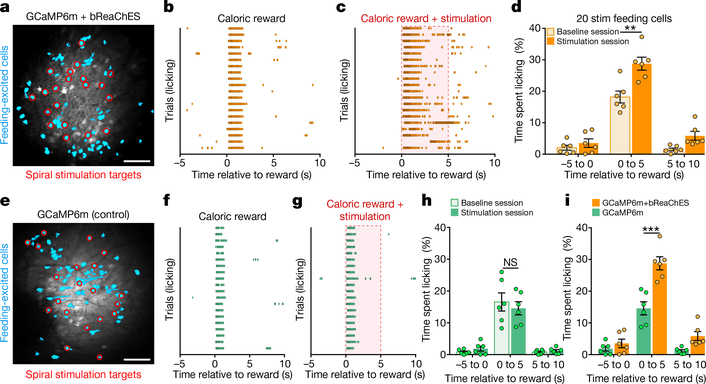
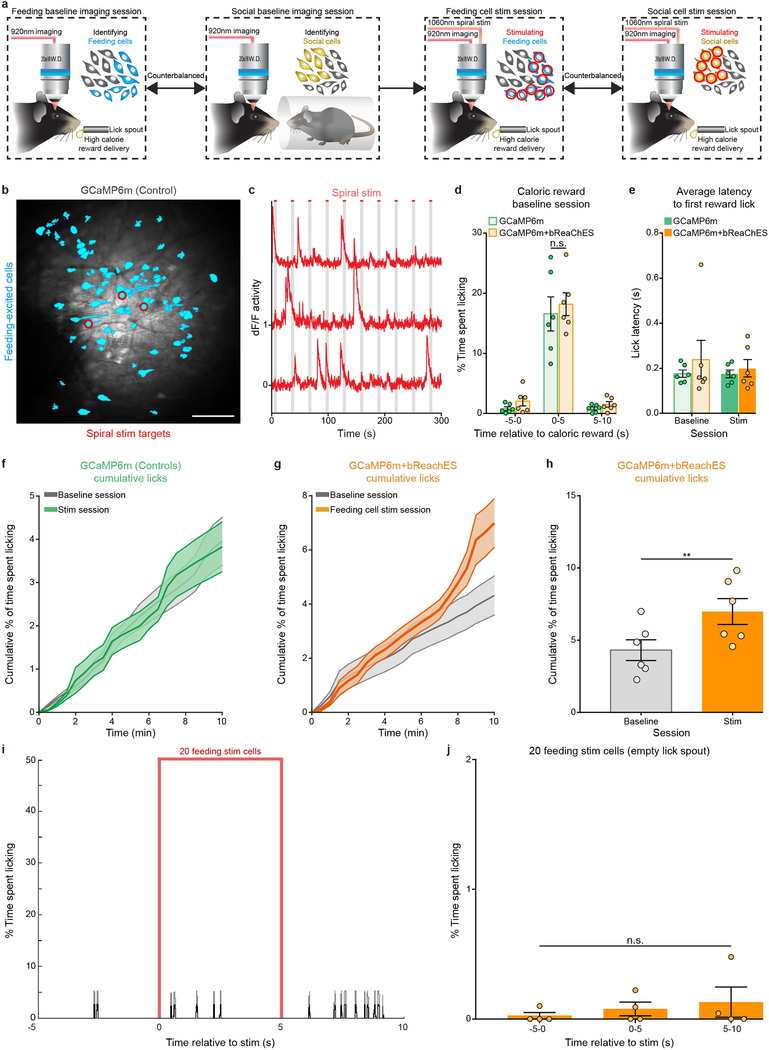
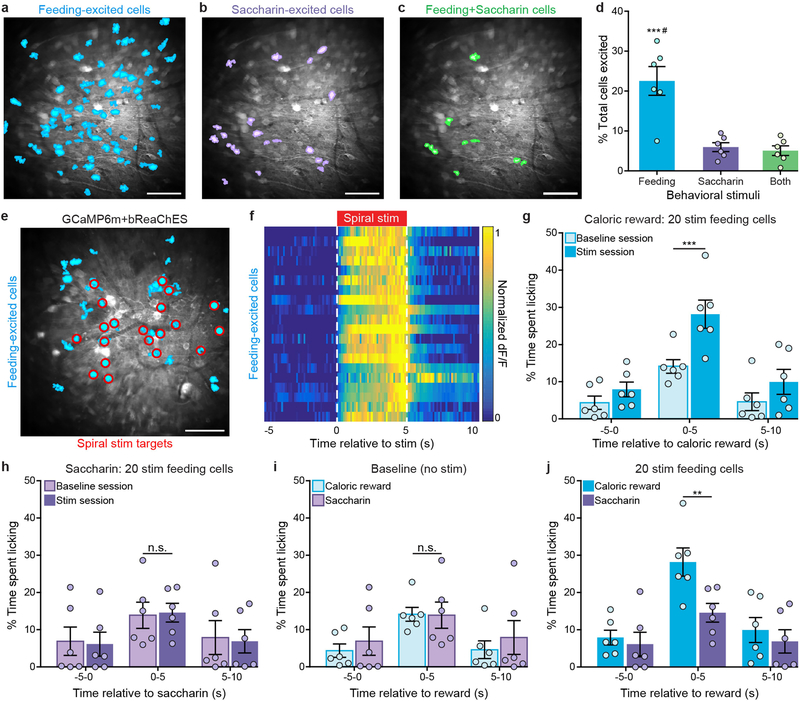
We next sought to determine whether precise modulation of these distinct feeding-responsive cells during reward delivery could influence feeding behaviour. Indeed, pairing each caloric-reward delivery with 5-s spiral stimulation of feeding-responsive cells expressing GCaMP6m and bReaChES significantly increased licking when compared to baseline sessions in which stimulation was absent (Fig. 3a–d; n = 6 GCaMP6m-bReaChES mice, n = 20 spiral-stimulation targets per mouse; interaction F2,10 = 7.538, P = 0.001, two-way ANOVA with repeated measures), whereas targeting of GCaMP6m-expressing feeding cells in control mice lacking an opsin did not alter licking behaviour (Fig. 3e–h; n = 6 GCaMP6m mice; interaction F2,10 = 3.88, P = 0.51 two-way ANOVA with repeated measures; Extended Data Fig. 3d, e). In general, stimulation of feeding-responsive cells in GCaMP6m-bReaChES mice significantly increased licking compared to GCaMP6m control mice (Fig. 3i and Extended Data Fig. 3f–h; n = 6 mice per group, interaction F2,30 = 9.93, P < 0.0001, two-way ANOVA). However, stimulation of feeding-responsive neurons in GCaMP6m-bReaChES mice did not increase licking at an empty lick spout (Extended Data Fig. 3i, j; n = 4 mice, F2,6 = 1.19, P = 0.37, one-way ANOVA with repeated measures) nor at a spout providing non-caloric (0.1% saccharin) rewards (Extended Data Fig. 4), suggesting that the functional properties of these feeding-responsive neurons were more relevant to caloric nutrients than to reward or licking in general. We also found that both the licking behaviour and the activity of these feeding-excited neurons in response to caloric rewards were enhanced and prolonged when the caloric reward was paired with spiral stimulation (Extended Data Fig. 5a–c). Moreover, feeding-responsive neurons represented the time spent licking, as subsets of feeding-responsive cells displayed increased activity responses during increased bouts of naturalistic licking and decreased activity responses during reduced bouts of naturalistic licking (Extended Data Fig. 5d–g). Thus, multiple single-cell stimulation of naturally feeding-responsive neurons enhanced both feeding behaviour and neuronal activity responses to caloric rewards, revealing a causal link between OFC activity and animal behaviour at the level of individually identified neurons.
Fig. 3 |. Activity-guided optogenetic stimulation of individual feeding-specific OFC neurons promotes caloric-reward licking.
a, Cell masks of identified feeding-responsive neurons (cyan) and spiral-stimulation targets (red) from a GCaMP6m-bReaChES mouse. Image from a representative mouse; the experiment was repeated in n = 6 mice with similar results. Scale bar, 100 μm. b, c, Lick raster during a baseline (b; caloric reward delivered every 30 s, 20 total trials) and stimulation (c; each caloric reward paired with 5-s stimulation of 20 feeding-responsive neurons) session from a GCaMP6m-bReaChES mouse. d, Single-cell stimulation of feeding-responsive neurons significantly increased reward licking in GCaMP6m-bReaChES mice compared to baseline sessions (n = 6 mice, interaction F2,10 = 7.538, P = 0.001, two-way ANOVA with repeated measures). e, Feeding-responsive neurons (cyan) and spiral-stimulation targets (red) from an animal expressing GCaMP6m. Image from a representative mouse; the experiment was repeated in n = 6 mice with similar results. Control mice expressed GCaMP6m and lacked bReaChES expression. Scale bar, 100 μm. f, g, Lick raster during baseline (f) and stimulation (g) sessions from a GCaMP6m mouse. h, Spiral-stimulation targeting of feeding-responsive neurons did not significantly affect licking behaviour in GCaMP6m mice (n = 6 mice, interaction F2,10 = 3.88, P = 0.51, two-way ANOVA with repeated measures). i, Single-cell stimulation of feeding-responsive neurons significantly increased licking in GCaMP6m-bReaChES mice when compared to GCaMP6m mice (n = 6 mice per group, interaction F2,30 = 9.93, P < 0.0001, two-way ANOVA). Data replotted from d and h. Two-way ANOVA followed by Bonferroni post hoc comparisons.
*P < 0.05, **P < 0.001, ***P < 0.0001; NS, non-significant (P > 0.05).
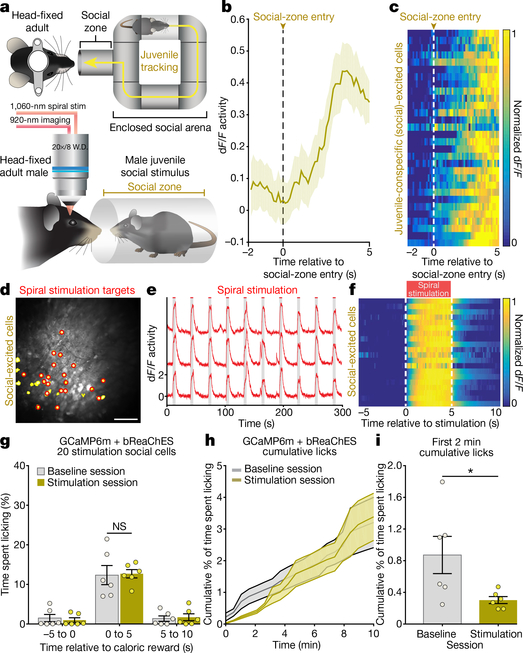
To determine whether the behavioural effects of single-cell stimulation were specific to activation of feeding-responsive cells, we next sought to identify and stimulate OFC cells that responded to a condition not involving caloric rewards or feeding processes, such as social interaction. We carried out Ca2+ imaging in head-fixed adult mice while freely moving conspecific juvenile mice (as the social stimulus) were tracked (Fig. 4a and Extended Data Fig. 6a, b). This enabled identification of a distinct subset of OFC cells that exhibited increased activity as the juvenile mice approached and interacted with the head-fixed adult mouse (Fig. 4b, c, Extended Data Fig. 6c–i and Supplementary Video 4). Neurons that exhibited a significant response to the first 5 s of social interaction compared to the previous 2 s of baseline activity (Wilcoxon signed-rank test) were classified as juvenile- conspecific (social)-responsive neurons. Distinct OFC ensembles were found to respond to social versus caloric stimuli (Extended Data Fig. 7a–f; n = 11 mice, n = 3,235 total cells, n = 822 feeding-responsive cells, n = 331 social-responsive cells, n = 190 feeding-and-social- responsive cells; total caloric-reward deliveries = 20, number of juvenile zone entries = 17 ± 1 (unless otherwise stated data presented as a range are mean ± s.e.m.), coefficient of variation (CV) of responses of feeding-excited cells to caloric-reward deliveries = 1.74 ± 0.07, CV of responses of feeding-excited cells to social-zone entries = 12 ± 1; CV = (s.d. of response size)/(mean of response size), calculated per mouse). Identified social-responsive neurons also displayed minimal overlap with neurons excited by adult-conspecific social stimulus, a novel object (a 3D-printed artificial mouse; Supplementary Video 5) or recordings of ultrasonic vocalization (USV) (Extended Data Fig. 7g–r; number of juvenile zone entries = 17 ± 2, number of adult zone entries = 15 ± 2, total novel object presentations = 20, total USV presentations = 20), demonstrating the identification of activity-defined OFC ensembles that are selectively responsive to interaction with juvenile social stimuli. This does not exclude the possibility of cells weakly or jointly responsive to multiple types of stimuli that were not identifiable through our detection and analysis.
Fig. 4 |. Selective optogenetic activation of juvenile-conspecific (social) responsive OFC neurons disrupts licking.
a, Setup for head-fixed two-photon Ca2+ imaging during social-behaviour tracking. b, Average Ca2+ activity from an example social-responsive cell following the social stimulus (juvenile male) approaching in close proximity (social-zone entry) to the head-fixed GCaMP6m-bReaChES mouse (13 social-zone entries, n = 1 cell from 1 mouse). c, Normalized mean Ca2+ responses to social-zone entries from a representative mouse (13 zone entries, n = 30 social-responsive cells). d, Cell masks of identified social-responsive neurons (yellow) and 20 spiral-stimulation targets (red; scale bar, 100 μm). e, Ca2+ transients from example stimulation-targeted social-responsive neurons displaying time-locked responses to 5-s stimulation. f, Normalized average Ca2+ responses to 20 trials of 5-s stimulation from an example GCaMP6m-bReaChES mouse (n = 20 social-responsive cells). g, Single-cell optogenetic activation of social-responsive neurons did not significantly increase reward licking in GCaMP6m-bReaChES mice when compared to baseline sessions (n = 6 mice, interaction F2,10 = 0.36, P > 0.99, two-way ANOVA with repeated measures followed by Bonferroni post hoc comparisons). h, Average cumulative lick rate (30-s bins) across 10-min baseline and social-responsive cell stimulation sessions in GCaMP6m-bReaChES mice (n = 6). i, GCaMP6m-bReaChES mice display decreased cumulative licking within the first 2 min of the social-cell stimulation session when compared to the first 2 min of the baseline session (n = 6 mice, t5 = 2.59, P = 0.04, two-sided paired t-test). *P < 0.05; NS, non-significant (P > 0.05).
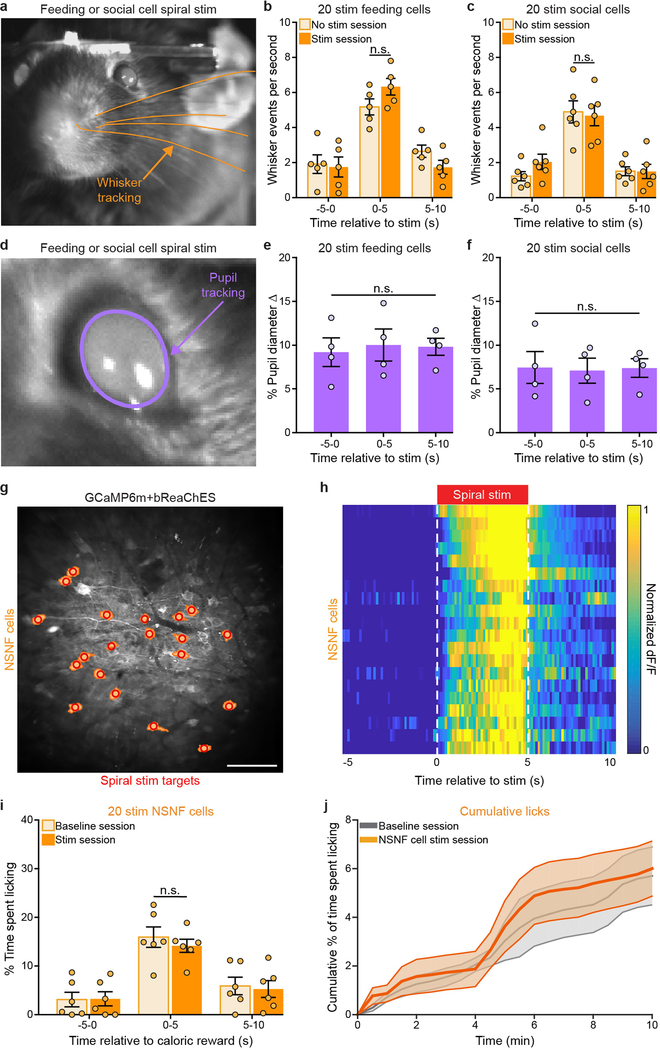
Single-cell spiral stimulation of juvenile-conspecific (social)-responsive neurons produced reliable, temporally precise Ca2+ responses (Fig. 4d–f and Supplementary Video 6). However, in contrast to the behavioural effects of stimulating feeding-responsive cells, coupling optogenetic activation of individual social-responsive neurons with caloric-reward delivery did not increase time spent licking (Fig. 4g; n = 6 mice, n = 20 spiral-stimulation targets per mouse; interaction F2,10 = 0.36, P > 0.99, two-way ANOVA with repeated measures). Of note, optogenetic activation of social-specific cells instead significantly reduced licking (initial 2 min of the stimulation session versus initial 2 min of non-stimulation baseline sessions; Fig. 4h, i; n = 6 mice; t5 = 2.59, P = 0.04, two-sided paired Student’s t-test). Thus, in contrast to feeding-responsive cells, social-specific OFC neurons inhibited this consummatory behaviour. Congruently, naturalistic social interaction with a juvenile disrupted licking behaviour within the first 2 min of a 10-min session during which the adult mouse had free access to a lick spout containing high-calorie liquid rewards (Extended Data Fig. 8a–g; n = 6 mice, interaction F5,15 = 3.398, P = 0.029, one-way ANOVA with repeated measures). This time window of feeding disruption was aligned with a significant increase in social interactions with the juvenile-conspecific mouse during the first 2 min of the 10-min session (Extended Data Fig. 8h, i; n = 6 mice, interaction F2,10 = 15.53, P = 0.0009, two-way ANOVA with repeated measures). Stimulation of either feeding-responsive or social-responsive neurons did not disrupt sensory-related processes, including whisking activity (Extended Data Fig. 9a–c; feeding-responsive cell stimulation: n = 5 mice, interaction F2,8 = 2.31, P > 0.99, two-way ANOVA with repeated measures; social-responsive cell stimulation: n = 6 mice, interaction F2,10 = 0.61, P > 0.99, two-way ANOVA with repeated measures) and pupil diameter (Extended Data Fig. 9d–f; feeding-responsive cell stimulation: n = 4 mice, F2,6 = 0.17, P = 0.85, one-way ANOVA with repeated measures; social-responsive cell stimulation: n = 4 mice, F2,6 = 0.05, P = 0.95, one-way ANOVA with repeated measures), indicating that the reduction in licking caused by stimulation of social-responsive cells is not associated with gross alteration in these sensory detection processes. Finally, as an additional control, we identified cells that did not exhibit a significant response to either social or feeding stimuli (non-social- and non-feeding-responsive cells, NSNF). We found that spiral stimulation of NSNF cells did not alter licking for caloric rewards (Extended Data Fig. 9g–j; n = 20 NSNF cells stimulated per mouse, n = 6 mice, interaction F2,10 = 1.76, P = 0.51, two-way ANOVA with repeated measures), further highlighting the behavioural specificity of the effects of stimulating either feeding-responsive or social-responsive cells. The sequence of baseline imaging and stimulation sessions within a day was counterbalanced across animals, and the full experimental panel was conducted consecutively within a single day for each animal (see Methods for a detailed outline of each experimental sequence).
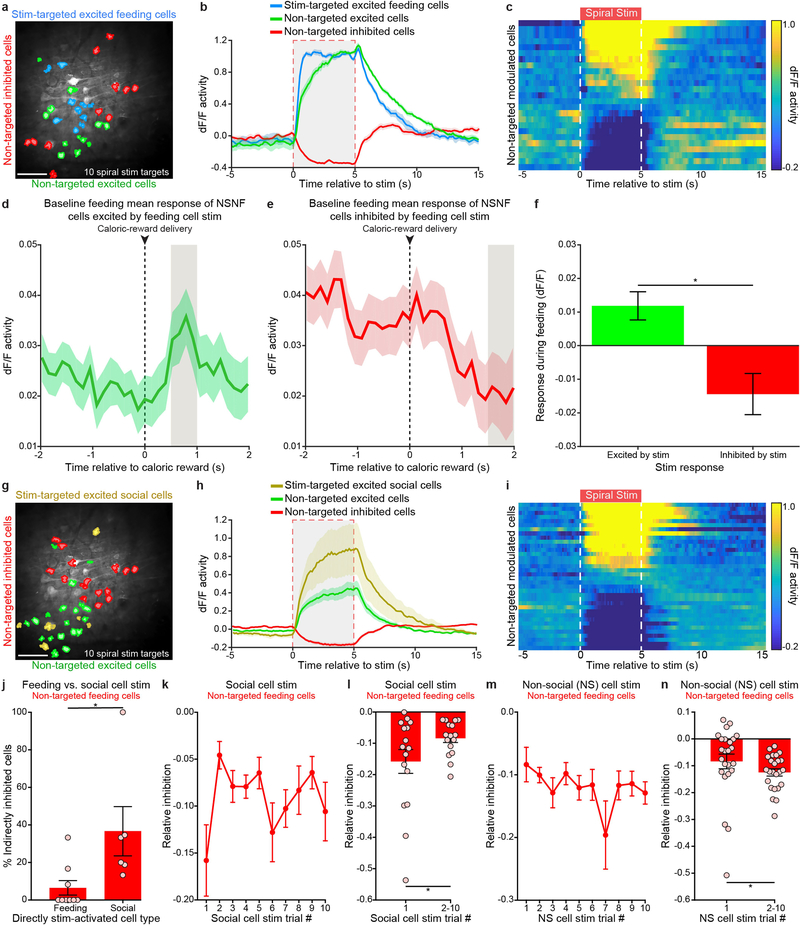
The opposing effects of stimulating feeding-responsive and social-responsive cells on feeding behaviour could partly result from local circuit processing. We explored the possible influences of activity-defined cellular ensembles on local OFC network activity by individually targeting members of each cell class with optogenetic spiral stimulation in the absence of behavioural stimuli. In addition to the direct and expected excitatory effects on the targeted cells, we found that two-photon spiral stimulation of feeding-responsive neurons produced excitatory and inhibitory effects in local non-directly targeted cells that were generally similar to those observed during naturalistic caloric consumption (Supplementary Note 1 and Extended Data Fig. 10a–f). Thus, specific and behaviourally relevant subnetworks may be engaged when feeding-responsive neurons are stimulated, driving downstream behaviour. We next tested for local-activity effects of stimulating similar numbers of social-responsive neurons (Extended Data Fig. 10g) in the same mice. As with stimulation of feeding-responsive neurons, we observed excitatory and inhibitory responses in non-targeted cells during stimulation of social-responsive neurons and, in particular, we noted that stimulation of social-responsive neurons may inhibit feeding-responsive neurons to a greater extent than stimulation of feeding-responsive neurons (Supplementary Note 1 and Extended Data Fig. 10h–j). Concordant with the initial decrease in feeding behaviour selectively caused by activation of social-responsive neurons (Fig. 4h, i), we found that selective stimulation of social-responsive cells inhibited non-targeted feeding-responsive neurons most potently during the initial stimulation trial of social-responsive cells (Supplementary Note 1 and Extended Data Fig. 10k–n).
The results shown here provide perspective on the role of natural-activity-defined OFC subnetworks in controlling feeding behaviour, revealing the existence of functionally defined feeding and social subnetworks. These results also provide an initial demonstration of specific control of mammalian behaviour by selective recruitment of multiple singly defined neurons, in all-optical experiments that leverage the ability of this experimental framework to modulate individual cells that may be sparsely distributed and are defined by directly observed natural activity during behaviour. These activity-defined feeding and social OFC subnetworks were capable of exerting specific and potent influences—most robustly upon feeding behaviour itself—with effects on surrounding neurons both within and outside of the local subnetwork. Additional OFC subnetworks are likely to be identified in future work that encode similarly behaviourally relevant and salient stimuli, and that when engaged—either naturally or optogenetically—may alter feeding and other behaviours.
Whereas these studies were carried out in mice, previous anatomical tracing and functional imaging studies have identified interconnectivity among local clusters within macaque28 and human OFC29. Cellular-resolution work in mice could, in the long run, lead to detailed molecular and connectivity characterization of the cells participating in the feeding and social subnetworks, which may in turn lead to development of molecular and anatomical tools for targeting these classes of neurons in primates. Although primate cortex is thicker than mouse cortex, the optogenetic control achieved with the method shown here represents the deepest single-cell stimulation achieved to date (2.5–3.0 mm ventral) and, moreover, provides an initial demonstration that single-cell optogenetic targeting through a GRIN lens is feasible. Such targeting could enable investigation of the behavioural ramifications from single-cell optogenetic stimulation within various superficial or deep brain regions (that is, not limited to small animals or to superficial cortical areas that are traditionally targeted with cranial windows). Although we did not explicitly create an animal model of stress or disease for initial foundational identification of the OFC subnetworks and their interactions, our findings from disease-relevant behavioural patterns in rodents may complement future research in primate systems with potential clinical significance. More broadly, cellular-resolution insight into subnetwork interactions may lead to deeper understanding of the local and global circuit dynamics underlying the resolution of conflicting or concordant primary motivational drives.
METHODS
Mice.
Adult (~30 g, 8–10 weeks of age) male C57BL/6J mice (Jackson Laboratory, strain #000664) were maintained on a reverse 12-h dark–light cycle and were provided with food and water ad libitum before head-fixed experiments. One week before the start of two-photon behavioural experiments, mice were food-restricted to 80–85% of their initial free-feeding body weight. For same-sex, conspecific, juvenile social stimuli, male C57BL/6J mice (Jackson Laboratory, strain #000664), approximately three weeks of age, were used. All procedures met the guidelines of the National Institutes of Health Guide for the Care and Use of Laboratory Animals and were approved by the Institutional Animal Care and Use Committee at Stanford University.
Statistical reporting.
We did not use a statistical method to determine sample size a priori. We modelled sample size after existing publications using Ca2+ imaging in awake behaving mice. Prior to experiments being performed, mice were randomly assigned to experimental or control groups. While the investigator was not blinded to group allocation during data collection, all data analysis was performed automatically using MATLAB2014b, with the same code run on each experimental group. Statistical tests were performed in MATLAB2014b or Graphpad Prism 7.
Stereotactic surgery.
-type C57BL/6J (10–12-week-old) mice were anaesthetized with 1–2% isoflurane and placed in a stereotactic head apparatus (Kopf Instruments). Body temperature was maintained at 36 °C using a homoeothermic heating pad (Harvard Apparatus). Ophthalmic ointment (Akron) was applied to both eyes to prevent drying. Multiple rounds of betadine and 70% ethanol wipes were applied to the scalp and then a midline incision was made. A 1–2-mm craniotomy was drilled at the viral microinjection and GRIN lens implantation site. Opsin (GCaMP6m-bReaChES) mice were microinjected (140 nl/min) unilaterally with 1,000 nl of a 1:1 mixture of AAVDJ-CaMKIIα-GCaMP6m and AAV8-CaMKIIα-bReaChES-TS-p2A-mCherry in the OFC (A/P: +2.60 mm, M/L: ±1.26 mm, D/V: −2.80 mm) using a microsyringe pump injector with a 10-μl Nanofil syringe attached to a 33-gauge needle (World Precision Instruments). For the control (GCaMP6m) group, mice received unilateral 500-nl microinjections (140 nl/min) of AAVDJ-CaMKIIα-GCaMP6m in the OFC using the same stereotactic coordinates described above (A/P: +2.60 mm, M/L: ± 1.26 mm, D/V: −2.80 mm). All viral constructs were packaged by the Stanford Neuroscience Gene Vector and Virus Core and diluted to a final working titre of ~8 × 10¹² viral genomes per ml. For both opsin and control groups, custom-designed singlet GRIN lens (1-mm diameter, ~4-mm length, ~0.45 NA, corrected for λ = 1,015 nm; Inscopix) were stereotactically implanted directly above the OFC and positioned slightly offset from the injection site to avoid contamination from tissue damage inflicted by the microinjector needle (A/P: +2.54 mm, M/L: ±1.20 mm, D/V: –2.60 mm). The GRIN lenses and stainless-steel head plates were fixed to the skull with C&B Metabond (Parkell) and a silicone elastomer (Kwik-Cast sealant; World Precision Instruments) fully covered the top of the GRIN lens to provide a protective coating. Immediately following each surgery, mice received subcutaneous injections of buprenorphine (0.4 mg/kg) and lactated Ringer’s solution (0.4 ml).
Head-fixed behaviours.
Four to six weeks following surgery, mice were head-fixed within a plastic tube using a custom head-plate holder (Stanford Machine Shop). Custom-written Arduino scripts delivered digital control signals to trigger either high-calorie liquid rewards (Boost Very High Calorie; Nestle Health Science) or 0.1% saccharin (sodium saccharin, Sigma-Aldrich). Liquid caloric or saccharin rewards were provided through a small-animal feeding tube (Popper and Sons, 16-gauge) connected to a normally closed solenoid (Valcor). For each reward delivery, the solenoid remained open for 0.2 s every 30 s and the same amount of liquid (20 μl) was delivered for each trial (20 trials). Reward deliveries and licks were detected by an Arduino Tinkerkit interfaced with a data acquisition (DAQ) system (National Instruments). Prior to two-photon imaging and stimulation experiments, mice were acclimated to the head-fixed apparatus and underwent daily 10-min reward licking sessions for three consecutive days. For head-fixed social-behaviour experiments, an enclosed transparent behavioural arena (clear tunnel hamster tubes; Ferplast) was placed directly in front of head-fixed mice positioned below the two-photon objective for Ca2+ imaging. The custom-built social arena allowed a juvenile (about three-week-old) male (social stimulus) to navigate freely within a circular pathway (15 × 15 cm) and interact with the head-fixed animal through an extended opening (7.6 × 7.6 cm), which was blocked off by horizontal metal tubes (0.6-cm diameter; McMaster-Carr) spaced 2 cm apart. The freely moving juvenile conspecific and head-fixed adult mice were able to make physical contact through the gaps between the metal tubes, see Extended Data Fig. 6 and Supplementary Video 4 for a detailed outline of the setup. The social-behavioural arena was illuminated with infrared (850 nm) LED arrays (Thorlabs) and the juvenile’s location was recorded for 10 min using a digital webcam (Logitech) placed above the arena. The open portion of the arena containing the metal bars and extending out to the head-fixed mouse was demarcated as the social zone. Each social-zone entry performed by the juvenile conspecific was detected and transmitted to the NI-DAQ hardware using behavioural tracking software (Biobserve). Transistor-transistor logic (TTL) signals from each reward delivery, lick, social-zone entry, two-photon resonant scanning frame and spiral stimulation were time-stamped and recorded using custom MATLAB (R2014b; Mathworks) scripts to align each behavioural event to the two-photon imaging and stimulation data.
Social contact detection.
determine the activity response profiles of social-identified cells during social contact with the juvenile stimulus, video recordings (ace CMOS camera, Basler AG) were obtained during the head-fixed juvenile social assay described above. Video frames indicating social contact were classified computationally with a discriminatively trained part based model31 using custom software written in MATLAB, and extracted for downstream analysis of cell activity during these contact periods. Social contact was defined as the periods during which the test subject and freely moving conspecific experienced tactile connection, including whisker contact. Neurons displaying significant differences in the average dF/F (relative change in fluorescence) measure of activity during a 5-s period of social contact relative to baseline average dF/F activity (calculated during the 2 s before the contact, Wilcoxon signed-rank test) were classified as responsive to social contact. Neurons classified as social-contact responsive were compared to those classified as social-zone responsive, and differences in the number of excited cells during social contact compared to those excited during social-zone entry were quantified using a custom MATLAB script.
Comparing activity responses to social, novel object and ultrasonic vocalization.
In separate, counterbalanced 10-min recordings, mice were exposed to a same-sex juvenile (~3 weeks old), same-sex adult (~14 weeks old), novel object (custom 3D-printed mouse (Formlabs)), or USV recordings (~50 kHz). For novel object experiments, the custom 3D-printed mouse was fixed to a motorized flip mirror (Thorlabs) and positioned in front of the mouse subject. The 3D-printed mouse rotated into the field of view via TTL-controlled flip mirrors and made whisker contact with each mouse for 3 s every 30 s. For USV vocalization experiments, USV recordings were acquired from juvenile male mice using an ultrasonic microphone (Ultrasound Microphone, Noldus) and then played back through a speaker for 3 s every 30 s (Ultrasonic Dynamic Speaker Vifa, Avisoft). The ultrasonic speaker was configured to transmit TTL signals during USV playback via data acquisition hardware (UltraSoundGate Player 116, Avisoft) to the NI-DAQ hardware system, and playback events were aligned to each two-photon resonant scanning frame with a custom MATLAB script as described above.
Freely moving social and feeding behaviours.
Adult food-restricted males were placed in a home cage with free access to a lick spout containing caloric rewards. Each licking contact with the spout was accompanied by equal volume (20 μl) solenoid-controlled delivery of the caloric reward and detected and recorded by an Arduino Tinkerkit interfaced with a DAQ system (National Instruments). Once stable licking was achieved (3 consecutive days of 30 min access to the lick spout), a novel object (3D-printed mouse), adult conspecific or a juvenile conspecific was manually placed into the cage containing the lick spout and contact made with the spout during licking bouts was recorded for 10 min using a custom MATLAB script. A different novel object, adult or juvenile stimulus was used for each trial. Percentage of time spent licking was quantified by dividing the time spent licking (computed from the recorded number of licks) by the total trial time, binned at 30-s intervals. Social interaction across each 10-min session was video-recorded with a camera (ace CMOS camera, Basler) positioned above the test cage and then manually scored following testing. Social interaction was defined as sniffing of the stranger’s (juvenile-and adult-conspecific) snout, flank or anogenital area, as well as grooming of the stranger mouse. Consistent with previously published papers, experimental mice interacted longer with the novel juvenile mouse during the first 2 min of the 10-min session, and interacted more with the novel juvenile mouse compared to the novel object32–35.
In vivo two-photon Ca2+ imaging and optogenetic spiral stimulation.
All in vivo two-photon experiments were conducted with a customized Ultima IV microscope (Bruker Corporation) and a 20×/0.45-NA LCPLN20XIR objective (Olympus). Two separate femtosecond-pulsed laser beams controlled by independent sets of XY galvanometric scanning mirrors were used for simultaneous Ca2+ imaging and optogenetic stimulation experiments. The imaging laser beam was raster-scanned with 8-kHz resonant galvanometer mirrors and relayed onto a pair of 6-mm galvanometer mirrors, while the stimulation beam was scanned by a separate pair of 6-mm galvanometer mirrors. The imaging laser was tuned to 920 nm (Chameleon Ultra II Ti-Sapphire; Coherent) to excite GCaMP6m, and the red-shifted opsin (bReaChES) was excited with a separate femtosecond-pulsed laser (Discovery System; Coherent) tuned to 1,060 nm. Less than 40 mW of power (λ = 920 nm) was used for Ca2+ imaging (as measured after the GRIN lens), and 40–60 mW of power (λ = 1,060 nm) was exposed to the sample plane for each spiral stimulation. The power output of both lasers was modulated independently by separate Pockels cells (Conoptics) and the individual beams were combined in the scan head with a 1,030-nm short-pass dichroic mirror (Chroma Technology). GCaMP6m and mCherry signals were separated through a dichroic beamsplitter (FF555-Di03 filter cube; Semrock) and detected with two gallium arsenide phosphide photomultiplier tubes (Hamamatsu). A single field of view (512 × 512 pixels; 508 × 508 μm) was imaged at 30 frames per second with temporal averaging of 4 frames (final frame rate = 7.5 Hz) for each animal.
Sequential spiral stimulation was performed using Prairie View 5.4 software (Bruker Corporation). Spiral-stimulation patterns (20-μm diameter, 1-ms duration, 4 revolutions per site, 0.12-ms inter-site interval, 20 spiral points: 223 repetitions and 10 spirals: 446 repetitions for a total stimulation duration of 5 s) were selectively targeted to individual activity-specific cells by importing pre-defined x–y coordinates acquired from previous imaging sessions into the spiral-stimulation module in Prairie View. Because the two excitation wavelengths, 920 and 1,060 nm, possess different focal lengths through the GRIN lens, 2× achromatic AR-coated Galilean beam expanders (Thorlabs) were aligned within the stimulation path and the beam divergence of the stimulation path was adjusted to attain parfocality with the imaging path through the GRIN lens. To achieve this, a GRIN lens was positioned beneath the objective at the working distance of the objective (~8 mm) and a fluorescent slide (Chroma Technology) was placed below the GRIN lens at the object side working distance of the GRIN lens (~150 μm). Next, a fiducial marker on the slide was brought into focus through the GRIN lens with the imaging laser and then holes were burned using the stimulation laser, while simultaneously adjusting the focus of the collimator lenses until the two beams were co-planar; spiral points burned at the same z position of the fiducial marker within the imaging plane.
Two-photon image processing and analysis.
To identify and locate feeding- and social-responsive cells, mice underwent a baseline feeding-reward imaging session (caloric or saccharine rewards delivered every 30 s for 20 trials) and then a subsequent baseline social-imaging session (social-zone entries monitored across a 10-min recording); the sequence of baseline imaging sessions was counterbalanced. Immediately following both baseline Ca2+ imaging sessions, acquired time series data were transferred to a separate analysis computer and motion-corrected with translation registration (TurboReg; ImageJ). Next, individual neurons were segmented and extracted using principal component analysis (PCA) and independent component analysis (ICA) algorithms via MATLAB36. The x–y centroid location and normalized changes in fluorescence (dF/F) of each cell were determined using custom-written MATLAB scripts; dF/F was calculated for each cell by subtracting a single baseline fluorescence value from each time point of the entire fluorescence time series, and dividing that output by the baseline fluorescence. Baseline fluorescence was computed as the median fluorescence value throughout the entire recording.
Identifying and targeting activity-specific cells for spiral stimulation.
Extracted IC units were classified as feeding-responsive cells if a significant difference existed between the average dF/F activity 2 s before and 2 s after the caloric-reward delivery using Wilcoxon signed-rank test. Neurons were deemed social-responsive if the average dF/F activity 5 s after social-zone entry was significantly greater than the average dF/F activity 2 s before social-zone entry. Cells that did not display significant responses to either caloric-reward deliveries or social-zone entries were classified as NSNF responsive. The x–y centroid location of each classified cell type within the field of view was exported from MATLAB on the analysis computer and then imported directly into Prairie View on the two-photon acquisition computer. Next, non-overlapping feeding, social or NSNF neurons (n = 20 cells) were individually targeted for spiral stimulation during separate, counter-balanced caloric-reward + stimulation imaging sessions (caloric reward paired with 5-s stimulation of either feeding, social or NSNF cells; 30-s interval, 20 trials, 10-min total duration). Baseline and stimulation behavioural experiments were conducted on the same day for each mouse, including feeding, social, and NSNF stimulation experiments. The order of baseline (identification of activity-distinct cell type) and stimulation sessions was counterbalanced. It is important to acknowledge that other feeding-, social-and non-responsive cells may exist within each field of view, but are not detected and targeted for stimulation owing to the lack of GCaMP6bReaChES expression.
Removal of stimulation artifact.
An imaging artefact is present in the GCaMP acquisition channel as a result of non-negligible GCaMP excitation with the stimulation light source (λ = 1,060 nm) during spiral stimulation. As a result, the sequential spiral stimulation of each neuron will impose a spatially varying background offset to an artefact-free image. For example, an optogenetic exposure time (texp; for example, 1 ms) spiral would be responsible for an offset across 512 × texp/Δt lines, where Δt = 33 ms (the frame exposure time). This offset is approximated here by a statistical assumption that a difference between the time-averaged frames associated with spiral stimulation versus the artefact-free frames would yield a first-order estimate of the bias function to subtract from each frame during the stimulation period. The temporal averaging of the image acquisition (4 frames) is found to have further improved the suitability of this correction. Furthermore, the time series of all non-stimulation image frames was used to estimate the vignetting function of the GRIN lens as a two-dimensional Gaussian fit, and this smoothly varying function was used as an improved spatial constraint against which to contrast the stimulation frames, the difference of which provided the artefact bias estimate of the stimulation versus artefact-free frames.
Network effects of activity-specific single-cell stimulation.
In a separate set of experiments, mice received single-cell stimulation in the absence of any other stimuli to determine the network effects of activity-specific stimulation. First, feeding- and social-responsive neurons were identified from individual feeding (caloric reward) and social baseline imaging sessions. Next, ten of the feeding- and social-responsive cells displaying the strongest magnitude in responses were targeted for spiral stimulation in separate, counterbalanced sessions for each animal. Mice received 5-s spiral stimulations (30-s interval) for 10 trials (5-min total duration) in the absence of caloric rewards and social stimuli. Neurons were considered responsive to the optogenetic stimulus if they met both requirements: 1) the average dF/F activity during the 5-s stimulation was significantly different from the baseline average dF/F activity during the 5 s before the stimulation (Wilcoxon signed-rank test), and 2) the average dF/F activity during the 1 s after the 5-s stimulation was significantly different from the baseline average dF/F activity during the 5 s before the stimulation. This ensured that any remaining stimulation artefacts were not incorrectly assigned as optogenetic-induced responses (because of the tau-off of GCaMP6m, true optogenetic responses should have a slow decay in the fluorescence following the termination of the stimulation).
Whisker-movement and pupil-size tracking during social- or feeding-cell stimulation.
In separate experiments, 20 feeding- or social-excited cells were targeted with 5-s spiral stimulation (30-s interval) during a 10-min recording. First, a baseline recording of whisker movement and pupil size in the absence of stimulation (stimulation laser shutter closed) was performed and then a 10-min stimulation session was recorded. Whisker movements and pupil size were detected with an acA1300–200um CMOS camera (Basler AG) and recorded with a custom MATLAB script at a resolution of 450 × 500 pixels and frame rate of 393 frames per second. Pupil illumination was achieved with infrared (850 nm) LED arrays (Thorlabs) and additional infrared light transmitted from the microscope during two-photon imaging and stimulation sessions. Whisker movements were analysed with the Whisk custom automated whisker-tracking software written in MATLAB and Python, and angle of deflection from the follicle base was calculated as previously described37. Whisker-twitching events were quantified by comparing changes in the angle of deflection for a given whisker in the current frame to the angle in the previous frame across stimulation and non-stimulation trials and binned into three periods: pre-stimulation (5-s before stimulation to stimulation onset), stimulation (stimulation onset to 5 s after onset), and post-stimulation (5 s after onset to 10 s after onset). Auditory noise from spiral-stimulation-scanning galvo mirrors was detectable during the 5-s stimulation period during both the stimulation trial (stimulation laser shutter open) and the non-stimulation trial (stimulation laser shutter closed). Differences in unidirectional movement above a threshold of 1.5 degrees were classified as a whisker twitching event. Pupil segmentation was performed using a custom MATLAB script, and fluctuations in pupil diameter were quantified as previously described38. The average percentage change in pupil diameter during stimulation was computed by subtracting the pupil diameter at each video frame during the stimulation trial from an average baseline pupil diameter, defined as the mean of the pupil diameter during the non-stimulation trial, and dividing the absolute value of this difference by the average baseline pupil diameter.
Excitation efficiency and spatial resolution of single-cell spiral stimulation through a GRIN lens.
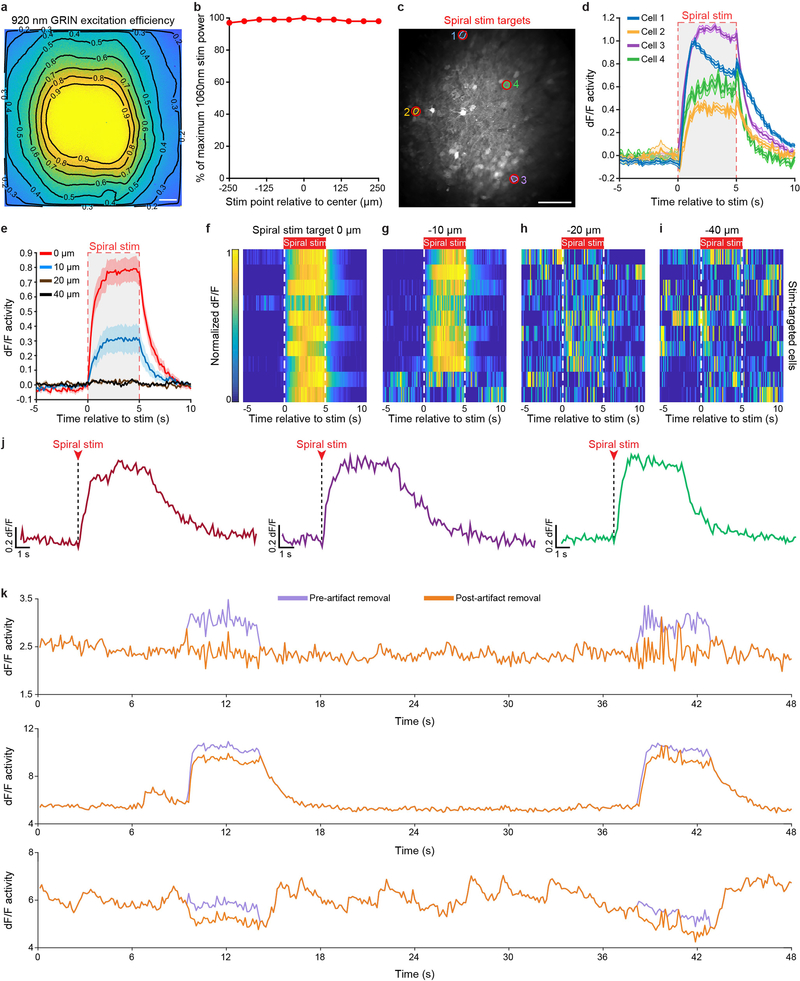
The distribution of fluorescent intensity was obtained from the ratio of the normalized images from a uniformly fluorescent slide when taken at λ = 920 nm (for multi-photon) and λ = 488 nm (for single photon, to account for any photon-collection losses of the GRIN image). To demonstrate the spatial resolution of two-photon spiral stimulation, 10 cells were targeted with 20-μm spiral points during a 5-min recording (5-s stimulation every 30 s). In separate 5-min recordings, each spiral was positioned 10, 20 or 40 μm laterally from the centre point of the targeted cells and then the same stimulation parameters were repeated for each lateral offset (10, 20 and 40 μm). If the centre of the spiral point was moved 10 μm away from the centre point of the targeted cell then the stimulation response was dampened (Extended Data Fig. 2g), most likely owing to the opening of fewer channels, since a small portion of the spiral point was still covering some of the targeted cell. However, when the spiral point was moved 20–40 μm away from the centre point of the targeted cell, no stimulation response was observed (Extended Data Fig. 2h, i).
Experiment sequences.
See Extended Data Fig. 3a for a schematic of the experiment sequence.
Experiment 1, identification and stimulation of feeding and social cells.
All within the same day, each mouse underwent consecutive baseline feeding and social-imaging experiments to identify each distinct cell type (counterbalanced; each experiment lasted 10 min). Next, after each cell type was identified, mice were exposed to either stimulation of feeding or social cells (20 stimulation-targeted cells per mouse; counterbalanced) during each caloric-reward delivery (each stimulation session lasted 10 min). This experiment was performed in a single day, and in the same field of view (FOV) for each mouse.
Experiment 2, identification and stimulation of NSNF cells.
On a separate day from other experiment types, each mouse underwent consecutive baseline feeding and social-imaging sessions to identify feeding and social cells (counterbalanced; 10 min for each imaging session). Immediately afterwards, NSNF neurons were identified from these datasets. Next (still on the same day), NSNF cells were stimulated during caloric-reward delivery (10-min duration). This experiment was performed in the same FOV for each mouse.
Experiment 3, identification of juvenile-conspecific, adult-conspecific, novel object and USV excited cells.
On a separate day from other experiment types, mice were exposed to either a juvenile-conspecific, adult-conspecific, novel-object or USV recording (all stimuli exposures were counterbalanced). All of these imaging sessions (10 min each) were conducted on the same day and in the same FOV for each mouse (mean number of juvenile zone entries = 17 ± 2, mean number of adult zone entries = 15 ± 2, total novel-object presentations = 20, total USV presentations = 20).
Experiment 4, network stimulation effects of feeding and social cells.
On a separate day from other experiment types, each mouse underwent baseline feeding and social-imaging experiments to identify feeding and social cells (counterbalanced; 10 min for each imaging session). Next, mice were exposed to either stimulation of feeding or social cells (counterbalanced) in the absence of behavioural stimuli to determine the network effects of activating each cell type (each stimulation session = 10 min). This experiment was performed in a single day, and in the same FOV for each mouse.
Histology.
Following in vivo two-photon experiments, mice were deeply anaesthetized with euthasol (100 mg/kg) and then perfused with cold phosphate-buffered saline (PBS) and 4% paraformaldehyde (PFA). Brains were extracted and placed in PFA for 24 h and then transferred to 30% sucrose/PBS solution at 4 °C. Extracted brains were sliced into 60-μm coronal sections using a frozen microtome (Leica Biosystems) and coverslipped with anti-fade mounting medium (SlowFade Diamond Antifade Mountant with DAPI; Thermo Fisher Scientific). Z stacks of the OFC were captured on a Zeiss LSM 880 Airyscan microscope consisting of a 40× objective (Zeiss) to visualize co-localization of CaMKIIα-GCaMP6m and CaMKIIα-bReaChES-TS-p2A-mCherry. To verify the location of the GRIN lens and GCaMP6m expression within OFC, opsin and control mice were perfused with a 1% hydrogel solution and then underwent CLARITY processing as previously described39. CLARITY coronal sections (1-mm thick) were mounted and tiled z stacks were acquired on an upright confocal with a 10× objective (Olympus). For GABA immunostaining, 40-μm OFC sections expressing CaMKIIα-GCaMP6m were incubated for 1 h in a blocking solution of PBS + 0.3% Triton-X100 (PBST) containing 5% normal donkey serum (NDS). Then, sections were incubated in primary rabbit GABA antibody (A2052; 1:500; Sigma-Aldrich) + 5% NDS in PBST for 48 h at 4 °C. Following four room-temperature 10-min PBS washes, sections were then incubated in Alexa 647-conjugated donkey anti-rabbit antibody (711–605-152; 1:500; Jackson ImmunoResearch Laboratories) + 5% NDS in PBST for 2 h at room temperature. Sections were then coverslipped with anti-fade mounting medium (SlowFade Diamond Antifade Mountant with DAPI; Thermo Fisher Scientific) and 20 ×z stacks of the OFC were captured (LSM 880; Zeiss).
Reporting summary.
Further information on research design is available in the Nature Research Reporting Summary linked to this paper.
Code availability.
Custom MATLAB scripts that support the finding of this study are available upon request from the corresponding author.
Data availability
The data that support the finding of this study are available upon request from the corresponding author.
Extended Data
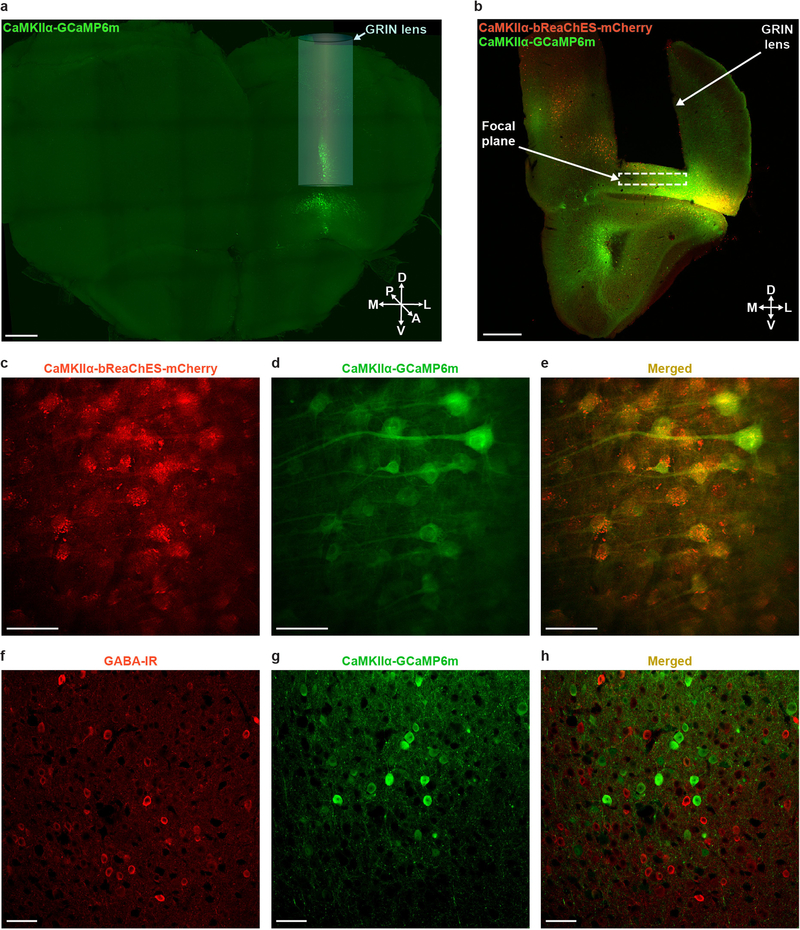
Extended Data Fig. 1 |. Targeting OFC for two-photon cellular-resolution Ca2+ imaging and optogenetic stimulation.
a, Confocal 10× tiled image of a 1-mm-thick coronal CLARITY section displaying the location of the GRIN lens and GCaMP6m expression within OFC. A, anterior; D, dorsal; L, lateral; M, medial; P, posterior; V, ventral. Scale bar, 500 μm. b, Confocal 10× image from a 60-μm coronal slice depicting GRIN lens implantation and viral targeting site within OFC. Scale bar, 500 μm. c–e, Additional representative in vivo two-photon images of OFC cells co-expressing GCaMP6m and bReaChES-mCherry from a different focal plane. Images from a representative mouse; the experiment was repeated in n = 6 mice with similar results. Scale bars, 100 μm. f–h, Confocal 20× images of the OFC showing GABA immunolabelling (f) and CaMKIIα-GCaMP6m expression (g) with minimal overlap (h). Images from a representative mouse; the experiment was repeated in n = 6 mice with similar results. Scale bars, 50 μm.
Extended Data Fig. 2 |. Characterization of spiral stimulation through a GRIN lens.
a, Heat map representing the relative probability for multiphoton absorption across the FOV of a typical GRIN lens as measured by the ratio of the normalized images from a bulk fluorescence slide acquired by multi-photon (920 nm) and single-photon (488 nm) excitation, which accounts for photon collection losses. Scale bar, 50 μm. b, The power output of the 1,060-nm stimulation beam at the distal tip of a GRIN lens is constant across the entire FOV, indicating that the most probable loss mechanism for two-photon excitation is optical aberration. Stimulation laser power readouts were obtained while moving the spiral point at 50-μm increments across the FOV (500 μm). c, Cell masks of stimulation-targeted cells near the edge and centre of the GRIN lens from an example animal. Image from a representative mouse; the experiment was repeated in n = 6 mice with similar results. Scale bar, 100 μm. d, Mean Ca2+ activity of stimulation-targeted cells near the edge of the GRIN lens is comparable to the average activity responses of stimulation-targeted neurons located near the centre of the GRIN lens (10 stim trials, n = 4 stim-targeted cells from 1 mouse). The shaded region indicates stimulation time points. e, Average Ca2+ activity in response to the spiral-stimulation targets positioned 0 μm (red), 10 μm (blue), 20 μm (brown) and 40 μm (black) away (in the x–y plane) from the centre point of each stimulation-targeted neuron (10 stimulation trials per position, 30-s interval, 5-s spiral stimulation, 10 spiral-stimulation targets, n = 10 stimulation-targeted cells from one mouse). Shaded region indicates stimulation time points. f–i, Mean Ca2+ activity of stim-targeted cells in response to the spiral point distance (in the x–y plane) of 0 μm (f), 10 μm (g), 20 μm (h) and 40 μm (i; n = 10 stimulation-targeted cells from one mouse; this experiment was repeated in n = 3 mice with similar results). j, Representative zoomed-in Ca2+ activity traces during 5-s spiral-stimulation trials. k, Example Ca2+ traces from individual neurons showing responses before (purple) and following (orange) the removal of the spiral-stimulation artefact, present in the GCaMP acquisition channel owing to non-negligible GCaMP excitation with the stimulation light source (λ = 1,060 nm) during spiral stimulation. At 30-Hz image acquisition, for every 1 ms of the spiral photostimulation duration, the photostimulation artefact would contaminate ~17 consecutive image lines with an approximately uniform background. This artefact was estimated on a per-image-line basis as the average increase in signal during the stimulation frames from the image frames which occurred without photostimulation and then removed across each image line using custom MATLAB scripts (Methods).
Extended Data Fig. 3 |. Single-cell optogenetic stimulation of feedingexcited neurons.
a, Schematic outlining the experiment sequence for identification and stimulation of feeding- or social-excited cells. b, Cell masks of identified feeding-excited neurons (cyan) and spiral-stimulation targets (red) from a GCaMP6m (control) mouse. Image from a representative mouse; the experiment was repeated in n = 6 mice with similar results. Scale bar, 100 μm. c, Spiral stimulation of feeding-excited neurons in a GCaMP6m mouse did not produce time-locked optogenetic-evoked responses. d, During a caloric-reward baseline session (no stimulation), GCaMP6m + bReaChES and GCaMP6m mice did not exhibit a significant difference in licking. n = 6 mice per group, interaction F2,30 = 0.05, P = 0.95, two-way ANOVA followed by Bonferroni post hoc comparisons. e, Spiral stimulation of feeding-excited neurons did not significantly alter the latency to first lick following each caloric-reward delivery in GCaMP6m + bReaChES and GCaMP6m mice. n = 6 mice per group, interaction F1,20 = 0.15, P = 0.69, two-way ANOVA followed by Bonferroni post hoc comparisons. f, g, Average cumulative lick rate (30-s bins) across 10-min baseline and feeding-cell stimulation sessions in GCaMP6m (f) and GCaMP6m + bReaChES mice (g; n = 6 mice per group). h, GCaMP6m + bReaChES mice display increased cumulative licking across the entire feeding-cell stimulation session when compared to the baseline session. n = 20 feeding-stimulated cells per mouse, n = 6 mice, t5 = 8.250, P = 0.0004, two-sided paired t-test. i, Average lick rate from an example GCaMP6m + bReaChES animal during a feeding-cell stimulation session when the lick spout was empty (no caloric rewards; 10-min session; n = 20 feeding-stimulated cells). j, Stimulation of feeding-responsive cells in GCaMP6m + bReaChES mice did not alter licking for an empty lick spout (no caloric rewards; n = 4 mice, F2,6 = 1.19, P = 0.37, one-way ANOVA with repeated measures). **P < 0.001; n.s., nonsignificant (P > 0.05).
Extended Data Fig. 4 |. Single-cell stimulation of feeding-excited OFC neurons increases licking for caloric rewards, but not for saccharin.
a–c, Cell masks of feeding caloric-excited (a), saccharin-excited (b) and feeding (caloric + saccharin)-excited neurons (c) from an example animal. Images from one representative mouse; the experiment was repeated in n = 6 mice with similar results. Scale bars, 100 μm. d, The proportion of identified feeding-excited neurons is significantly greater than that for saccharin and feeding + saccharin cell types. n = 1,070 total cells, feeding-excited mean = 38 ± 8.1 cells, saccharin-excited mean = 20 ± 3.8 cells, feeding+saccharin mean = 8 ± 1.5 cells, n = 6 mice; F2,15 = 18.6, P < 0.0001, one-way ANOVA. e, Cell masks of identified feeding-excited neurons (cyan) and spiral-stimulation targets (red) from a GCaMP6m + bReaChES mouse. Image from one representative mouse; the experiment was repeated in six mice with similar results. Scale bar, 100 μm. f, Normalized mean Ca2+ activity of feeding-excited neurons across 20 trials of 5-s stimulation (n = 20 cells). g, Single-cell stimulation of feeding-excited neurons significantly increased caloric-reward licking in GCaMP6m + bReaChES mice compared to baseline sessions. n = 20 feeding-stimulated cells per mouse, n = 6 mice; interaction F2,10 = 18.0, P < 0.0001. h, Spiral stimulation of feeding-responsive cells did not significantly alter licking for a 0.1% saccharin solution. n = 20 feeding-stimulated cells per mouse, n = 6 mice; interaction F2,10 = 0.72, P = 0.99. i, Baseline licking for caloric and saccharin rewards did not significantly differ in GCaMP6m + bReaChES mice. n = 6 mice; interaction F2,10 = 3.21, P = 0.99. j, Single-cell stimulation of feeding-excited neurons significantly increased caloric licking in GCaMP6m + bReaChES mice when compared to saccharin licking (n = 6 mice, interaction F2,10 = 7.976, P = 0.002). Two-way ANOVA with repeated measures followed by Bonferroni post hoc comparisons. **P < 0.001, ***P < 0.0001; ***#P significant across all comparisons; n.s., non-significant (P > 0.05).
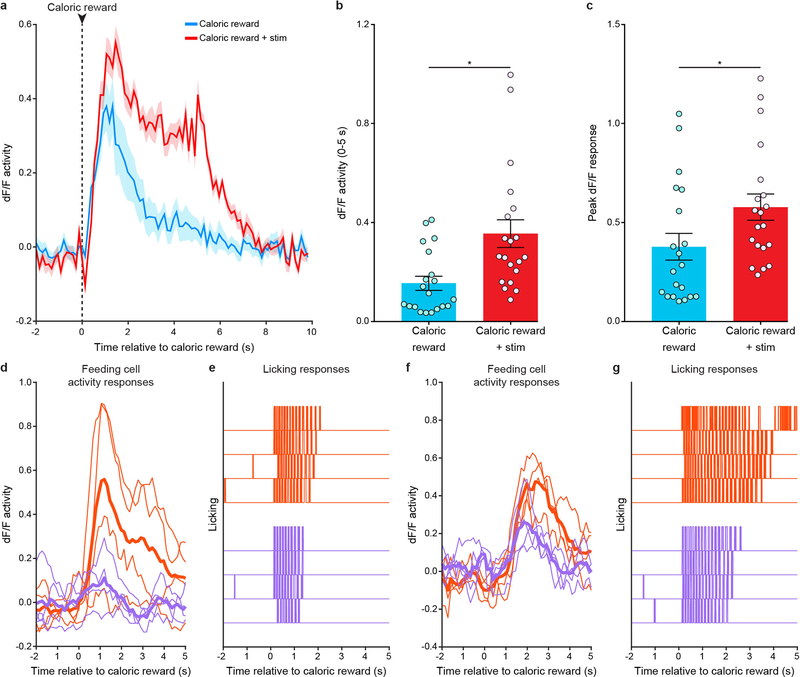
Extended Data Fig. 5 |. Activity signals in feeding-excited neurons in response to caloric rewards were enhanced and prolonged when caloric-reward delivery was paired with single-cell two-photon stimulation.
a, Mean Ca2+ signals in feeding-excited cells in response to caloric-reward delivery or 5-s spiral stimulation paired with caloric-reward delivery. n = 20 caloric-stimulated cells from 1 mouse. b, Average Ca2+ signals in feeding-excited cells during the first 5 s following stimulation + caloric reward were significantly greater than the activity responses from the first 5 s following caloric-reward delivery (n = 20 feeding-stimulated cells from 1 mouse; t19 = 2.950, P = 0.008, two-sided paired t-test). c, Mean peak Ca2+ signals in feeding-excited cells during stimulation + caloric-reward delivery were significantly greater than during caloric-reward delivery alone. n = 20 feeding-stimulated cells from 1 mouse; t19 = 2.122, P = 0.047, two-sided paired t-test. d, Example dF/F responses to caloric-reward deliveries on 4 longest lick-bout trials (orange; 0.67 s) and 4 shortest lick-bout trials (purple; 1.77 s) from an example animal during the baseline caloric-reward session. e, Corresponding lick rasters for long (orange) and short (purple) trials. Feeding-cell activity responses displayed significant changes during short versus long lick-bout trials. n = 81 feeding-excited cells, mean dF/F = 0.13 ± 0.019 versus 0.15 ± 0.020; Z = 3.4, P = 0.0007, two-sided Wilcoxon signed-rank test. f, g, Example dF/F responses to caloric rewards from another representative mouse (f) and corresponding lick rasters (g; n = 76 feeding-excited cells, mean dF/F = 0.073 ± 0.0083 versus 0.10 ± 0.012; Z = 2.6, P = 0.0098, two-sided Wilcoxon signed-rank test). *P < 0.05.
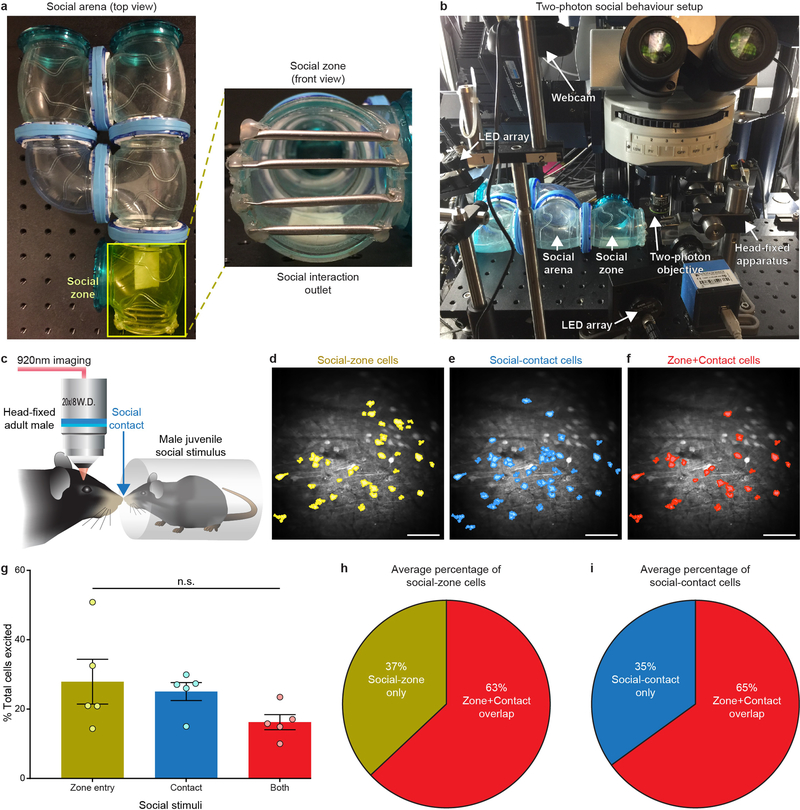
Extended Data Fig. 6 |. Head-fixed two-photon investigation of social behaviours.
a, The social-behavioural arena (left) and the opening of the social zone, where physical contact occurs between freely moving juvenile and head-fixed mice (right). b, The setup for monitoring social behaviour during in vivo head-fixed two-photon Ca2+ imaging. c, Identification of OFC cells that respond to physical contact with a juvenile social stimulus. d–f, Cell masks of social-zone (d; juvenile social-stimulus zone entry), social-contact (e; juvenile social-stimulus contact) and zone + contact-excited neurons (f) from an example animal. Images from one representative mouse; this experiment was repeated in six mice with similar results. Scale bars, 100 μm. g, The proportion of identified socialzone, social-contact, and zone + contact-excited neurons exhibited no significant differences. Mean number of juvenile zone entries = 18 ± 3, mean number of social contacts = 34 ± 6; n = 943 total cells from 5 mice, social-zone-excited mean = 54 cells ± 13, social-contact-excited mean = 48 cells ± 6.5, zone + contact-excited mean = 31 ± 4.9 cells; F2,12 = 2.1, P = 0.2, one-way ANOVA. h, i, The average percentage of social-zone (h) and social-contact (i) neurons that significantly responded during both social readouts. Neurons that exhibited a significant response to the first 5 s of social-zone entry or social contact compared to the previous 2 s of baseline activity were classified as social-zone or social-contact neurons using a two-sided Wilcoxon signed-rank test with a P < 0.05 threshold. All data are plotted as mean ± s.e.m; n.s., nonsignificant (P > 0.05).
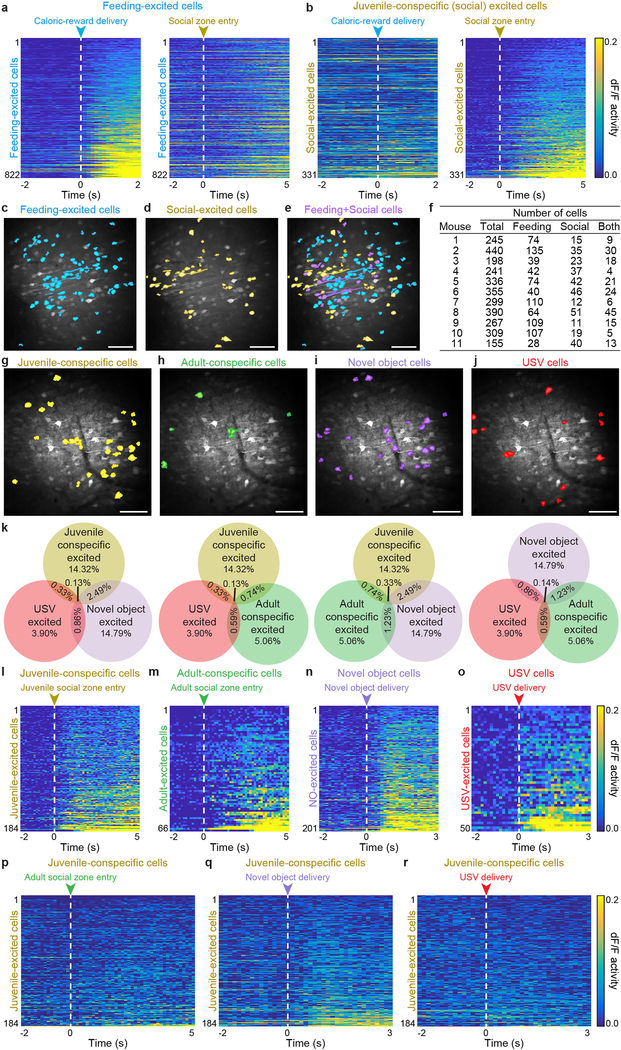
Extended Data Fig. 7 |. Distinct juvenile-conspecific (social) excited neurons demonstrate minimal overlap with cells excited by the presentation of caloric rewards, novel objects or ultrasonic vocalization recordings.
a, Mean Ca2+ responses from feeding-excited cells in response to caloric-reward delivery (left; CV of responses to caloric-reward delivery = 1.74 ± 0.07; CV = (s.d. of response size)/(mean of response size), calculated per mouse) and to juvenile socialzone entries (right; CV of responses to social-zone entries = 13 ± 1.19, n = 822 caloric-excited cells from 11 mice; cells are sorted in the same order across the two behavioural stimuli.). Neurons were classified as feeding-responsive if a significant difference existed between the mean dF/F activity 2 s before and 2 s after the caloric-reward delivery (20 total caloric-reward deliveries) using two-sided Wilcoxon signed-rank test with a P < 0.05 threshold. b, Mean Ca2+ responses of social-excited neurons to caloric-reward deliveries (left; CV = 23 ± 6.80) and social-zone entries (right; CV = 1.69 ± 0.08, n = 331 social-excited cells from 11 mice). Social-responsive cells were identified by comparing the mean Ca2+ responses 2 s pre- and 5 s post-social-zone entry. Number of juvenile zone entries = 17 ± 1; two-sided Wilcoxon signed-rank test with a P < 0.05 threshold. c–e, Cell masks of feeding-excited (c), social-excited (d) and feeding + social-excited neurons (e) from an example animal. Images from a representative mouse; the experiment was repeated in six mice with similar results. Scale bars, 100 μm. f, Contingency table showing the total number of cells detected in the FOV, and the number of feeding-excited, social-excited, or feeding + social-excited (both) cells per mouse. g–j, Cell masks of juvenile-conspecific (g), adult-conspecific (h), novel-object (i; NO), and USV (j) excited neurons from an example animal. Images from a representative mouse; the experiment was repeated in six mice with similar results. Scale bars, 100 μm. For novel-object experiments, a custom 3D-printed mouse was presented to each real mouse for 3 s every 30 s during a 10-min recording. For USV experiments, a 50-kHz USV recording was played through a speaker for 3 s every 30 s during a 10-min imaging session. Number of juvenile zone entries = 17 ± 2; mean number of adult zone entries = 15 ± 2; 20 novel-object presentations; 20 total USV presentations). Novel-object and USV cells were identified by comparing the mean Ca2+ activity 2 s before and 3 s after novel-object or USV delivery using a two-sided Wilcoxon signed-rank test with a P < 0.05 threshold; juvenile- and adult-conspecific cells were identified by comparing the mean Ca2+ 2 s before and 5 s after social-zone entry. k, The proportion of cells that are excited by juvenile conspecific (26 cells ± 3.7), USV (7 cells ± 2.0), novel object (mean = 29 cells ± 7.8), adult conspecific (mean = 9 cells ± 2.0), juvenile conspecific + USV (0.7 cells ± 0.47), juvenile conspecific + novel object (5 cells ± 2.4), juvenile conspecific + adult conspecific (1.6 cells ± 0.84), novel object + adult conspecific (2.4 cells ± 0.90), novel object + USV (1.6 cells ± 0.43), adult conspecific + USV (1.1 cells ± 0.40), juvenile conspecific + USV + NO (0.3 cells ± 0.18), juvenile conspecific + USV + adult conspecific (0.3 cells ± 0.18), juvenile conspecific + NO + adult conspecific (0.7 cells ± 0.42), adult conspecific + NO + USV (0.3 cells ± 0.29), and juvenile conspecific + NO + USV + adult conspecific (0.1 cells ± 0.14). n = 1,268 total cells from 7 mice. l–o, Mean Ca2+ responses of cells excited by juvenile social-zone entries (l; n = 184 juvenile-conspecific excited cells; CV = 1.7 ± 0.12, CV = (s.d. of response size)/(mean of response size), calculated per mouse), adult social-zone entries (m; n = 66 adult-conspecific excited cells, CV = 4 ± 2.6), novel-object presentations (n; n = 201 NO-excited cells, CV = 1.67 ± 0.050), or USV deliveries (o; n = 50 USV-excited cells from 7 mice, CV = 1.85 ± 0.070). p–r, Mean Ca2+ activity of juvenile-conspecific excited neurons (n = 184 juvenile-conspecific excited cells from 7 mice) in response to adult social-zone entries (p; CV = 11 ± 2.4), novel-object presentations (q; CV = 11 ± 2.0), or USV deliveries (r; CV = 16 ± 4.0).
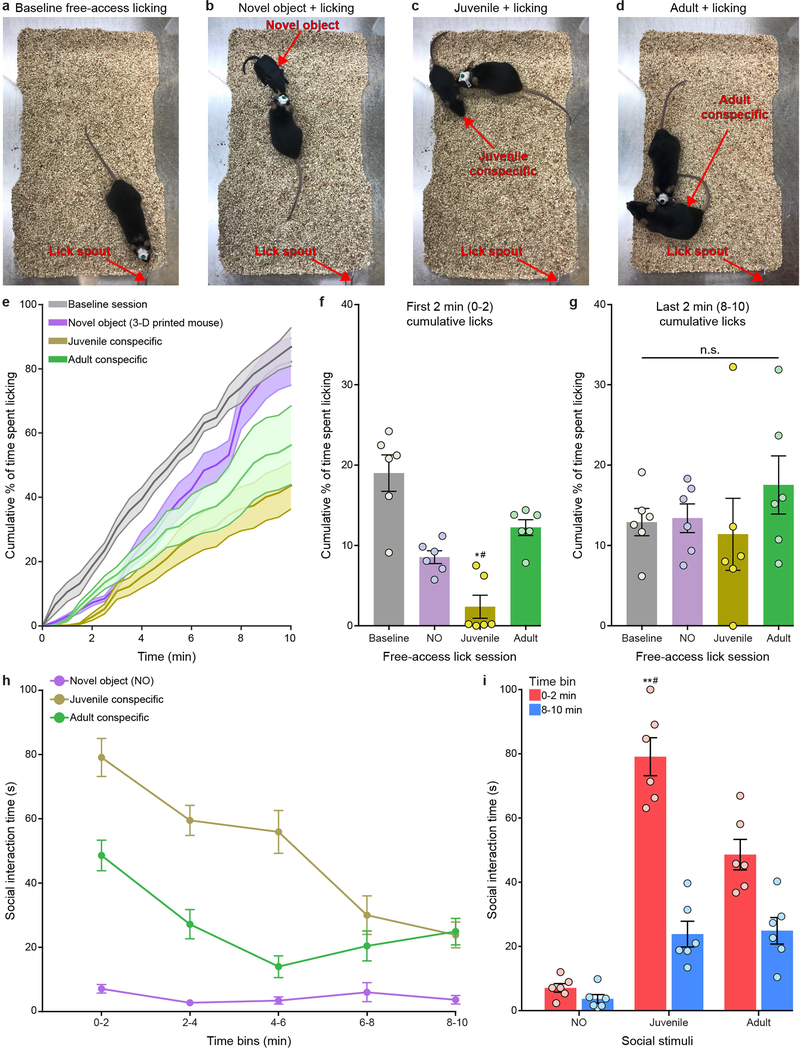
Extended Data Fig. 8 |. Social interaction disrupts caloric intake.
a–d, Setup for separate, counterbalanced 10-min sessions of free-access caloric licking during baseline (a), novel object (b), juvenile social interaction (c) and adult social interaction (d). e, Average cumulative lick rate (30-s bins) across 10-min baseline, novel object (3D-printed mouse), juvenile and adult social-interaction sessions (n = 6 mice). f, GCaMP6m + bReaChES mice display decreased cumulative licking within the first 2 min of the juvenile social-interaction session when compared to the first 2 min of the baseline, novel-object and adult social-stimulus sessions. n = 6 mice; interaction F5,15 = 3.398, P = 0.029, one-way ANOVA with repeated measures. g, Cumulative licking did not significantly differ within the last 2 min of the baseline, novel-object, juvenile and adult social-interaction sessions. n = 6 mice; interaction F5,15 = 1.714, P = 0.192, one-way ANOVA with repeated measures. h, Time course for interactions with juvenile, adult and novel object during each 2-min bin across each 10-min free-access licking session. n = 6 mice. i, Time spent interacting with juvenile conspecifics was significantly greater during the first 2 min than the last 2 min of the 10-min session and when compared to interactions with adult conspecifics and novel object. n = 6 mice; interaction F2,10 = 15.53, P = 0.0009, two-way ANOVA with repeated measures. *#P and **#P significant across all comparisons; n.s., non-significant (P > 0.05).
Extended Data Fig. 9 |. Activation of feeding- or social-excited cells does not alter whisker activity or pupil diameter and activation of NSNF neurons does not affect licking.
a, Representative whisker (orange) tracking from an example GCaMP6m + bReaChES mouse. b, c, Two-photon spiral stimulation of 20 feeding-or social-excited cells per animal does not significantly alter whisker activity. Animals are able to detect noise produced from the spiral-stimulation galvanometer mirrors during both no stimulation (laser shutter closed) and stimulation (laser shutter open) sessions, as demonstrated by a significant increase in classified whisking events during the spiral scanning period (b; unstimulated, 0 to 5 s versus –5 to 0 s: n = 5 mice, interaction F2,8 = 68.34, P = 0.02; and stimulated 0 to 5 s versus −–5 to 0 s: n = 5 mice, interaction F2,8 = 68.34, P = 0.002, two-way ANOVA with repeated measures); this sensory response was not disrupted by spiral stimulation of feeding (b; n = 5 mice, interaction F2,8 = 2.31, P > 0.99, two-way ANOVA with repeated measures) or social (c; n = 6 mice, interaction F2,10 = 0.61, P > 0.99, two-way ANOVA with repeated measures) cells. d, Representative pupil-diameter tracking (purple) from an example GCaMP6m + bReaChES mouse. e, f, Pupil diameter is not significantly affected by stimulation of 20 feeding (e; n = 4 mice, F2,6 = 0.17, P = 0.85, one-way ANOVA with repeated measures) or social (f; n = 4 mice, F2,6 = 0.05, P = 0.95, oneway ANOVA with repeated measures) cells. g, Cell masks of neurons that do not display significant responses to either feeding or social stimuli (NSNF cells; orange) and spiral-stimulation targets (red) from a GCaMP6m + bReaChES mouse. Image from n = 1 representative mouse; this experiment was repeated in six mice with similar results. Scale bar, 100 μm. h, Normalized mean Ca2+ activity of NSNF neurons across 20 trials of 5-s stimulation. n = 20 stimulation-targeted NSNF cells. i, Single-cell stimulation of NSNF neurons did not significantly alter licking for caloric rewards in GCaMP6m + bReaChES mice when compared to baseline sessions. n = 20 NSNF-stimulated cells per mouse, n = 6 mice; interaction F2,10 = 1.76, P = 0.51, two-way ANOVA with repeated measures. j, Average cumulative lick rate (30-s bins) across 10-min baseline and NSNF cell stimulation sessions in GCaMP6m + bReaChES mice. n = 6 mice. n.s., non-significant (P > 0.05).
Extended Data Fig. 10 |. Alterations in local network activity from in vivo single-cell optogenetic stimulation of activity-specific OFC neurons.
a, Example field of view displaying stimulation-targeted feeding-excited (blue), non-targeted indirectly excited (green) and non-targeted indirectly inhibited (red) neurons from a GCaMP6m + bReaChES mouse. Image from a representative mouse; the experiment was repeated in six mice with similar results. Scale bar, 100 μm. b, Mean Ca2+ responses in feeding-excited neurons activated by direct stimulation (blue), and in nontargeted cells indirectly excited (green) or inhibited (red), in an example mouse. n = 10 successfully targeted feeding-excited cells, n = 13 nontargeted excited cells, n = 11 non-targeted inhibited cells. c, Mean Ca2+ responses of indirectly modulated cells in response to stimulation of 10 feeding-excited neurons from a GCaMP6m + bReaChES mouse (5-s stimulation delivered every 30 s for 10 trials). Neurons were considered responsive to the optogenetic stimulus if both the mean dF/F during the 5-s stimulation and the mean dF/F during the 1 s after the 5-s stimulation were significantly different from the baseline mean dF/F during the 5 s before the stimulation. d, Mean Ca2+ responses (in response to caloric-reward delivery during baseline imaging sessions) from NSNF neurons (that had been classified as such by virtue of individual-cell statistics during feeding and social experience) that were found at the population level to demonstrate significant excitation in response to optogenetic activation of feeding cells. n = 97 NSNF cells from 9 mice; mean response (dF/F during 0.5-s grey-shaded bar – dF/F 0 5 s before caloric delivery) = 0.012 ± 0.004; Z = 2.4, P = 0.016, two-sided Wilcoxon signed-rank test. e, Mean Ca2+ responses (in response to caloric-reward delivery during baseline imaging sessions) from NSNF cells (classified as such by virtue of individual-cell statistics during feeding and social experience) that were significantly inhibited by feeding-cell stimulation. n = 95 NSNF cells from 9 mice, mean response (dF/F during 0.5-s greyshaded bar – dF/F 0.5 s before caloric delivery) = –0.014 ± 0.006; Z = –2.3, P = 0.023, two-sided Wilcoxon signed-rank test. f, The mean positive response of the excited cells was significantly greater than the mean negative response of the inhibited cells. n = 97 excited NSNF cells and 95 inhibited NSNF cells from 9 mice; Z = 3.2, P = 0.0012, two-sided Wilcoxon rank-sum test. g, Cell masks of stimulation-targeted juvenile-conspecific (social; yellow), non-targeted indirectly excited (green), and non-targeted indirectly inhibited (red) neurons from a GCaMP6m + bReaChES mouse. Image from a representative mouse; this experiment was repeated in six mice with similar results. Scale bar, 100 μm. h, Mean Ca2+ responses of social-excited neurons activated by direct stimulation (yellow) and non-targeted cells indirectly excited (green) or inhibited (red) from an example mouse Ten spiral-stimulation targets, n = 7 successfully targeted social cells, n = 20 non-targeted excited cells, n = 16 non-targeted inhibited cells. i, Mean Ca2+ responses of indirectly modulated cells in response to direct activation of social-excited neurons (5-s stimulation delivered every 30 s for 10 trials). j, The percentage of indirectly inhibited cells that were feeding-responsive was significantly greater for social-cell stimulation than for feeding-cell stimulation. Social-cell stimulation: 3 ± 1 indirectly inhibited feeding cells, 11 ± 4 total indirectly inhibited cells; n = 6 mice; feeding-cell stimulation: 0.8 ± 0.5 indirectly inhibited feeding cells, 12 ± 2 total indirectly inhibited cells; n = 9 mice; two-sided Mann–Whitney test, U = 4.50, P = 0.01. k, Average inhibitory responses of non-targeted feeding-excited cells across multiple trials of social-cell stimulation. Ten social-cell stimulation trials, 5-s stimulation, 30-s interval. l, The average magnitude of inhibition of non-targeted feeding cells from social-cell stimulation was significantly greater during the first stimulation trial compared to subsequent stimulation trials. Ten stimulation-targeted social cells per animal; n = 16 indirectly inhibited feeding cells from 6 mice; Z = –2.1, P = 0.04, two-sided Wilcoxon signed-rank test. m, Average inhibitory responses of non-targeted feeding cells during stimulation of non-social-responsive (NS) cells (10 non-social-responsive cell stimulation trials, 5-s stimulation, 30-s interval). n, The average relative inhibition of indirectly inhibited feeding-responsive neurons during the first non-social-cell stimulation trial was significantly less than the relative inhibition during subsequent stimulation trials. Ten stimulation-targeted non-social cells per mouse, n = 24 indirectly inhibited feeding cells from 9 mice; Z = 2.1, P = 0.04, two-sided Wilcoxon signed-rank test. *P < 0.05; n.s., non-significant (P > 0.05).
Supplementary Material
Acknowledgements
We thank members of the Deisseroth laboratory for input and discussions, and particularly A. Crow for assistance with microscopy-related tasks. K.D. is supported by the Defense Advanced Research Projects Agency Neuro-FAST program, National Institute of Mental Health, National Institute on Drug Abuse, National Science Foundation, the Simons Foundation, the Tarlton Foundation, the Wiegers Family Fund, the Nancy and James Grosfeld Foundation, the H.L. Snyder Medical Foundation, and the Samuel and Betsy Reeves Fund. This work was also supported by HHWF (J.H.J.), NIDA (C.K.K.), Simons LSRF fellowship (J.H.M.), NSF GRFP (M.R.) and NIDDK (L.Y.).
Footnotes
Competing interests The authors declare no competing interests.
Reviewer information Nature thanks M. Krashes and the other anonymous reviewer(s) for their contribution to the peer review of this work.
Additional information
Extended data is available for this paper at https://doi.org/10.1038/s41586018–0866-8.
Supplementary information is available for this paper at https://doi.org/10.1038/s41586–018-0866–8.
Reprints and permissions information is available at http://www.nature.com/reprints.
Publisher’s note: Springer Nature remains neutral with regard to jurisdictional claims in published maps and institutional affiliations.
Online content
Any methods, additional references, Nature Research reporting summaries, source data, statements of data availability and associated accession codes are available at https://doi.org/10.1038/s41586–018-0866–8.
References
- 1.Caglar-Nazali HP et al. A systematic review and meta-analysis of ‘Systems for Social Processes’ in eating disorders. Neurosci. Biobehav. Rev. 42, 55–92 (2014). [DOI] [PubMed] [Google Scholar]
- 2.Higgs S & Thomas J Social influences on eating. Curr. Opin. Behav. Sci. 9, 1–6 (2016). [Google Scholar]
- 3.Mason WA, Saxon SV & Sharpe LG Preferential responses of young chimpanzees to food and social rewards. Psychol. Rec. 13, 341–345 (1963). [Google Scholar]
- 4.Behrens TEJ, Hunt LT, Woolrich MW & Rushworth MFS Associative learning of social value. Nature 456, 245–249 (2008). [DOI] [PMC free article] [PubMed] [Google Scholar]
- 5.Kennedy DP & Adolphs R The social brain in psychiatric and neurological disorders. Trends Cogn. Sci. 16, 559–572 (2012). [DOI] [PMC free article] [PubMed] [Google Scholar]
- 6.Via E et al. Abnormal social reward responses in anorexia nervosa: an fMRI study. PLoS ONE 10, e0133539 (2015). [DOI] [PMC free article] [PubMed] [Google Scholar]
- 7.Kelley AE, Baldo BA, Pratt WE & Will MJ Corticostriatal–hypothalamic circuitry and food motivation: integration of energy, action and reward. Physiol. Behav. 86, 773–795 (2005). [DOI] [PubMed] [Google Scholar]
- 8.Gutierrez R, Carmena JM, Nicolelis MAL & Simon SA Orbitofrontal ensemble activity monitors licking and distinguishes among natural rewards. J. Neurophysiol. 95, 119–133 (2006). [DOI] [PubMed] [Google Scholar]
- 9.Tremblay L & Schultz W Relative reward preference in primate orbitofrontal cortex. Nature 398, 704–708 (1999). [DOI] [PubMed] [Google Scholar]
- 10.Padoa-Schioppa C & Assad JA The representation of economic value in the orbitofrontal cortex is invariant for changes of menu. Nat. Neurosci. 11, 95–102 (2008). [DOI] [PMC free article] [PubMed] [Google Scholar]
- 11.O’Doherty JP, Deichmann R, Critchley HD & Dolan RJ Neural responses during anticipation of a primary taste reward. Neuron 33, 815–826 (2002). [DOI] [PubMed] [Google Scholar]
- 12.Jones JL et al. Orbitofrontal cortex supports behavior and learning using inferred but not cached values. Science 338, 953–956 (2012). [DOI] [PMC free article] [PubMed] [Google Scholar]
- 13.Keiflin R, Reese RM, Woods CA & Janak PH The orbitofrontal cortex as part of a hierarchical neural system mediating choice between two good options. J. Neurosci. 33, 15989–15998 (2013). [DOI] [PMC free article] [PubMed] [Google Scholar]
- 14.Watson KK & Platt ML Social signals in primate orbitofrontal cortex. Curr. Biol. 22, 2268–2273 (2012). [DOI] [PMC free article] [PubMed] [Google Scholar]
- 15.Azzi JCB, Sirigu A & Duhamel J-R Modulation of value representation by social context in the primate orbitofrontal cortex. Proc. Natl Acad. Sci. USA 109, 2126–2131 (2012). [DOI] [PMC free article] [PubMed] [Google Scholar]
- 16.Zhang F et al. Red-shifted optogenetic excitation: a tool for fast neural control derived from Volvox carteri. Nat. Neurosci. 11, 631–633 (2008). [DOI] [PMC free article] [PubMed] [Google Scholar]
- 17.Kim CK, Adhikari A & Deisseroth K Integration of optogenetics with complementary methodologies in systems neuroscience. Nat. Rev. Neurosci. 18, 222–235 (2017). [DOI] [PMC free article] [PubMed] [Google Scholar]
- 18.Yizhar O et al. Neocortical excitation/inhibition balance in information processing and social dysfunction. Nature 477, 171–178 (2011). [DOI] [PMC free article] [PubMed] [Google Scholar]
- 19.Prakash R et al. Two-photon optogenetic toolbox for fast inhibition, excitation and bistable modulation. Nat. Methods 9, 1171–1179 (2012). [DOI] [PMC free article] [PubMed] [Google Scholar]
- 20.Rickgauer JP, Deisseroth K & Tank DW Simultaneous cellular-resolution optical perturbation and imaging of place cell firing fields. Nat. Neurosci. 17, 1816–1824 (2014). [DOI] [PMC free article] [PubMed] [Google Scholar]
- 21.Carrillo-Reid L, Yang W, Bando Y, Peterka DS & Yuste R Imprinting and recalling cortical ensembles. Science 353, 691–694 (2016). [DOI] [PMC free article] [PubMed] [Google Scholar]
- 22.Packer AM, Russell LE, Dalgleish HWP & Häusser M Simultaneous all-optical manipulation and recording of neural circuit activity with cellular resolution in vivo. Nat. Methods 12, 140–146 (2015). [DOI] [PMC free article] [PubMed] [Google Scholar]
- 23.Grosenick L, Marshel JH & Deisseroth K Closed-loop and activity-guided optogenetic control. Neuron 86, 106–139 (2015). [DOI] [PMC free article] [PubMed] [Google Scholar]
- 24.Chen T-W et al. Ultrasensitive fluorescent proteins for imaging neuronal activity. Nature 499, 295–300 (2013). [DOI] [PMC free article] [PubMed] [Google Scholar]
- 25.Lin JY, Knutsen PM, Muller A, Kleinfeld D & Tsien RY ReaChR: a red-shifted variant of channelrhodopsin enables deep transcranial optogenetic excitation. Nat. Neurosci. 16, 1499–1508 (2013). [DOI] [PMC free article] [PubMed] [Google Scholar]
- 26.Kim CK et al. Simultaneous fast measurement of circuit dynamics at multiple sites across the mammalian brain. Nat. Methods 13, 325–328 (2016). [DOI] [PMC free article] [PubMed] [Google Scholar]
- 27.Rajasethupathy P et al. Projections from neocortex mediate top-down control of memory retrieval. Nature 526, 653–659 (2015). [DOI] [PMC free article] [PubMed] [Google Scholar]
- 28.Carmichael S. t. & Price J. l. Connectional networks within the orbital and medial prefrontal cortex of macaque monkeys. J. Comp. Neurol. 371, 179–207 (1996). [DOI] [PubMed] [Google Scholar]
- 29.Kahnt T, Chang LJ, Park SQ, Heinzle J & Haynes J-D Connectivity-based parcellation of the human orbitofrontal cortex. J. Neurosci. 32, 6240–6250 (2012). [DOI] [PMC free article] [PubMed] [Google Scholar]
- 30.Paxinos G & Franklin KBJ The Mouse Brain in Stereotaxic Coordinates 2nd edn (Elsevier, Amsterdam, Netherlands, 2004). [Google Scholar]
- 31.Felzenszwalb PF, Girshick RB, McAllester D & Ramanan D Object detection with discriminatively trained part-based models. IEEE Trans. Pattern Anal. Mach. Intell. 32, 1627–1645 (2010). [DOI] [PubMed] [Google Scholar]
- 32.Wöhr M et al. Lack of parvalbumin in mice leads to behavioral deficits relevant to all human autism core symptoms and related neural morphofunctional abnormalities. Transl. Psychiatry 5, e525 (2015). [DOI] [PMC free article] [PubMed] [Google Scholar]
- 33.Selimbeyoglu A et al. Modulation of prefrontal cortex excitation/inhibition balance rescues social behavior in CNTNAP2-deficient mice. Sci. Transl. Med. 9, eaah6733 (2017). [DOI] [PMC free article] [PubMed] [Google Scholar]
- 34.Gunaydin LA et al. Natural neural projection dynamics underlying social behavior. Cell 157, 1535–1551 (2014). [DOI] [PMC free article] [PubMed] [Google Scholar]
- 35.Walsh JJ et al. 5-HT release in nucleus accumbens rescues social deficits in mouse autism model. Nature 560, 589–594 (2018). [DOI] [PMC free article] [PubMed] [Google Scholar]
- 36.Mukamel EA, Nimmerjahn A & Schnitzer MJ Automated analysis of cellular signals from large-scale calcium imaging data. Neuron 63, 747–760 (2009). [DOI] [PMC free article] [PubMed] [Google Scholar]
- 37.Clack NG et al. Automated tracking of whiskers in videos of head fixed rodents. PLOS Comput. Biol. 8, e1002591 (2012). [DOI] [PMC free article] [PubMed] [Google Scholar]
- 38.Reimer J et al. Pupil fluctuations track fast switching of cortical states during quiet wakefulness. Neuron 84, 355–362 (2014). [DOI] [PMC free article] [PubMed] [Google Scholar]
- 39.Ye L et al. Wiring and molecular features of prefrontal ensembles representing distinct experiences. Cell 165, 1776–1788 (2016). [DOI] [PMC free article] [PubMed] [Google Scholar]
Associated Data
This section collects any data citations, data availability statements, or supplementary materials included in this article.
Supplementary Materials
Data Availability Statement
The data that support the finding of this study are available upon request from the corresponding author.


