Abstract
Libraries of simulated lipid fragmentation spectra enable the identification of hundreds of unique lipids from complex lipid extracts, even when the corresponding lipid reference standards do not exist. Often, these in silico libraries are generated through expert annotation of spectra to extract and model fragmentation rules common to a given lipid class. Although useful for a given sample source or instrumental platform, the time-consuming nature of this approach renders it impractical for the growing array of dissociation techniques and instrument platforms. Here we introduce Library Forge, a unique algorithm capable of deriving lipid fragment mass-to-charge (m/z) and intensity patterns directly from high-resolution experimental spectra with minimal user input. Library Forge exploits the modular construction of lipids to generate m/z transformed spectra in silico which reveal the underlying fragmentation pathways common to a given lipid class. By learning these fragmentation patterns directly from observed spectra, the algorithm increases lipid spectral matching confidence while reducing spectral library development time from days to minutes. We embed the algorithm within the preexisting lipid analysis architecture of LipiDex to integrate automated and robust library generation within a comprehensive LC-MS/MS lipidomics workflow.
Keywords: Lipidomics, mass spectrometry, spectral libraries, in-silico fragmentation modelling, lipid identifications
Graphical Abstract
INTRODUCTION
Tandem mass spectra (MS/MS) represent the most efficient method for structural confirmation of diverse biomolecules. When combined with accurate intact m/z and chromatographic retention time, these measurements produce a highly specific signature for individual chemical structures [1]. To circumvent the need to generate these spectra from comprehensive reference standard sets, MS/MS spectra are often simulated in silico, using well-characterized fragmentation rules, and subsequently matched against experimental spectra for identification [2, 3]. In silico peptide spectral libraries have, in large part, driven the rapid development of high throughput and comprehensive proteomic analysis in the last two decades [4–6]. However, due to the magnitude of metabolite chemical diversity, in silico libraries for small molecule analysis have not reached comparable performance or acceptance [7].
While lipids represent only a fraction of all possible metabolites [8], in silico modeling of lipid fragmentation has proved tractable due to their modular composition and repeatable fragmentation [9–11]. The vast majority of lipids comprise several conserved structural units which are either constant (headgroup) or vary in predictable ways (e.g., addition of C2H4 units through fatty acyl chain beta-oxidation). This combinatorial construction gives rise to predictable MS/MS fragmentation – a pre-requisite for effective in silico spectral libraries [12]. Generally, in silico library creation for a given lipid class involves several steps: (i) structural definition of the lipid class of interest; (ii) collection of experimental MS/MS spectra from complex lipid extracts or, preferably, pure reference standards; (iii) expert annotation and curation of putative lipid fragmentation pathways; and (iv) generation of theoretical lipid spectra or identification rules using the derived fragmentation patterns [13, 14]. While relatively straightforward for a single lipid class, the development of comprehensive and high-quality lipid spectral libraries using this workflow is a time-consuming task, even for expert analysts.
Although lipid fragmentation is generally conserved within a lipid class, lipid fragment m/z and relative intensity can vary drastically between different LC-MS/MS experimental setups [15]. To account for the disparate fragment ions observed among different fragmentation techniques and move towards platform independence, current LC-MS/MS lipidomics software packages either utilize theoretical mass spectra restricted to commonly observed fragments [9, 10] or contain extensively curated libraries specific to common experimental setups [11, 16]. While powerful, these methods inherently compromise either library flexibility or identification confidence for platform independence. Whereas the instrument-specific approach often lacks the flexibility to be easily expanded to new fragmentation techniques and lipid classes, the consensus library approach ignores spectral differences inherent to each MS platform, artificially skewing the calculation of spectral similarity scores [17] and reducing overall MS/MS identification confidence [18].
Here we describe Library Forge, a new experimental data-driven approach to generate tailored lipid mass spectral libraries for discovery LC-MS/MS analysis. Embedded within the LipiDex data processing environment [19], the Library Forge algorithm leverages the inherent structural modularity of lipids which contain variable-length carbon chains to codify their complex fragmentation behavior with no required manual annotation. For each lipid spectrum, the algorithm generates a set of derivative spectra, termed “annotation spectra”, comprising m/z values transformed using an adaptive set of m/z shifts. Annotation spectra are then systematically compared within a lipid class to extract the minimum set of consensus fragmentation rules which explain the observed spectral peaks. To create in silico libraries, these fragmentation rules are applied to a database of theoretical lipid species. After outlining the method for elucidating lipid fragmentation patterns, we characterize the algorithm’s performance for creating and refining large spectral libraries from various sample sources and dissociation techniques. Finally, we validate the derived fragmentation rules using heavy isotope-labeled standards and the NIST 1950 SRM standard – demonstrating the accuracy and robustness of the algorithm for creation of high-quality in silico lipid spectral libraries.
EXPERIMENTAL SECTION
Materials and Reagents
Unless otherwise specified, all lipid reference standards were purchased from Avanti Polar Lipids (Alabaster, AL) with the exception of the System Suitability Lipid Classes Light Mix and the Internal Standards Kit for Lipidyzer Platform which were purchased from Sciex (Framingham, MA) and the SRM 1950 Metabolites in Frozen Human Plasma standard which was purchased from NIST (Gaithersburg, MD). All lipid reference standards used for library development and validation are listed in Supplementary Table 1-2 in the Supporting Information.
HAP1 and NIST 1950 Sample Preparation and LC-MS/MS Acquisition
HAP1 cell pellets were thawed (4 °C) and glass beads added (0.5 mm diameter, 100 μL). For NIST 1950 extraction, the human plasma standard was thawed, vortexed, and an aliquot taken for extraction (10 μL). CHCl3/MeOH (1:1, v/v, 4 °C, 900 μL) was added to solubilize hydrophobic species and the sample vortexed (2 × 30 s). HCl (1 M, 200 μL, 4 °C) was subsequently added and the solution vortexed. To ensure phase separation, samples were centrifuged for 2 minutes (5,000 g, 4 °C). A portion of the organic phase (500 μL) was transferred to a new tube and dried under Argon. The lipid-containing residue was then reconstituted in ACN/IPA/H2O (65:30:5, v/v/v) (100 μL) and stored at −80 °C for eventual LC-MS/MS analysis.
Samples were chromatographically separated with an ACQUITY CSH C18 column (50 °C , 2.1 × 100 mm × 1.7 μm particle size; Waters Corporation) using a Vanquish Binary Pump (Thermo Scientific). Mobile phase A was composed of 10 mM ammonium acetate in ACN/H2O (70:30, v/v) containing 250 μL/L acetic acid. Mobile phase B was composed of 10 mM ammonium acetate in IPA/ACN (90:10, v/v) with the same additives. Ten microliters of either the complex lipid extract or reference standard mix were injected by a Vanquish autosampler (Thermo Scientific) onto the column. The LC system was coupled in-line to either a Q Exactive HF (Thermo Scientific) or an Orbitrap Fusion Lumos mass spectrometer (Thermo Scientific) by a HESI heated ESI source (Thermo Scientific). During operation, the MS acquired data in both positive and negative polarity mode during sequential injections. MS1 and MS2 spectra were collected using data-dependent acquisition. All chromatography and MS acquisition parameters are provided in Supplementary Table 3-4 in the Supporting Information.
LC-MS/MS Data Processing
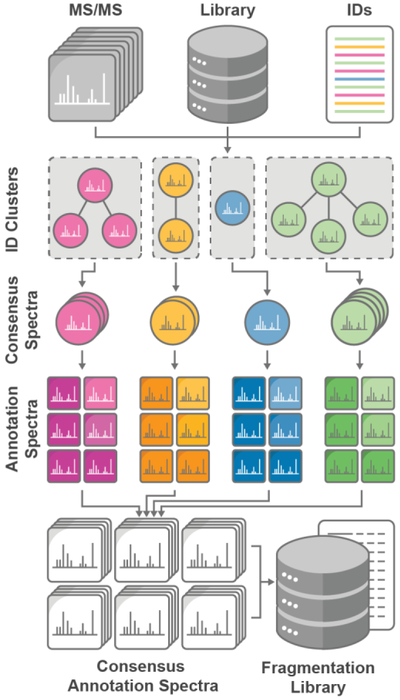
MS/MS spectra were converted to the MGF format using Proteowizard 3.0 (ProteoWizard Software Foundation v3.0) [20]. Putative lipid identifications were generated from analysis of either a mixture of known lipid reference standards or whole lipid extracts searched using pre-existing spectral libraries. For complex lipid extract analysis, identifications were generated using LipiDex (v1.0.1) [19] to search against the LipiDex HCD Acetate spectral library or the LipidBlast library [21] (MS-Dial v.2.84). The LipiDex HCD Acetate library comprises fragmentation rules generated through hand-annotation of spectra generated through HCD fragmentation. Spectra were matched against in silico lipid spectra and scored using a modified dot product score (ranging between 0 and 1000) to quantify spectral similarity (see Supplemental Methods in Supporting Information for the complete equation). All further LC-MS/MS data processing was performed using algorithms designed to extract map lipid class fragmentation rules from experimental spectra. The full details of each data processing step are provided in the Supplemental Methods in Supporting Information and outlined in Figure 1. Briefly, putatively identified lipid MS/MS spectra whose signal-to-noise ratio (S/N) [22] rose above a user-supplied threshold were extracted, scaled relative to the base peak intensity, and filtered to remove low-intensity fragments. To collapse multiple MS/MS spectra assigned the same identification (i.e., replicates) into a single consensus spectrum, replicate spectra were first clustered following the method of Lam et al [23]. This clustering algorithm removed dissimilar replicate spectra which were unlikely to be representative of the putative lipid identification. The largest spectral cluster for each identification was then retained and collapsed into a single high-quality consensus spectrum generated from the median m/z and relative intensity of all shared fragments. Next, an adaptive set of m/z offsets was applied to each consensus spectrum to generate an annotation spectrum for each possible fragment type consisting of transformed m/z values. Once transformed, spectral peaks which originated from the same fragmentation pathway became isobaric. All annotation spectra from the same lipid class and adduct combinations were then compared and filtered to determine conserved fragmentation rules. From these lipid class-specific rule sets, in silico spectra for all possible lipid species were generated in LipiDex. For a complete list of all Library Forge parameters used to create each spectral library outlined below, please reference Supplementary Table 5 in the Supporting Information.
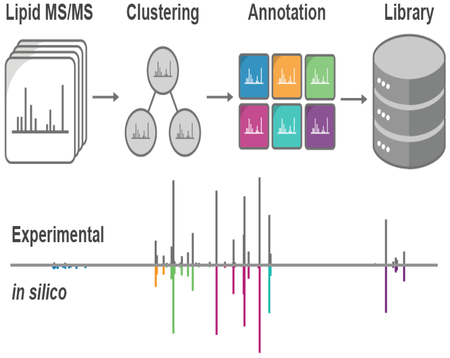
Figure 1.
Spectral Library Generation Workflow. Lipid fragmentation mapping requires raw MS/MS spectra, a library of potential lipid class metadata, and putative identifications (complex method) or standard retention times (reference standard method). Duplicate identifications are clustered and curated to generate consensus MS/MS spectra. Annotation spectra are subsequently generated from transformed MS/MS peaks and combined to reveal the fragment definitions and intensities common to a lipid class. Derived fragmentation rules are then used to generate a new tailored in-silico spectral library.
RESULTS AND DISCUSSION
Defining Lipid Fragmentation
The majority of lipid chemical structures can be defined as a combination of a given number of variable-length hydrocarbon chains bound to a fixed chemical moiety [24]. Accordingly, the number of potential fragment types for a given lipid class is constrained to a constant m/z fragment or neutral loss and a variable m/z fragment or neutral loss of one or more side chains. Here, neutral loss refers to the charged fragment ion remaining when a neutral mass fragment is lost. For a detailed example of the possible fragment types for a given lipid class, see Supplemental Figure 1. Note that this categorization does not include lipids which do not contain variable-length chains (e.g. prostaglandins or polyketides) or lipid fragments which depend on the location of side-chain double bonds. Most commonly generated through ultraviolet photodissociation (UVPD) [25, 26] or ozone-induced dissociation (OzID) [27], these fragments represent a minor portion of the total MS/MS signal and, as such, do not affect standard spectral similarity calculations. Given sufficient spectra which contain these fragments in high abundance, Library Forge could, with modification, annotate these fragment types.
At its foundation, Library Forge generates rule sets which simulate lipid fragmentation by assigning each lipid spectral peak a fragment type and determining the m/z difference (rule modifier) between the peak and the fragment type definition. For example, fragmentation spectra of PC 16:0_18:1 [M+Ac-H]− often exhibit prominent features of m/z 255, 281, and 168. Expert annotation of these spectral peaks classified them as deprotonated fragments of each acyl chain (m/z 255 and 281) and a phosphocholine ion with loss of a methyl group (m/z 168) [28]. As defined above, these would be annotated as an alkyl fragment with a m/z = 0 rule modifier and fragment with a m/z = 168 rule modifier. Along with the predicted relative intensity, this rule set uniquely describes each lipid fragment and forms the foundation of in silico library generation in Library Forge. Although the previously published Library Generator functionality of LipiDex also uses these rule sets [19], the process of defining fragmentation patterns is a manual, time-consuming process. Library Forge automatically generates these rule sets by exploiting the mathematical relationship between the lipid structural components.
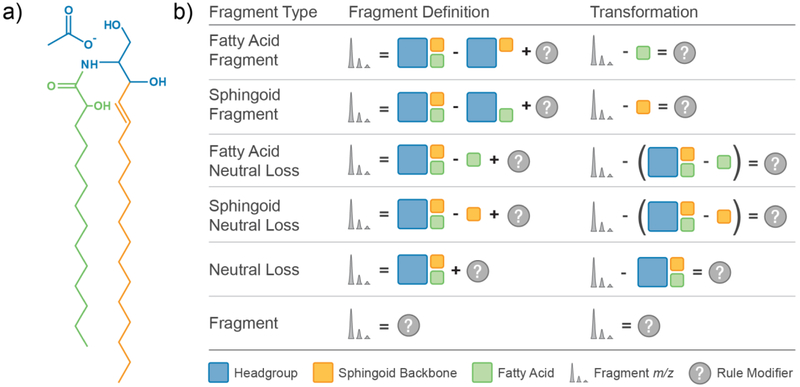
In Figure 2a we demonstrate the structural component classification of an α-hydroxy fatty acid ceramide (Cer[AS] [M+Ac-H]−) composed of a fixed headgroup (acetate ion and modified glycerol backbone; blue), a variable length α-hydroxy fatty acid (green), and a sphingoid backbone (orange). Based on this classification and the fragment types outlined above, six possible fragment types exist for this lipid class: fatty acid fragment, sphingoid fragment, fatty acid neutral loss, sphingoid neutral loss, neutral loss, and fragment (see Supplemental Methods in Supplemental Information for fragment type definitions). We can define each possible fragment type for this lipid using a chemical equation comprising the original fragment m/z, the lipid structural component m/z values, and a rule modifier which mass-balances the equation (Figure 2b). As described above, it is clear that a simple lipid-dependent m/z transformation is needed to solve for each rule modifier. Once this transformation is applied to spectral peaks originating from the same fragmentation pathway, these peaks will have identical m/z values, regardless of their untransformed m/z value. Additionally, the transformed m/z value is equivalent to the rule modifier described previously. By applying the correct m/z transformation to correct lipid identifications, unique fragmentation pathways are readily mapped and converted into fragmentation rules for subsequent generation of in-silico spectral libraries.
Figure 2.
Defining Lipid Fragmentation. (a) Lipid structural component classification of Cer[AS] d18:1_14:0 [M+Ac-H]−used for constructing and defining lipid fragment types. For fragmentation mapping, the lipid adduct and headgroup are considered one unit. (b) Allowed lipid fragment type definitions for Cer[AS] d18:1_14:0 [M+Ac-H]− defined in terms of headgroup m/z (blue square), sphingoid backbone m/z (orange square), fatty acid m/z (green square), fragment m/z (spectral peaks), and rule specific modifier m/z (question mark). Each transformation used to generate annotation spectra is simply the corresponding fragment definition solved for the rule modifier.
These transformations, as applied here, can be seen as a re-ordering of the shotgun lipidomic paradigm. Shotgun lipidomics uses prior knowledge of lipid fragmentation to inform the design of layered neutral loss and precursor scanning combinations which reconstruct a sample’s lipid constituents [29]. Conversely, Library Forge creates multi-dimensional scans in silico for each identified lipid to determine lipid fragmentation patterns de novo. Although different in approach, both of these lipid identification methods exploit the same mathematical relationships between fragments stemming from the same lipid class [28]. We note that another re-ordering of this paradigm is central to LipidXplorer [30] which creates queryable lipidomics experiment databases for infusion-based lipidomics [31].
Mapping Lipid Fragmentation
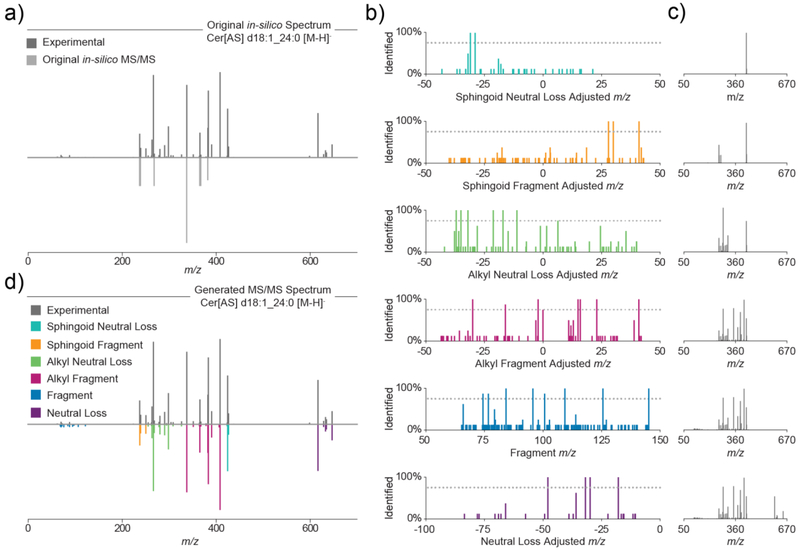
To illustrate the outlined method for deriving lipid fragmentation rules from experimental spectra, we demonstrate the fragmentation mapping of deprotonated Cer[AS] species in Figure 3. Library Forge leverages putative lipid identifications to generate the correct m/z transformations needed to create the annotation spectra. These identifications can be generated from analysis of either a mixture of known lipid reference standards or whole lipid extracts whose MS/MS spectra have been searched using pre-existing libraries. For this example, the experimental MS/MS spectrum (Cer[AS] d18:1_24:0 [M-H]−) and the original in silico spectrum contained in the LipiDex spectral library (LipiDex HCD Acetate, LipiDex v1.0.1) [19] show only marginal fragment m/z and intensity correlation (dot product: 318) (Figure 3a). From the LC-MS/MS analysis of HAP1 cell lipid extracts, we putatively identify eight unique Cer[AS] species and subsequently create a consensus spectrum for each species.
Figure 3.
Mapping Fragmentation of α-Hydroxy Fatty Acid Ceramides. (a) Original experimental (dark grey) and in-silico (light grey) MS/MS spectra for Cer[AS] d18:1_24:0 [M-H]−. (b) All annotation spectral peaks for sphingoid neutral loss (turquoise), sphingoid fragment (orange), alkyl neutral loss (green), alkyl fragment (magenta), fragment (blue), and neutral loss (purple) generated from 8 unique Cer[AS] [M+Ac-H]− species. (c) Generated Cer[AS] d18:1_24:0 [M-H]− spectra after addition of annotation spectral peaks found in at least 75% of annotation spectra for each rule type. (d) Original experimental (dark grey) and generated in-silico (colored) spectra for Cer[AS] d18:1_24:0 [M-H]−.
To each spectrum, we apply the six m/z transformations described in Figure 2b. Only those adjusted m/z values present in a given percentage of the annotation spectra for a given lipid class (dotted line) are retained (Figure 3b). In this way, peaks present in the annotation spectra corresponding to noise, co-fragmented lipids, or m/z transformation artifacts are removed. To simulate the relative intensity of each fragment, each fragmentation rule is then assigned the average relative intensity of the spectral peaks which stem from that fragmentation pathway (Figure 3c). For the example of Cer[AS] d18:1_24:0 [M-H]−, Library Forge generated an in silico spectrum with high spectral fidelity towards both the experimental spectrum (dot product: 991, Figure 3d) and a reference standard spectrum (dot product: 971, Supplementary Figure 2 in Supplemental Information).
Generating Lipid Spectral Libraries
Based on the outlined workflow, spectral library quality largely depends on three experimental factors: the lipid species analyzed, the instrumental setup used, and the putative identifications generated. To demonstrate the robustness and utility of the Library Forge algorithm, we generated in silico spectral libraries from four different starting condition sets. These libraries were created using spectra collected from different sample sources (HAP1 cell extract and reference standard mix), fragmented using distinct collisional-dissociation methods (beam-type HCD and ion trap CAD), and putatively identified using dissimilar spectral libraries (LipiDex v1.0.1 and MS-Dial v2.84). For HAP1 cell sample analysis, all putative identifications with a dot product score greater than 200 (7366 total spectra for LipiDex IDs) or 150 (6615 total spectra for LipidBlast IDs) were analyzed. Although too permissive for standard spectral searching, this low threshold ensured fragmentation mapping of lipid classes for which the original library contained poor quality in silico spectra. For reference standard analysis, we collected MS/MS spectra from a mixture of 83 phospho-, glycero-, sphingo-, and sterol lipids analyzed on the Q Exactive HF platform using HCD and on the Orbitrap Fusion Lumos platform using ion trap CAD.
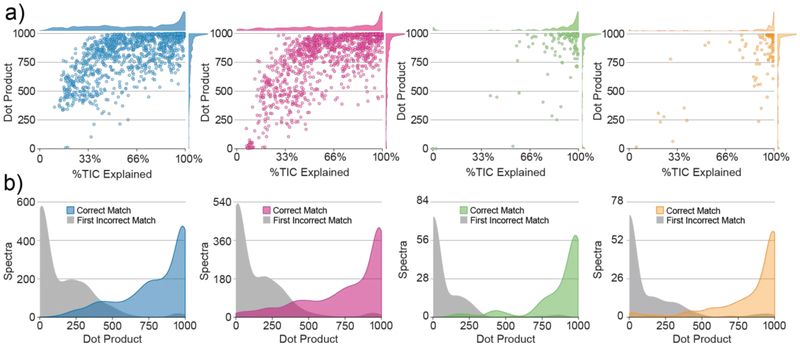
For a global view of the accuracy of the spectra generated from these experimental datasets, we plot the percent total ion current (TIC) of the original MS/MS spectrum explained by the generated rules and the dot product score between the original spectrum and the generated in silico spectrum in Figure 4a (see Supplementary Figures 3-38 for example spectral results). For the datasets outlined previously (HAP1-HCD-LipiDex, HAP1-HCD-LipidBlast, Ref. Standard-HCD, and Ref. Standard-ion trap CAD), Library Forge produced spectra with a median dot product score of 900, 897, 969, and 974, respectively. Additionally, the algorithm on average successfully mapped 72%, 72%, 95%, and 88%, respectively of the TIC. For each dataset, the fragmentation of a small percentage of spectra (8%, 13%, 12% and 15%, respectively) could not be successfully mapped (dot product < 500). In the majority of these instances, fragmentation rules could not be extracted due to the experimental dataset containing insufficient spectra of suitable signal-to-noise for a given lipid class. We note that the scoring and %TIC mapped difference between the reference standard and complex sample datasets can be attributed to increased co-fragmentation of isobaric lipid species and false putative MS/MS identifications in the complex sample datasets. Review and subsequent removal of these identifications prior to fragmentation mapping would greatly decrease differences between the datasets. Despite these small differences in spectral accuracy, the algorithm capably maps lipid fragmentation from LC-MS/MS datasets generated with different starting experimental conditions.
Figure 4.
Generating Lipid Spectra (a) Dot product returned and %TIC explained for original MS/MS spectra after in-silico library generation from complex HAP1 cell extract using LipiDex spectral library (blue), complex HAP1 cell extract using LipidBlast spectral library (magenta), reference standard mix using HCD (green), and reference standard mix using ion trap CAD (orange). For clarity, the dot product and %TIC explained are additional displayed as density plots (bin width = 10) on each corresponding axis. (b) Density plots (bin width = 50) of the dot product returned for original MS/MS spectra from the correct lipid identification (colored) and the first incorrect identification (match). Note: for complex spectra which contained co-fragmented lipid species, these identifications were not counted as incorrect.
Confident spectral matching maximizes the score difference between the correct identification and the top-scoring false identification (Δdot product) [32]. This difference greatly increases identification confidence in the absence of a false discovery rate (FDR) estimate as commonly used in discovery proteomics [33]. To equitably test the Δdot product scores for spectra from each in silico library, we merged each library with the full LipiDex HCD Acetate spectral library (LipiDex v1.0.1) and re-searched the spectra. By combining each library with a common “background” library, we ensured the measured selectivity was not a factor of library size but of spectral quality (Supplemental Information). Co-fragmented lipids were not considered incorrect matches for this comparison. We were encouraged to see that each dataset demonstrated excellent selectivity (Figure 4b) and returned high-confidence MS/MS identifications (dot product >500, Δdot product >200) for the majority of the spectra (82%, 76%, 90%, 86%) (Supplemental Figure 39 in Supplemental Information).
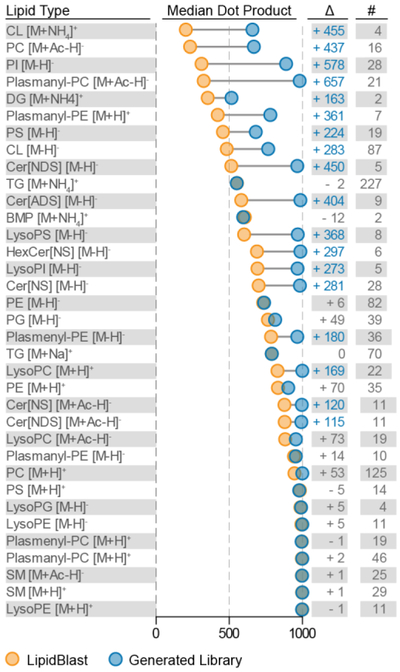
To explore the algorithm’s ability to refine preexisting spectral libraries based on data collected on different instrument platforms, we plot the median spectral similarity score for all mapped lipid classes from the HAP1 dataset for the original LipidBlast and the Library Forge-generated spectral libraries. As seen in Figure 5, Library Forge returned significantly improved (>100) dot product scores for 18 of the 35 lipid classes – improving the average returned dot product from 721 to 890. For the most dissimilar spectra (DP < 700), the algorithm improved the median dot product score by an average of 329. This analysis did not show any lipid classes with significantly reduced scores – suggesting that, at minimum, the algorithm recapitulates the original in silico spectra. For comparison, we performed the same analysis for the HAP1 dataset which used the LipiDex HCD Acetate library (LipiDex v1.0.1) (Supplementary Figure 40 in Supplemental Information). As this library was originally developed using the same LC-MS/MS platform, the algorithm returned fewer significantly improved lipid class spectra (n=8) and reconstructed the fragmentation pathways already contained within the original library (LipiDex HCD Acetate library v1.0.1).
Figure 5.
Refining in-silico spectral libraries. Median dot product returned for each lipid class/adduct combination mapped when searching the experimental MS/MS spectra against the original LipidBlast spectral library (orange) and generated spectral library (blue). The difference between each group with significantly improved median dot product scores (>+100) highlighted in blue and the number of MS/MS spectra used to generate fragmentation rules is displayed on the right.
Fragmentation Rule Validation
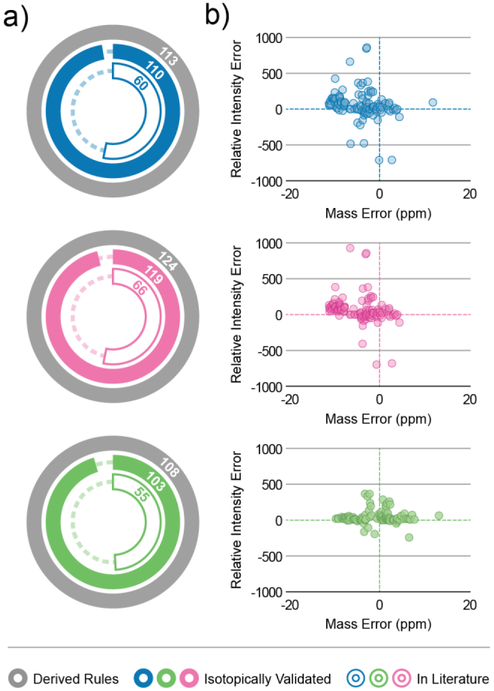
Having confirmed the algorithm’s ability to generate in silico spectra with high similarity to experimental MS/MS spectra, we sought to validate the fragmentation rules and ensure we were not over-fitting data and generating rules which only modelled spectra in the experimental datasets. First, we analyzed a mixture of 54 isotopically-labeled reference standards, not present in any of our original experiments, using HCD fragmentation. As each standard contained an isotopically-labelled fatty acyl chain, these standards represent unique lipids for each class and serve as a validation set. We declared each putative fragmentation rule as bona fide if it was present in the isotopically-labelled lipid spectra. Encouragingly, the reference standards validated at least 95% of the fragmentation rules for all lipid classes contained in the fragmentation rule sets for each of the previously generated HCD libraries (Figure 6a). The majority of all verified fragmentation rules also fell within a +/− 10 ppm window of the actual fragment m/z and a relative intensity difference of less than 25% (Figure 6b). Next, we sought to determine whether Library Forge could map experimental fragment ions not commonly found in pre-existing lipid spectral libraries. To test this, we searched for the presence of each fragmentation rule in a set of previously published in silico libraries [10–12] containing 748,902 spectra modeled on experimental data collected from multiple instrument platforms. Of the isotopically-validated rules, approximately half were contained in the published library set – further demonstrating the algorithm’s capability to map unique fragment ions.
Figure 6.
Validating Fragmentation Rules. (a) Radial bar charts depicting the number of fragmentation rules validated via isotopically-labelled standards (solid color) and present in external spectral libraries (outlined) for the libraries generated in silico from complex HAP1 cell extract using the LipiDex spectral library (blue), complex HAP1 cell extract using the LipidBlast spectral library (magenta), and reference standard mix using HCD (green). (b) Scatter plot depicting the relative intensity error out of 1000 and mass error (ppm) for each derived fragmentation rule.
To date, the consensus lipid identifications created from the interlaboratory study of the NIST SRM 1950 sample represents the best method for validating lipid identification pipelines [34]. Accordingly, we generated lipid identifications in LipiDex using the previously detailed HCD spectral libraries from triplicate LC-MS/MS analysis of the NIST SRM 1950 material (Supplemental Methods in Supplemental Information). No filtering of the lipid feature identifications was performed. Any putative identification was considered validated if it was previously putatively identified by at least three laboratories in the interlaboratory study. As seen in Supplementary Figure 41 in Supplemental Information, for the generated libraries, we validated 91%, 93%, and 92% of all lipid identifications. For all identifications not identified by at least three laboratories, we hand annotated the spectra. From these, we validated all but two of the identifications (Supplementary Figure 42 in Supplemental Information). Taken together, this represents a correct lipid identification rate of 98.7%, 98.7%, and 98.6%.
Finally, we validated the robustness of the Library Forge approach by extracting lipid fragmentation rules from MS/MS spectra whose putative lipid identifications were generated using Lipid Data Analyzer v2.6.3_3 (LDA 2) (Supplemental Methods in Supplemental Information). As LDA 2 identifies lipids using identification rule sets rather than spectral similarity scoring, these identifications serve to evaluate the broad applicability of the approach outlined in this manuscript. In Supplementary Figure 43 in Supplemental Information we display the results of the same validation analyses outlined previously on this specific dataset. Notably, we validated 90% of identifications made with this LDA 2 library using the NIST 1950 SRM consensus identifications. Altogether, these datasets and analyses comprise a comprehensive validation of the efficacy and robustness of the Library Forge method. The Library Forge algorithm automatically creates bona fide lipid fragmentation spectra – greatly reducing the time necessary to generate high-confidence lipid identifications from diverse experimental platforms.
CONCLUSIONS
Here we describe a robust spectral parsing algorithm which leverages the inherent structural modularity of lipids to learn their fragmentation behavior directly from experimental MS/MS spectra. This approach ensures in silico generated spectra mirror the fragmentation behavior of the user’s experimental platform, thereby increasing spectral similarity, identification selectivity, and identification confidence. Because the algorithm derives lipid fragmentation patterns from transformed spectra where individual fragmentation pathways are isobaric instead of directly from untransformed MS/MS spectra, it circumvents the need for numerous training spectra as required for machine learning-based approaches [35]. We deploy numerous spectral quality filters to remove spectral noise, spurious identifications, and analysis artifacts which allows the algorithm to effectively analyze reference standard mixtures or complex lipid extracts.
We also note that Library Forge’s ability to accurately model lipid fragmentation may prove valuable for automatically generating realistic decoy databases for a lipid-specific FDR calculation. Recently published methods for small molecule FDR estimation have described the increased performance of decoy libraries created using fragmentation-informed rules to generate more realistic decoy spectra [36, 37]. With minor modifications, Library Forge could generate accurate decoy spectra, an important step in statistically robust lipid identification. This algorithm represents a critical step towards platform-independent lipid identification which performs on par with manually curated instrument-specific libraries. By automating in silico library development for a wide variety of lipid classes and fragmentation techniques, Library Forge offers an expedited and simplified route to simple and confident spectral identification for LC-MS/MS lipidomic experiments.
Supplementary Material
ACKNOWLEDGMENTS
We gratefully acknowledge support from the National Institutes of Health Grant P41 GM108538 (awarded to J.J.C) and the Morgridge Institute for Research Metabolism Theme. We also acknowledge support from the Great Lakes Bioenergy Research Center, U.S. Department of Energy, Office of Science, Office of Biological and Environmental Research under Award Numbers DE-SC0018409 and DE-FC02-07ER64494. Additionally, we thank the Pagliarini Lab for generating the HAP1 cell lipid extracts.
Footnotes
SUPPORTING INFORMATION
Library generation standards, library validation standards, LC-MS/MS analysis parameters for Q Exactive HF Analysis, LC-MS/MS analysis parameters for Orbitrap Fusion Lumos analysis, Library Forge processing parameters, NIST 1950 SRM processing parameters, lipid fragment type definitions, Cer[AS] reference standard spectrum, representative in silico spectra for HCD Hap1 Analysis, identification confidence using generated libraries, dot product enhancement after fragmentation mapping, NIST 1950 SRM validation, NIST 1950 SRM identification manual validation, and LDA 2 identification dataset. Raw data are available on Chorus (Project ID 1501). The full software suite and accompanying multimedia tutorials describing the use of Library Forge are available at http://www.ncqbcs.com/resources/software/.
Notes
The authors declare no competing financial interests.
REFERENCES
- 1.Domingo-Almenara X, Montenegro-Burke JR, Benton HP, Siuzdak G: Annotation: A Computational Solution for Streamlining Metabolomics Analysis. Anal. Chem 90, 480–489 (2018). doi: 10.1021/acs.analchem.7b03929 [DOI] [PMC free article] [PubMed] [Google Scholar]
- 2.Wolf S, Schmidt S, Müller-Hannemann M, Neumann S: In silico fragmentation for computer assisted identification of metabolite mass spectra. BMC Bioinformatics. 11, (2010). doi: 10.1186/1471-2105-11-148 [DOI] [PMC free article] [PubMed] [Google Scholar]
- 3.Blaženović I, Kind T, Ji J, Fiehn O: Software Tools and Approaches for Compound Identification of LC-MS/MS Data in Metabolomics. Metabolites. 8, 31 (2018). doi: 10.3390/metabo8020031 [DOI] [PMC free article] [PubMed] [Google Scholar]
- 4.Eng JK, Mccormack AL, Yates JR: An Approach to Correlate Tandem Mass Spectral Data of Peptides with Amino Acid Sequences in a Protein Database. Am. Soc. Mass Spectrom 5, 976–989 (1994). doi: 10.1016/1044-0305(94)80016-2 [DOI] [PubMed] [Google Scholar]
- 5.Hebert AS, Richards AL, Bailey DJ, Ulbrich A, Coughlin EE, Westphall MS, Coon JJ: The One Hour Yeast Proteome. Mol. Cell. Proteomics. 13, 339–347 (2014). doi: 10.1074/mcp.M113.034769 [DOI] [PMC free article] [PubMed] [Google Scholar]
- 6.Bekker-Jensen DB, Kelstrup CD, Batth TS, Larsen SC, Haldrup C, Bramsen JB, Sørensen KD, Høyer S, Ørntoft TF, Andersen CL, Nielsen ML, Olsen JV: An Optimized Shotgun Strategy for the Rapid Generation of Comprehensive Human Proteomes. Cell Syst. 4, 587–599.e4 (2017). doi: 10.1016/j.cels.2017.05.009 [DOI] [PMC free article] [PubMed] [Google Scholar]
- 7.Kind T, Tsugawa H, Cajka T, Ma Y, Lai Z, Mehta SS, Wohlgemuth G, Barupal DK, Showalter MR, Arita M, Fiehn O: Identification of small molecules using accurate mass MS/MS search. Mass Spectrom. Rev 1–20 (2017). doi: 10.1002/mas.21535 [DOI] [PMC free article] [PubMed] [Google Scholar]
- 8.Wishart DS, Knox C, Guo AC, Eisner R, Young N, Gautam B, Hau DD, Psychogios N, Dong E, Bouatra S, Mandal R, Sinelnikov I, Xia J, Jia L, Cruz JA, Lim E, Sobsey CA, Shrivastava S, Huang P, Liu P, Fang L, Peng J, Fradette R, Cheng D, Tzur D, Clements M, Lewis A, de souza A, Zuniga A, Dawe M, Xiong Y, Clive D, Greiner R, Nazyrova A, Shaykhutdinov R, Li L, Vogel HJ, Forsythei I: HMDB: A knowledgebase for the human metabolome. Nucleic Acids Res. 37, 603–610 (2009). doi: 10.1093/nar/gkn810 [DOI] [PMC free article] [PubMed] [Google Scholar]
- 9.Kind T, Liu K-H, Lee DY, DeFelice B, Meissen JK, Fiehn O: LipidBlast in silico tandem mass spectrometry database for lipid identification. Nat. Methods 10, 755–758 (2013). doi: 10.1038/nmeth.2551 [DOI] [PMC free article] [PubMed] [Google Scholar]
- 10.Koelmel JP, Kroeger NM, Ulmer CZ, Bowden JA, Patterson RE, Cochran JA, Beecher CWW, Garrett TJ, Yost RA: LipidMatch: an automated workflow for rule-based lipid identification using untargeted high-resolution tandem mass spectrometry data. BMC Bioinformatics. 18, 331 (2017). doi: 10.1186/s12859-017-1744-3 [DOI] [PMC free article] [PubMed] [Google Scholar]
- 11.Hartler J, Triebl A, Ziegl A, Trötzmüller M, Rechberger GN, Zeleznik OA, Zierler KA, Torta F, Cazenave-Gassiot A, Wenk MR, Fauland A, Wheelock CE, Armando AM, Quehenberger O, Zhang Q, Wakelam MJO, Haemmerle G, Spener F, Köfeler HC, Thallinger GG: Deciphering lipid structures based on platform-independent decision rules. Nat. Methods 14, 1171–1174 (2017). doi: 10.1038/nmeth.4470 [DOI] [PMC free article] [PubMed] [Google Scholar]
- 12.Kind T, Okazaki Y, Saito K, Fiehn O: LipidBlast templates as flexible tools for creating new in-silico tandem mass spectral libraries. Anal. Chem. 86, 11024–11027 (2014). doi: 10.1021/ac502511a [DOI] [PMC free article] [PubMed] [Google Scholar]
- 13.Ma Y, Kind T, Vaniya A, Gennity I, Fahrmann JF, Fiehn O: An in silico MS/MS library for automatic annotation of novel FAHFA lipids. J. Cheminform 7, 53 (2015). doi: 10.1186/s13321-015-0104-4 [DOI] [PMC free article] [PubMed] [Google Scholar]
- 14.Tsugawa H, Ikeda K, Tanaka W, Senoo Y, Arita M, Arita M: Comprehensive identification of sphingolipid species by in silico retention time and tandem mass spectral library. J. Cheminform. 9, 1–12 (2017). doi: 10.1186/s13321-017-0205-3 [DOI] [PMC free article] [PubMed] [Google Scholar]
- 15.Hsu FF, Turk J: Electrospray ionization with low-energy collisionally activated dissociation tandem mass spectrometry of glycerophospholipids: Mechanisms of fragmentation and structural characterization. J. Chromatogr. B Anal. Technol. Biomed. Life Sci 877, 2673–2695 (2009). doi: 10.1016/j.jchromb.2009.02.033 [DOI] [PMC free article] [PubMed] [Google Scholar]
- 16.Pauling JK, Hermansson M, Hartler J, Christiansen K, Gallego SF, Peng B, Ahrends R, Ejsing CS: Proposal for a common nomenclature for fragment ions in mass spectra of lipids. PLoS One. 12, (2017). doi: 10.1371/journal.pone.0188394 [DOI] [PMC free article] [PubMed] [Google Scholar]
- 17.Stein SE, Scott DR: Optimization and Testing of Mass-Spectral Library Search Algorithms for Compound Identification. J. Am. Soc. Mass Spectrom 5, 859–866 (1994). doi: 10.1016/1044-0305(94)87009-8 [DOI] [PubMed] [Google Scholar]
- 18.Kochen MA, Chambers MC, Holman JD, Nesvizhskii AI, Weintraub ST, Belisle JT, Islam MN, Griss J, Tabb DL: Greazy: Open-Source Software for Automated Phospholipid Tandem Mass Spectrometry Identification. Anal. Chem 88, 5733–5741 (2016). doi: 10.1021/acs.analchem.6b00021 [DOI] [PMC free article] [PubMed] [Google Scholar]
- 19.Hutchins PD, Russell JD, Coon JJ: LipiDex: An Integrated Software Package for High-Confidence Lipid Identification. Cell Syst. 6, 621–625.e5 (2018). doi: 10.1016/j.cels.2018.03.011 [DOI] [PMC free article] [PubMed] [Google Scholar]
- 20.Chambers MC, MacLean B, Burke R, Amodei D, Ruderman DL, Neumann S, Gatto L, Fischer B, Pratt B, Egertson J, Hoff K, Kessner D, Tasman N, Shulman N, Frewen B, Baker TA, Brusniak MY, Paulse C, Creasy D, Flashner L, Kani K, Moulding C, Seymour SL, Nuwaysir LM, Lefebvre B, Kuhlmann F, Roark J, Rainer P, Detlev S, Hemenway T, Huhmer A, Langridge J, Connolly B, Chadick T, Holly K, Eckels J, Deutsch EW, Moritz RL, Katz JE, Agus DB, MacCoss M, Tabb DL, Mallick P: A cross-platform toolkit for mass spectrometry and proteomics. Nat. Biotechnol 30, 918–920 (2012). doi: 10.1038/nbt.2377 [DOI] [PMC free article] [PubMed] [Google Scholar]
- 21.Tsugawa H, Cajka T, Kind T, Ma Y, Higgins B, Ikeda K, Kanazawa M, VanderGheynst J, Fiehn O, Arita M: MS-DIAL: data-independent MS/MS deconvolution for comprehensive metabolome analysis. Nat. Methods 12, 523–526 (2015). doi: 10.1038/nmeth.3393 [DOI] [PMC free article] [PubMed] [Google Scholar]
- 22.Lam H, Deutsch EW, Eddes JS, Eng JK, King N, Stein SE, Aebersold R: Development and validation of a spectral library searching method for peptide identification from MS/MS. Proteomics. 7, 655–667 (2007). doi: 10.1002/pmic.200600625 [DOI] [PubMed] [Google Scholar]
- 23.Lam H, Deutsch EW, Eddes JS, Eng JK, Stein SE, Aebersold R: Building consensus spectral libraries for peptide identification in proteomics. Nat. Methods 5, 873–875 (2008). doi: 10.1038/nmeth.1254 [DOI] [PMC free article] [PubMed] [Google Scholar]
- 24.Han X: Fragmentation Patterns of Glycerolipids In: Lipidomics: Comprehensive Mass Spectrometry of Lipids. pp. 217–228. John Wiley & Sons, Ltd; (2016) [Google Scholar]
- 25.Ryan E, Nguyen CQN, Shiea C, Reid GE: Detailed Structural Characterization of Sphingolipids via 193 nm Ultraviolet Photodissociation and Ultra High Resolution Tandem Mass Spectrometry. J. Am. Soc. Mass Spectrom 28, 1406–1419 (2017). doi: 10.1007/s13361-017-1668-1 [DOI] [PubMed] [Google Scholar]
- 26.Klein DR, Brodbelt JS: Structural Characterization of Phosphatidylcholines Using 193 nm Ultraviolet Photodissociation Mass Spectrometry. Anal. Chem 89, 1516–1522 (2017). doi: 10.1021/acs.analchem.6b03353 [DOI] [PMC free article] [PubMed] [Google Scholar]
- 27.Thomas MC, Mitchell TW, Harman DG, Deeley JM, Nealon JR, Blanksby SJ: Ozone-induced dissociation: Elucidation of double bond position within mass-selected lipid ions. Anal. Chem 80, 303–311 (2008). doi: 10.1021/ac7017684 [DOI] [PubMed] [Google Scholar]
- 28.Lipidomics: Comprehensive Mass Spectrometry of Lipids. (2016) [Google Scholar]
- 29.Han X, Yang K, Gross RW: Multi-dimensional mass spectrometry-based shotgun lipidomics and novel strategies for lipidomic analyses. Mass Spectrom. Rev 31, 134–178 (2012). doi: 10.1002/mas.20342 [DOI] [PMC free article] [PubMed] [Google Scholar]
- 30.Herzog R, Schuhmann K, Schwudke D, Sampaio JL, Bornstein SR, Schroeder M, Shevchenko A: Lipidxplorer: A software for consensual cross-platform lipidomics. PLoS One. 7, 15–20 (2012). doi: 10.1371/journal.pone.0029851 [DOI] [PMC free article] [PubMed] [Google Scholar]
- 31.Herzog R, Schwudke D, Schuhmann K, Sampaio JL, Bornstein SR, Schroeder M, Shevchenko A: A novel informatics concept for high-throughput shotgun lipidomics based on the molecular fragmentation query language. Genome Biol. 12, R8 (2011). doi: 10.1186/gb-2011-12-1-r8 [DOI] [PMC free article] [PubMed] [Google Scholar]
- 32.Shao W, Zhu K, Lam H: Refining similarity scoring to enable decoy-free validation in spectral library searching. Proteomics. 13, 3273–3283 (2013). doi: 10.1002/pmic.201300232 [DOI] [PubMed] [Google Scholar]
- 33.Keller A, Nesvizhskii AI, Kolker E, Aebersold R: Empirical statistical model to estimate the accuracy of peptide identifications made by MS/MS and database search. Anal. Chem 74, 5383–5392 (2002). doi: 10.1021/ac025747h [DOI] [PubMed] [Google Scholar]
- 34.Bowden JA, Heckert A, Ulmer CZ, Jones CM, Koelmel JP, Abdullah L, Ahonen L, Alnouti Y, Armando AM, Asara JM, Bamba T, Barr JR, Bergquist J, Borchers CH, Brandsma J, Breitkopf SB, Cajka T, Cazenave-Gassiot A, Checa A, Cinel MA, Colas RA, Cremers S, Dennis EA, Evans JE, Fauland A, Fiehn O, Gardner MS, Garrett TJ, Gotlinger KH, Han J, Huang Y, Neo AH, Hyötyläinen T, Izumi Y, Jiang H, Jiang H, Jiang J, Kachman M, Kiyonami R, Klavins K, Klose C, Köfeler HC, Kolmert J, Koal T, Koster G, Kuklenyik Z, Kurland IJ, Leadley M, Lin K, Maddipati KR, McDougall D, Meikle PJ, Mellett NA, Monnin C, Moseley MA, Nandakumar R, Oresic M, Patterson R, Peake D, Pierce JS, Post M, Postle AD, Pugh R, Qiu Y, Quehenberger O, Ramrup P, Rees J, Rembiesa B, Reynaud D, Roth MR, Sales S, Schuhmann K, Schwartzman ML, Serhan CN, Shevchenko A, Somerville SE, St. John-Williams L, Surma MA, Takeda H, Thakare R, Thompson JW, Torta F, Triebl A, Trötzmüller M, Ubhayasekera SJK, Vuckovic D, Weir JM, Welti R, Wenk MR, Wheelock CE, Yao L, Yuan M, Zhao XH, Zhou S: Harmonizing lipidomics: NIST interlaboratory comparison exercise for lipidomics using SRM 1950-Metabolites in Frozen Human Plasma. J. Lipid Res 58, 2275–2288 (2017). doi: 10.1194/jlr.M079012 [DOI] [PMC free article] [PubMed] [Google Scholar]
- 35.Elias JE, Gibbons FD, King OD, Roth FP, Gygi SP: Intensity-based protein identification by machine learning from a library of tandem mass spectra. Nat. Biotechnol 22, 214–219 (2004). doi:Doi 10.1038/Nbt930 [DOI] [PubMed] [Google Scholar]
- 36.Scheubert K, Hufsky F, Petras D, Wang M, Nothias LF, Dührkop K, Bandeira N, Dorrestein PC, Böcker S: Significance estimation for large scale metabolomics annotations by spectral matching. Nat. Commun 8, (2017). doi: 10.1038/s41467-017-01318-5 [DOI] [PMC free article] [PubMed] [Google Scholar]
- 37.Palmer A, Phapale P, Chernyavsky I, Lavigne R, Fay D, Tarasov A, Kovalev V, Fuchser J, Nikolenko S, Pineau C, Becker M, Alexandrov T: FDR-controlled metabolite annotation for high-resolution imaging mass spectrometry. Nat. Methods 14, 57–60 (2016). doi: 10.1038/nmeth.4072 [DOI] [PubMed] [Google Scholar]
Associated Data
This section collects any data citations, data availability statements, or supplementary materials included in this article.


