

Summary
Epilepsy is among the most common chronic neurological disorders with 30–40% of patients suffering from seizures despite antiepileptic drug treatment. The advent of brain imaging and network analyses has greatly improved the understanding of this condition. In particular, developments in magnetic resonance imaging (MRI) have provided measures for the non-invasive characterization and detection of lesions causing epilepsy. MRI techniques can probe structural and functional connectivity, and network analyses have shaped our understanding of whole-brain anomalies associated with focal epilepsies. This review considers progress made by neuroimaging and connectomics in the study of drug-resistant epilepsies due to focal substrates, particularly temporal lobe epilepsy related to mesiotemporal sclerosis and extratemporal lobe epilepsies associated with malformations of cortical development. In these disorders, there is evidence for widespread disturbances of structural and functional connectivity. Studying the interplay between macroscale network anomalies and lesional profiles is hoped to improve our understanding of focal epilepsies and assist treatment choices.
Keywords: Epilepsy, MRI, connectivity, biomarker, connectome
Introduction
Epilepsy is a chronic neurological disorder affecting 0.5–1.5% of the world population and contributing an estimated 0.7% to the global disease burden 1. More than a third of patients continue to experience seizures despite anti-epileptic drug therapy 2. Individuals with drug-resistant seizures show markedly elevated risk of morbidity, functional impairment, and premature mortality compared to those with seizure control 3. Cross-sectional and longitudinal studies have emphasized that uncontrolled epilepsy may cause cognitive impairment and brain damage 4. There is a pressing need to improve our understanding of the epilepsies and to develop better diagnostic tools, improved stratification, and more effective therapies.
This review highlights the contributions and potential of neuroimaging and connectome analyses to understand the neurobiological substrate of drug-resistant epilepsy. MRI has improved our ability to detect lesions associated with the epileptogenic region, enabling surgery in patients previously considered ‘non-lesional’ 5. In parallel, there has been a rapid rise in techniques to estimate and quantify structural connectivity and functional interactions between distributed regions 6. Applications of brain connectivity studies have collectively contributed to the evolving concept of focal epilepsy as a disorder of large-scale networks. Here, we try to bring both levels of disease description together and discuss how their integration refines our understanding of drug-resistant epilepsy and how this can aid prognostication and therapies.
Imaging the lesion spectrum
The most common surgically-amenable syndromes are temporal lobe epilepsy (TLE) associated with mesiotemporal sclerosis (MTS) and extratemporal epilepsies (ETE) related to malformations of cortical development, particularly focal cortical dysplasia (FCD). Together, these account for 60–80% of presurgical patients in tertiary epilepsy centers.
In TLE, the epileptogenic circuitry generally encompasses mesial temporal structures, and these structures also show marked histopathological changes. Neuronal loss and gliosis is indeed seen across hippocampal subfields 7, amygdala 8, and parahippocampal subregions 9. Classically, these changes were visualized using volumetric techniques, with atrophy predominantly localized ipsilateral to the focus 10; 11, involving predominantly the hippocampus and entorhinal cortex. Given its sensitivity to reactive astrogliosis, sometimes the only detectable pathology in patients with subtle neuronal loss 12, T2-weighted MRI and T2 relaxometry offer complementary information for MTS detection 13. Furthermore, increased access to high-field scanners provides contrast-rich data with submillimetric resolution in feasible acquisition times, sufficient to resolve hippocampal subfields 14; 15 and their internal structure 16. In TLE, subfield assessments have shown improved detection of subtle MTS 14 and combinations of subfield imaging and surface-shape modeling can increase analysis resolution 17; 18, allowing continuous parameter analyses along the long axis. Surface-based integration of different contrasts, such as local volume, T2 intensity, and diffusion parameters can assist in lateralization of the focus and predict MTS pathological grades in vivo [Figure 1, left 19].
Figure 1.

Left: Neuroimaging of hippocampal sclerosis (HS, cell loss and gliosis in the hippocampal formation). Upper panels show histological specimens and corresponding high-resolution T1-and T2-weighted images in two TLE patients with variable degrees of HS. Lower panels illustrate preoperative imaging findings in two cohorts with TLE relative to controls, with the one on the left presenting with isolated gliosis but only little cell loss while patients on the right showed marked HS. For details, see 19. TLE-HS shows decreased volume together with T2-weighted intensity increases compared to controls. TLE-gliosis only showed focal increases in T2-weighted intensity but no reductions in columnar volumes. CA: Cornu Ammonis Subfield, DG – Dentate Gyrus – Sub – Subiculum. Right: Neuroimaging profiles of FCD subtypes (i.e., FCD Type-IIA, red, and IIB, black). Features include T1w-and FLAIR-intensity, vertical, and horizontal gradients. Features were analyzed at different intracortical depths (25–100%). Compared to controls, abnormalities in FCD Type IIB were seen across most intracortical layers, whereas alterations remained closer to the gray matter/white matter boundary in IIA. The innermost marker indicates significant differences between an FCD subtype and healthy controls, while the outermost marker indicates significant differences between both FCD subtypes i.e., IIA and IIB (* FDR < 0.05; • Uncorrected p < 0.05). For details, see 94.
FCD Type-II is highly epileptogenic and histologically characterized by dyslamination and cytological anomalies, including dysmorphic neurons sometimes in conjunction with balloon cells 20. Ectopic neurons and hypertrophic astrocytes may also be present in the white matter immediately below the cortical boundary. On T1-weighted MRI or FLAIR, Type-II lesions often show increased cortical thickness and blurring, together with grey and white matter signal changes 21. Lesions vary in size, ranging from filling a gyrus to a few voxels; small lesions seem to preferentially occur at the bottom of sulci 22. There are several automated identification algorithms employing different imaging techniques 5, including voxel based morphometry, intensity, and texture analyses 23; 24 and analyses of surface features such as cortical thickness, blurring, and folding [Figure 1, right 25; 26]. Detection rates may reach 60–70% in cohorts with histologically-verified FCD-II 25. Selection bias is a major factor to be considered, as is the need to balance sensitivity and specificity when applying the method to individual subjects. In some series, relatively low false positive rates in healthy individuals make them clinically appealing, but there remains a need to evaluate algorithms across different imaging sites to determine how robust, generalizable, and accessible they are.
Up to 50% of individuals referred to tertiary centers are MRI-negative 27. These patients often undergo intracranial electrophysiological investigations and chances of seizure freedom are reduced compared to cases in whom a lesion was found on MRI 28. Retrospective histological series in patients with unremarkable MRI indicate high proportions of subtle FCD Type-II and Type-I 29, a malformation of cortical organization characterized only by laminar architectural disturbances 20, and re-inspection of the MRI often confirms subtle anomalies that were initially missed 30.
Ultra-high field MRI at 7T and beyond offers theoretical possibilities to increase spatial resolution to 350–500 µm, a scale at which cortical columns and layers may be visualized in vivo. Paralleling increases in resolution, the use of quantitative MR contrasts may better separate intracortical myelin from iron compared to “weighted” contrasts, and thus add specificity to identify typical and atypical cortical laminar architecture. Preliminary assessments suggest benefits for localization 31. In TLE, a recent quantitative intracortical analysis – even at conventional 3T MRI-identified intracortical anomalies suggestive of myelin alterations in hippocampal allocortices and other temporo-limbic areas, suggesting coupled microstructural perturbations in mesiotemporal and adjacent paralimbic networks 32.
In sum, advances in MR acquisition and processing offer a window into tissue microstructure and morphology. These approaches increase sensitivity for the identification of lesions giving rise to epilepsy and lend in vivo signatures of specific pathological anomalies that may inform patient prognosis and therapy. Given the association between postoperative seizure freedom and identification of a lesion on MRI, there is a need to take advantage of best-practice, three dimensional, and whole-brain imaging techniques. Improvements in MRI can provide a wealth a new information. These new approaches need to be validated through large multi center studies regarding their diagnostic accuracy, sensitivity and specificity before they can be fully integrated into clinical practice. Nonetheless, they promise a quantifiable improvement to a diagnostic process that, for the most part, remains reliant on visual inspection. Explorations of network changes in epilepsy should be anchored on optimal structural imaging as a baseline for lesion detection, in order to understand the role of lesions in the pathological network and to derive networks from the most meaningful representations of participant anatomy.
Towards a network level conceptualization of focal epilepsy
In addition to increasingly detailed in vivo characterizations of epileptogenic lesions, neuroimaging has been instrumental in unveiling network pathology in focal epilepsies. In TLE, diffusion MRI analyses of white matter tracts have outlined widespread architectural alterations, generally characterized by reduced anisotropy and increased diffusivity of deep 33; 34 and superficial fibers 35. Although findings are not limited to a specific lobe or circuit, they appear more marked in ipsilateral temporo-limbic tracts. Tract-based profiling of diffusion parameters reveals severe microstructural anomalies close to the temporal lobe 36, while effects taper off towards other regions, suggesting most prominent anomalies in the vicinity of the mesiotemporal disease epicentre. Interestingly, the topography of whole-brain diffusion changes appears to be different from whole-brain grey matter morphometric findings in TLE. Indeed, in contrast to the pattern of diffusion MRI changes that may be widespread but generally most severe in ipsilateral temporo-limbic regions, MRI-based analyses of grey matter morphology and cortical thickness have shown a rather consistent association between TLE and bilateral neocortical atrophy, which affects prefrontal, lateral temporal, frontocentral, and parietal regions [Figure 2, top left; 37–39] also involving subcortical structures such as the thalamus 40. In a previous report, diffusion MRI anomalies of the superficial white matter regions were furthermore found to be rather stable even after local cortical thickness variations were statistically corrected for 35. Collectively, these findings suggest that diffusion and morphological markers tap into different structural anomalies as well as also potentially different disease processes. In fact, diffusion MRI changes likely reflect downstream effects of hippocampal pathology on white matter connectivity, also supported by tractographic findings showing more marked white matter anomalies in cohorts with hippocampal anomalies compared to those without 41. On the other hand, cortical thickness changes seem to be somewhat independent from the overall degree of hippocampal anomalies, irrespective of the side of the seizure focus 37.
Figure 2.
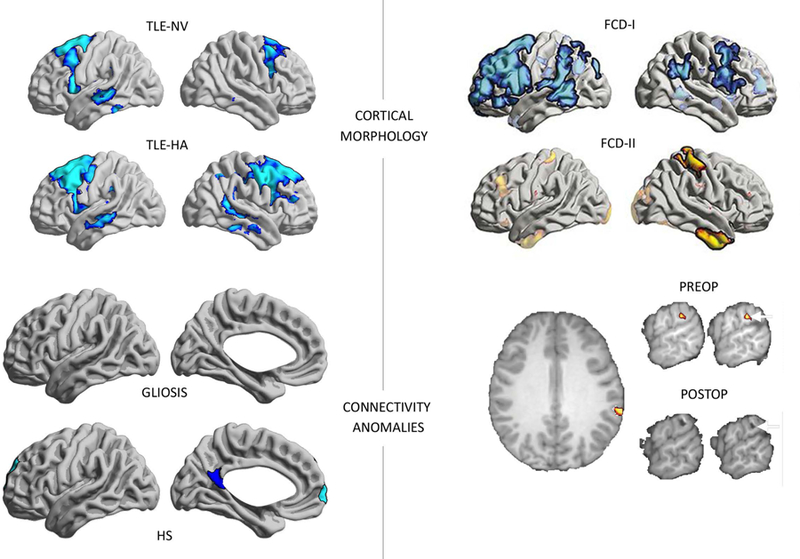
Structural and functional connectivity anomalies in TLE and ETE. Top left: Top left: Widespread cortical thinning in temporal and fronto-central neocortices in (MRI-defined) subgroups of patients with hippocampal atrophy (TLE-HA) and patients with normal hippocampal volume (TLE-NV) compared to controls, based on a sample of TLE patients and healthy individuals scanned at 1.5T 37. Top right: In dysplasia-related ETE, a study has shown that the direction of overall morphometric anomalies may be different as a function of the specific histological subtype of the primary lesion 42. Bottom left: Disruptions in hippocampal functional connectivity are selectively seen in TLE subgroups, who had postoperative histological assessment of hippocampal pathology, compared to healthy controls. Functional connectivity anomalies were seen in patients with hippocampal sclerosis (TLE-HS) but not in the subgroup of TLE patients that showed isolated astrogliosis (TLE-G), suggesting an association between hippocampal structural integrity and its functional network embedding. For details, see 19. Please note that results in the Top Left and Bottom Left were obtained from two independent TLE cohorts, scanned at different MRI platforms, with different procedures to assess the degree of hippocampal structural alterations. Bottom right: Functional connectivity anomalies in a patient with ETE co-localizing with the surgical target. The patient has been seizure-free post-op 57.
In ETE related to FCD, morphometric analyses have found widespread structural anomalies, which differ across histological subtypes. Analyzing frontal lobe epilepsy patients with FCD I and II, widespread cortical thinning was shown in Type I while patients with Type II presented with scattered thickening [Figure 2, top right; 42]. In light of findings showing aberrant synaptogenesis of dysmorphic neurons, failure of oligodendroglia differentiation, and perturbation of axonal processes in FCD II 43, the primary lesion and mutually connected cortices may show delayed pruning, ultimately manifesting as gray matter excess in regions participating in the same maturational-trophic network as the lesion. Conversely, widespread cortical thinning in FCD Type I may reflect the post-migratory malformation 44, and which may compromise the efficacy of focal resections. Although structural connectivity anomalies in dysplasia-related epilepsy has been less studied than cortical morphology, there are findings of alterations of intra-hemispheric fibers as well as the corpus callosum 45, Recent data in ETE related to FCD found anomalies in thalamic tracts 46, indicating subcortical network reconfigurations with these cortical lesions.
Alterations in morphology and structural wiring may perturb functional network organization, as probed using task-free (“resting-state”) functional MRI (rs-fMRI). rs-fMRI offers a window to resolve dynamic interactions between distributed regions. rs-fMRI network descriptors are consistent and replicable across subjects, suggesting that they may serve as patient specific biomarkers 47. In TLE, rs-fMRI studies have shown mainly decreased functional connectivity within ipsilateral mesiotemporal circuits 48, between ipsilateral and contralateral mesiotemporal regions 49, and between mesial and lateral temporal regions 50. Connectivity reductions, sometimes together with scattered increases 51, have also been reported between mesiotemporal regions and nodes of the default mode network (DMN), notably prefrontal and midline parietal cortices 19; 52. In healthy populations, hippocampal and parahippocampal cortices closely interact with the default network and form an important subcomponent that is relevant for memory 16. Interestingly, the severity of hippocampal structural pathology in TLE directly relates to reductions in its functional connectivity, with patients displaying marked sclerosis generally showing lower connectivity to DMN hubs than those with isolated gliosis [Figure 2, bottom left; 19]. Similar findings have also been shown for diffusion derived connectomes, with patients with MTS being more severely affected than those with only subtle cell loss 53. Reduced connectivity between hippocampal and DMN hubs may contribute to more severe impairments in memory processes in those with marked hippocampal damage 54.
In ETE, task-based 55 and rs-fMRI studies 56 have also suggested functional reorganization beyond the primary lesion. Studying an ETE patient, specific reductions in whole brain functional connectivity have been shown to closely overlap with the area that needed to be surgically removed, suggesting potential benefits of connectomics features for presurgical lesion localization [Figure 2; bottom right; 57]. A recent study of FCD identified diverging patterns of hyper-as well as hypo-connectivity to different areas of cortex across the lesion spectrum, suggesting distributed alterations in functional connectivity profiles 58. The analysis also highlighted differences in whole-brain functional anomalies based on the specific connectivity embedding of the lesion. In fact, patients that had overall hyper-connected lesions had more marked whole-brain network reorganization, while connectome signatures were modest in patients with generally disconnected lesions 58.
In sum, a growing number of studies have shown alterations in large-scale morphology, structural connectivity, and functional connectivity in “focal” epilepsies. In TLE, diffusion MRI data suggest a more temporo-limbic distribution closely associated with hippocampal pathology, while grey matter changes seem to affect widespread and bilateral networks, possibly also related to progressive effects 37. Functional anomalies in TLE are rather broad, although temporo-limbic and DMN reorganization is among the more consistent findings. Reorganization of functional networks appears closely related to the severity of hippocampal pathology 19. In dysplasia-related ETE, distributed patterns of cortical morphological changes mirror the lesional substrate, with thinning in FCD-I and thickening in FCD-II, potentially suggesting a developmental pathology affecting the formation and maturation of a distributed and more extensive network. As in TLE, diffusion and functional findings in FCD-related ETE suggest more widespread anomalies.
It is important to consider that abnormal neuroplasticity may play a role in epilepsy. Over time, the recruitment of recurrent excitation pathways can lead to reinforcement of seizure generation and seizure propagation networks. Therefore, network abnormalities may not only provide important information about the location of seizure onset, but may also illuminate how the disease changes dynamically in relationship with epilepsy severity. Network analyses may provide important information about the pathophysiology of the disease, and help phenotype individuals with seemingly similar classification, for example, in distinguishing individuals with TLE regarding their epileptogenic potential and likelihood of success with medication or surgery.
Epilepsy connectomics
The increasing abilities to map large-scale networks with neuroimaging is paralleled by a rise in analytics capturing principles of system-level organization. One of the most widely used frameworks is graph-theory, the analysis of topological properties of networks made up of nodes (regions) and edges (connections). In TLE, structural MRI covariance 59; 60, diffusion MRI 61, rs-fMRI connectivity 62, and inter-ictal EEG coherence analyses 63 have employed graph theoretical analyses (Figure 3), and showed an association between TLE and increases in path length, sometimes together with increases in local clustering. Increases in clustering and path length reflect overall network regularization (i.e., a more lattice-like configuration of the brain network, related to increased local but reduced global efficiency). A meta-analysis across twelve studies also confirmed increased clustering and path length 64, but noted methodological heterogeneity across studies and limitations in sample size. More regularized network topology has also been reported at the time of seizure onset in intra-cerebral EEG analysis 65, possibly representing a mechanism to contain seizure-related activity, or reflecting the process of seizure initiation 66. Seizure termination, on the other hand, often relates to an increasing randomization of network configurations – i.e., a shift towards a globally integrated communication 66.
Figure 3.

Connectome-level findings in focal epilepsy. Top left: Structural covariance anomalies in TLE, showing increased path length and clustering in left and right TLE (LTLE/RTLE) patients compared to controls, suggesting network-level regularization 59. Top right: Covariance network analyses in extra-temporal epilepsy also suggest an increased clustering and path length across all subtypes, with however more marked effects in late stage cortical malformations (PMG – polymicrogyrias) compared to those thought to occur mainly in early (FCD Type-II) and intermediary stages (HET – heterotopia) of corticogenesis. Bottom left: Functional connectivity anomalies in TLE relative to controls, also showing increased path length 95. Bottom right: Functional network anomalies in a cohort of ETE showing an increase in local efficiency and higher clustering coefficient compared to healthy controls, suggesting increased local network segregation 96.
As in TLE, diffusion and rs-fMRI network analyses in ETE have suggested a more regularized network topology 67. Analyzing task-free fMRI data in patients with polymicrogyria, a malformation of cortical development associated with atypical cortical folding, a recent study showed increased clustering and path length in the lesion compared to contralateral areas 68, suggesting that lesional anomalies may disproportionally contribute to widespread changes. An association between lesional and network phenotypes was also demonstrated in ETE associated to several cortical malformations 69. Although patients overall presented with more regular structural networks compared to controls, network rearrangement was more severe in late-stage malformations (FCD-I, polymicrogyria) while patients with FCD-II showed only modest disruptions, suggesting an interaction between the timing of the malformative process and network anomalies. Later gestational stages are characterized by extensive cortico-cortical network formation, and disruptions in these periods may result in a potentially more widespread cortico-cortical network perturbation than anomalies affecting early proliferative stages of development that are characterized by neuroglial proliferation and radial migration to a more confined cortical territory.
In sum, previous studies suggest increases in path length often (but not always) together with increases in network clustering in patients with drug-resistant epilepsy. As for localized network changes, whole brain network phenotypes seem to be additionally modulated by the specific lesional substrate and histopathological subtype, which may suggest common developmental and disease related processes affecting the lesion and macroscale network organization. A series of recent studies utilized network diffusion models, a formalism that simulates signal spread following a local perturbation 70 to develop spatial predictors of structural alterations in TLE. Similarly, hippocampal covariance networks have been leveraged as spatial predictors of changes in intracortical FLAIR intensity, potentially suggesting that network models can delineate pathways of preferential susceptibility to epilepsy related brain anomalies 71.
Clinical connectomics
In focal epilepsy, an increasing body of work has begun to examine the utility of network analytical measures as markers of clinical and cognitive state in patients.
Network features have been used to identify surgical targets, complementing state-of-the-art neuroimaging, particularly in cases where anomalies are subtle or ambiguous. Functional and structural network information have shown potential to be useful to lateralize the seizure focus in TLE 72. In a previous rs-fMRI connectivity study of temporal and extratemporal epilepsy, seizure onset zone as defined by intracranial EEG also displayed intrinsic local connectivity anomalies 73, warranting further investigations on the specificity of these techniques. Co-registering intracranial EEG information with diffusion MRI derived structural connectome data across a cohort of patients with temporal and extra-temporal foci, a recent study suggested a divergence of connectivity patterns in epileptogenic compared to non-epileptogenic areas, with epileptogenic networks displaying more intact local connectivity while whole brain connectivity strength seemed to be reduced 74. The biological implications of these data are not yet clear.
While network markers may ultimately improve surgical target localization, or guide neuromodulatory treatments, they may also serve as predictors of post-surgical outcome (Figure 4A). Diffusion connectome features have been assessed most frequently, given their ability to probe networks in single patients, in TLE 75. A recent study combined structural connectome features with deep learning, providing high positive and negative predictive values for postoperative outcome prognosis 76. Data from rs-fMRI analysis has furthermore shown an association between increased thalamic hubness and seizure recurrence, and these features allowed for individualized prediction with moderate accuracy 77. Preselection of relevant features may improve accuracies, and a previous rs-fMRI study has achieved up to 100% accuracy in outcome prediction based on connectivity patterns in temporo-limbic and DMN areas 78. As for the lesion detection paradigms, however, surgical outcome prediction experiments have so far been generally based on small, single-site datasets, motivating additional efforts to share and pool resources. Furthermore, benefits of network-based outcome predictors in TLE, when advanced MRI phenotyping is applied (which also yields >90% accuracy in selected series 17) still need to be established, especially given data suggesting marked interactions between hippocampal damage and structural and functional networks. In ETE related to FCD, network features may also be useful for outcome prediction (Figure 4B). Specifically, classifying lesions based on the degree of functional connectivity between lesional tissue and its overarching network community may improve prediction of outcome in single patients when using supervised learning algorithms 58.
Figure 4.

Connectome models of postsurgical seizure outcome in TLE (left) and dysplasia-related ETE (right). For details, please see 58; 76.
A third field of application of connectome tools has been the identification of structural and functional substrates of cognitive variables. In mixed epilepsy cohorts, network markers have been used to predict verbal competences 79 and episodic memory 80. Network features have furthermore been used to identify language network organization and efficiency [Figure 5A; 81]. As a surgically amenable disorder, the study of epilepsy offers additional opportunities to assess functional network reorganization post-op. Several studies combined pre-and postoperative imaging to track network rearrangement in surgical candidates with TLE [Figure 5B; 82], improving understanding and the prediction of memory 83 and language outcomes 84. Based on diffusion MRI tractographic mapping, there has been work observing an association between fiber tract resection and functional deficits 85
Figure 5.
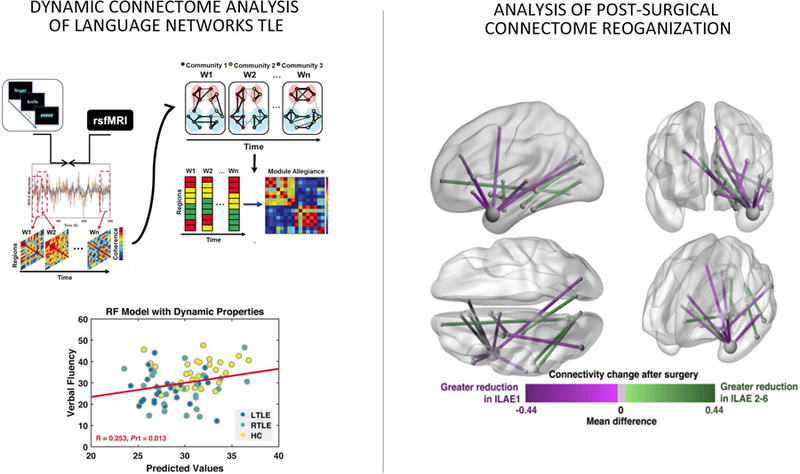
Left: Dynamic functional connectome markers of language networks in TLE, which can be used to predict impairments in verbal fluency 81. Right: Pre-to postoperative changes in diffusion-derived macroscale connectivity, with differ between seizure free and non-seizure free patients 82.
In short, connectomics is increasingly utilized in an attempt to better inform clinical care in drug-resistant epilepsy. This promising approach can lead to a more precise detection of the seizure onset zone, a key node in the epileptogenic network, and thus contribute to better post-surgical outcome and quality of life in patients. Combinations of connectomics with machine learning have achieved encouraging results to predict seizure recurrence in TLE. Network markers have also been used to predict cognitive functioning in epilepsy, and longitudinal data in particular can be used to study how network reorganization relates to functional changes pre-and post-surgery. Thus, by tracking structural and functional substrates of important factors for better quality of life in patients, network-level phenotyping may ultimately improve diagnosis and clinical care in drug-resistant epilepsy. As with any new methodology, epilepsy connectomics requires careful validation to be systematically included in routine clinical practice. For a meaningful biomarker assessment, this requires a careful evaluation of validity, reliability, sensitivity, specificity, and applicability 47. Notably, the literature is so far largely devoid of studies that systematically compare the reliability and diagnostic utility of connectome-based measures against simpler imaging and connectivity metrics, including volumetric MRI techniques, tract-wise measures of diffusivity, or seed-based functional connectivity measures. Connectome-level analyses are also not ‘turnkey’ yet, and often rely on relatively complex imaging processing and multimodal integration pipelines. As for other imaging techniques, high-quality data is key to rule out confounds and inferential failures. Nonetheless, connectomic techniques have profound theoretical potential to improve the diagnosis and treatment of epilepsy, by moving from a visual lesion inspection paradigm to a system-level approach centered on the analysis of personalized maps of aberrant connectivity.
Summary and future avenues
Neuroimaging and network neuroscience have brought forward tools to profile local lesions, whole-brain anomalies, and large-scale networks. These can capture the impact of the disease on micro-and macroscale structural and functional organization. Drug-resistant focal epilepsies can be generally characterized by a continuum between a focal lesional condition and a network disorder. An understanding of network-level perturbations needs to consider the putative lesion as being a pivotal node in the patient-specific network. Conversely, even the most detailed lesion models may suffer from residual limitations in surgical target definition and the prediction of treatment outcomes, and will likely benefit from the incorporation of network data.
As it is a surgically-amenable disorder, the study of drug-resistant epilepsy offers important opportunities to validate non-invasive imaging and network models. Recently, MR imaging was co-registered to quantitative histopathological specimens, allowing for regionally specific in vivo/ex vivo correlation analysis 86. Moreover, diffusion parameters have been related to microstructural measures of the fimbria-fornix pathway 87 suggesting a link between diffusion anisotropy and markers of membrane integrity, findings that are relevant and informative to the epilepsy and neuroimaging communities at large.
Connectome-informed computational models of both healthy and diseased brains 88 may lend features to enrich neuroimaging and network neuroscience markers and to make simulation-based predictions 89. In epilepsy, computational models have proven useful for target definition and post-surgical outcome prediction 90, and recent work used computational simulations operating on connectomes to delineate pathways of seizure propagation 91.
The interplay between network and lesional phenotypes points to coupled pathological mechanisms affecting different elements in the brain simultaneously. Several epilepsy syndromes show a progressive course, characterized by cumulative brain changes in areas close to the primary lesion and in remote cortical targets 4. Longitudinal studies will be of value as they can be used to assess causality between lesional and network level changes, and address clinical, psychosocial, and medication related factors. As the necessity for treatment in drug-resistant cohorts precludes the study of within-patient change over extended time frames, structured and accelerated designs that systematically enroll patients at different time points in their disease course, from new-onset to chronic long-standing, are recommended. Specifically, prospective analysis of new-onset patients may help to better disentangle medication related effects from those related to seizures. Additional inclusion of healthy individuals, scanned at comparable intervals, will help to differentiate epilepsy disease progression from structural and functional changes seen in healthy aging 4.
Recent efforts have also begun to explore pre-existing genetic underpinnings of anomalies in brain structure, function, and connectivity across common epilepsy syndromes. These include patient-sibling studies in both generalized and focal syndromes (e.g., 92), aiming at dissociating disease effects that are only observable in patients from endophenotypes that are shared by patients and their non-epileptic siblings.
International initiatives such as ENIGMA-epilepsy 93 have shown that it is possible to aggregate multimodal neuroimaging metrics and clinical information across different sites, and to coordinate analytical strategies. Such large-scale, open, and concerted efforts will be instrumental for the robust validation of novel approaches and biomarkers.
Key Bullet Points.
Advances in multimodal neuroimaging provides increasing sensitivity to identify and profile localized anomalies in neocortical and hippocampal subregions
Connectome analyses in drug-resistant syndromes consistently show large-scale network anomalies, suggesting that these are not purely focal disorders
Integrating multimodal MRI with macroscale connectomics promises to better understand both the local and network-level substrates of drug-resistant epilepsies
Integrated approaches that bridge lesional and connectome scales have a high potential to serve as clinically useful tools, including routines for the prediction of post-operative outcomes
Acknowledgements
Leonardo Bonilha receives research support from the National Institutes of Health / National Institute on Deafness and Other Communication Disorders (DC014021 and DC014664) and from the American Heart Association (SFDRN26030003). Neda Bernasconi was funded by CIHR and received salary support from FRQS. Andrea Bernasconi acknowledges funding from CIHR, National Science and Engineering Research Council of Canada (NSERC), and the Quebec BioImaging Network (QBIN). Boris Bernhardt acknowledges research support from NSERC (Discovery-1304413), CIHR (FDN-154298), Azrieli Center for Autism Research of the Montreal Neurological Institute (ACAR), SickKids Foundation (NI17-039), and salary support from FRQS (Chercheur Boursier Junior 1). We apologize to all the investigators whose research could not be appropriately cited owing to space limitations.
Footnotes
Disclosure
None of the authors has any conflict of interest to disclose.
Ethical publication
We confirm that we have read the Journal’s position on issues involved in ethical publication and affirm that this report is consistent with those guidelines.
References
- 1.Chin JH, Vora N. The global burden of neurologic diseases. Neurology 2014;83:349–351. [DOI] [PMC free article] [PubMed] [Google Scholar]
- 2.Kwan P, Brodie MJ. Early identification of refractory epilepsy. N Engl J Med 2000;342:314–319. [DOI] [PubMed] [Google Scholar]
- 3.Engel J Jr. What can we do for people with drug-resistant epilepsy? The 2016 Wartenberg Lecture. Neurology 2016;87:2483–2489. [DOI] [PMC free article] [PubMed] [Google Scholar]
- 4.Caciagli L, Bernasconi A, Wiebe S, et al. Time is brain? A meta-analysis on progressive atrophy in intractable temporal lobe epilepsy. Neurology 2017;in press. [DOI] [PMC free article] [PubMed]
- 5.Bernasconi A, Bernasconi N, Bernhardt BC, et al. Advances in MRI for ‘cryptogenic’ epilepsies. Nat Rev Neurol 2011;7:99–108. [DOI] [PubMed] [Google Scholar]
- 6.Lariviere S, Vos de Wael R, Paquola C, et al. Microstructure-informed connectomics: enriching large-scale descriptions of healthy and diseased brains. Brain Connect 2018. [DOI] [PMC free article] [PubMed]
- 7.Blumcke I, Thom M, Aronica E, et al. International consensus classification of hippocampal sclerosis in temporal lobe epilepsy: A Task Force report from the ILAE Commission on Diagnostic Methods. Epilepsia 2013;54:1315–1329. [DOI] [PubMed] [Google Scholar]
- 8.Yilmazer-Hanke DM, Wolf HK, Schramm J, et al. Subregional pathology of the amygdala complex and entorhinal region in surgical specimens from patients with pharmacoresistant temporal lobe epilepsy. J.Neuropathol.Exp.Neurol 2000;59:907–920. [DOI] [PubMed] [Google Scholar]
- 9.Du F, Whetsell WO, Abou-Khalil B, et al. Preferential neuronal loss in layer III of the entorhinal cortex in patients with temporal lobe epilepsy. Epilepsy Res 1993;16:223–233. [DOI] [PubMed] [Google Scholar]
- 10.Cendes F, Andermann F, Watson C, et al. MRI volumetric measurements of amygdaloid body and hippocampal formation: inter and intra rater differences. Can J Neurol Sci 1992;19:285. [Google Scholar]
- 11.Bernasconi N, Bernasconi A, Caramanos Z, et al. Mesial temporal damage in temporal lobe epilepsy: a volumetric MRI study of the hippocampus, amygdala and parahippocampal region. Brain 2003;126:462–469. [DOI] [PubMed] [Google Scholar]
- 12.Jackson GD, Kuzniecky RI, Cascino GD. Hippocampal sclerosis without detectable hippocampal atrophy. Neurology 1994;44:42–46. [DOI] [PubMed] [Google Scholar]
- 13.Jackson GD, Connelly A, Duncan JS, et al. Detection of hippocampal pathology in intractable partial epilepsy: increased sensitivity with quantitative resonance T2 relaxometry. Neurology 1993;43:1793–1799. [DOI] [PubMed] [Google Scholar]
- 14.Mueller SG, Laxer KD, Barakos J, et al. Subfield atrophy pattern in temporal lobe epilepsy with and without mesial sclerosis detected by high-resolution MRI at 4 Tesla: Preliminary results. Epilepsia 2009;50:1474–1483. [DOI] [PMC free article] [PubMed] [Google Scholar]
- 15.Kulaga-Yoskovich J, Bernhardt BC, Hong S, et al. Multi-contrast submillimetric 3-Tesla hippocampal subfield segmentation protocol and dataset. Scientific Data 2015;2:1–9. [DOI] [PMC free article] [PubMed] [Google Scholar]
- 16.Vos de Wael R, Lariviere S, Caldairou B, et al. Anatomical and microstructural determinants of hippocampal subfield functional connectome embedding. Proc Natl Acad Sci U S A 2018;115:10154–10159. [DOI] [PMC free article] [PubMed] [Google Scholar]
- 17.Bernhardt BC, Hong SJ, Bernasconi A, et al. Magnetic resonance imaging pattern learning in temporal lobe epilepsy: Classification and prognostics. Ann Neurol 2015;77:436–446. [DOI] [PubMed] [Google Scholar]
- 18.Maccotta L, Moseley ED, Benzinger TL, et al. Beyond the CA1 subfield: Local hippocampal shape changes in MRI-negative temporal lobe epilepsy. Epilepsia 2015. [DOI] [PMC free article] [PubMed]
- 19.Bernhardt BC, Bernasconi A, Liu M, et al. The spectrum of structural and functional imaging abnormalities in temporal lobe epilepsy. Ann Neurol 2016;80:142–153. [DOI] [PubMed] [Google Scholar]
- 20.Blumcke I, Thom M, Aronica E, et al. The clinicopathologic spectrum of focal cortical dysplasias: a consensus classification proposed by an ad hoc Task Force of the ILAE Diagnostic Methods Commission. Epilepsia 2011;52:158–174. [DOI] [PMC free article] [PubMed] [Google Scholar]
- 21.Barkovich AJ, Guerrini R, Kuzniecky RI, et al. A developmental and genetic classification for malformations of cortical development: update 2012. Brain 2012;135:1348–1369. [DOI] [PMC free article] [PubMed] [Google Scholar]
- 22.Besson P, Andermann F, Dubeau F, et al. Small focal cortical dysplasia lesions are located at the bottom of a deep sulcus. Brain 2008;131:3246–3255. [DOI] [PubMed] [Google Scholar]
- 23.Bernasconi A, Antel SB, Collins DL, et al. Texture analysis and morphological processing of magnetic resonance imaging assist detection of focal cortical dysplasia in extra-temporal partial epilepsy. Ann Neurol 2001;49:770–775. [PubMed] [Google Scholar]
- 24.Wang ZI, Jones SE, Jaisani Z, et al. Voxel-based morphometric magnetic resonance imaging (MRI) postprocessing in MRI-negative epilepsies. Ann Neurol 2015;77:1060–1075. [DOI] [PMC free article] [PubMed] [Google Scholar]
- 25.Hong S, Kim H, Bernasconi N, et al. Automated detection of cortical dysplasia type II in MRI-negative epilepsy. Neurology 2014;83:48–55. [DOI] [PMC free article] [PubMed] [Google Scholar]
- 26.Thesen T, Quinn BT, Carlson C, et al. Detection of epileptogenic cortical malformations with surface-based MRI morphometry. PLoS One 2011;6:e16430. [DOI] [PMC free article] [PubMed] [Google Scholar]
- 27.Bernasconi A, Bernasconi N, Bernhardt BC, et al. Advances in MRI for ‘cryptogenic’ epilepsies. Nature Rev Neurol 2011;7:99–108. [DOI] [PubMed] [Google Scholar]
- 28.Cohen-Gadol AA, Wilhelmi BG, Collignon F, et al. Long-term outcome of epilepsy surgery among 399 patients with nonlesional seizure foci including mesial temporal lobe sclerosis. J Neurosurg 2006;104:513–524. [DOI] [PubMed] [Google Scholar]
- 29.Wang ZI, Alexopoulos AV, Jones SE, et al. The pathology of magnetic-resonance-imaging-negative epilepsy. Mod Pathol 2013;26:1051–1058. [DOI] [PubMed] [Google Scholar]
- 30.Ryvlin P, Rheims S. Predicting epilepsy surgery outcome. Curr Opin Neurol 2016;29:182–188. [DOI] [PubMed] [Google Scholar]
- 31.De Ciantis A, Barba C, Tassi L, et al. 7T MRI in focal epilepsy with unrevealing conventional field strength imaging. Epilepsia 2016;57:445–454. [DOI] [PubMed] [Google Scholar]
- 32.Bernhardt BC, Fadaie F, Vos de Wael R, et al. Preferential susceptibility of limbic cortices to microstructural damage in temporal lobe epilepsy: A quantitative T1 mapping study. Neuroimage 2017. [DOI] [PubMed]
- 33.Yogarajah M, Duncan JS. Diffusion-based magnetic resonance imaging and tractography in epilepsy. Epilepsia 2008;49:189–200. [DOI] [PubMed] [Google Scholar]
- 34.Concha L, Beaulieu C, Gross DW. Bilateral limbic diffusion abnormalities in unilateral temporal lobe epilepsy. Ann Neurol 2005;57:188–196. [DOI] [PubMed] [Google Scholar]
- 35.Liu M, Bernhardt BC, Hong SJ, et al. The superficial white matter in temporal lobe epilepsy: a key link between structural and functional network disruptions. Brain 2016;139:2431–2440. [DOI] [PMC free article] [PubMed] [Google Scholar]
- 36.Concha L, Kim H, Bernasconi A, et al. Spatial patterns of water diffusion along white matter tracts in temporal lobe epilepsy. Neurology 2012;79:455–462. [DOI] [PMC free article] [PubMed] [Google Scholar]
- 37.Bernhardt BC, Bernasconi N, Concha L, et al. Cortical thickness analysis in temporal lobe epilepsy: reproducibility and relation to outcome. Neurology 2010;74:1776–1784. [DOI] [PubMed] [Google Scholar]
- 38.McDonald CR, Hagler DJ Jr., Ahmadi ME, et al. Regional neocortical thinning in mesial temporal lobe epilepsy. Epilepsia 2008;49:794–803. [DOI] [PubMed] [Google Scholar]
- 39.Lin JJ, Salamon N, Lee AD, et al. Reduced neocortical thickness and complexity mapped in mesial temporal lobe epilepsy with hippocampal sclerosis. Cereb Cortex 2007;17:2007–2018. [DOI] [PubMed] [Google Scholar]
- 40.Keller SS, Richardson MP, O’Muircheartaigh J, et al. Morphometric MRI alterations and postoperative seizure control in refractory temporal lobe epilepsy. Hum Brain Mapp 2015;36:1637–1647. [DOI] [PMC free article] [PubMed] [Google Scholar]
- 41.Concha L, Beaulieu C, Collins DL, et al. White matter diffusion abnormalities in temporal lobe epilepsy with and without mesial temporal sclerosis. J Neurol Neurosurg Psychiatry 2008. [DOI] [PubMed]
- 42.Hong S, Bernhardt BC, Schrader DV, et al. Whole-brain MRI phenotying of dysplasia-related frontal lobe epilepsy. Neurology 2016;86:643–650. [DOI] [PMC free article] [PubMed] [Google Scholar]
- 43.Muhlebner A, Coras R, Kobow K, et al. Neuropathologic measurements in focal cortical dysplasias: validation of the ILAE 2011 classification system and diagnostic implications for MRI. Acta neuropathologica 2012;123:259–272. [DOI] [PubMed] [Google Scholar]
- 44.Blumcke I, Pieper T, Pauli E, et al. A distinct variant of focal cortical dysplasia type I characterised by magnetic resonance imaging and neuropathological examination in children with severe epilepsies. Epileptic disorders : international epilepsy journal with videotape 2010;12:172–180. [DOI] [PubMed] [Google Scholar]
- 45.Campos BM, Coan AC, Beltramini GC, et al. White matter abnormalities associate with type and localization of focal epileptogenic lesions. Epilepsia 2015;56:125–132. [DOI] [PubMed] [Google Scholar]
- 46.Rezayev A, Feldman HA, Levman J, et al. Bilateral thalamocortical abnormalities in focal cortical dysplasia. Brain Res 2018;1694:38–45. [DOI] [PubMed] [Google Scholar]
- 47.Castellanos FX, Di Martino A, Craddock RC, et al. Clinical applications of the functional connectome. Neuroimage 2013;80:527–540. [DOI] [PMC free article] [PubMed] [Google Scholar]
- 48.Bettus G, Guedj E, Joyeux F, et al. Decreased basal fMRI functional connectivity in epileptogenic networks and contralateral compensatory mechanisms. Hum Brain Mapp 2009;30:1580–1591. [DOI] [PMC free article] [PubMed] [Google Scholar]
- 49.Morgan VL, Rogers BP, Sonmezturk HH, et al. Cross hippocampal influence in mesial temporal lobe epilepsy measured with high temporal resolution functional magnetic resonance imaging. Epilepsia 2011;52:1741–1749. [DOI] [PMC free article] [PubMed] [Google Scholar]
- 50.Maccotta L, He BJ, Snyder AZ, et al. Impaired and facilitated functional networks in temporal lobe epilepsy. Neuroimage Clin 2013;2:862–872. [DOI] [PMC free article] [PubMed] [Google Scholar]
- 51.Cataldi M, Avoli M, de Villers-Sidani E. Resting state networks in temporal lobe epilepsy. Epilepsia 2013;54:2048–2059. [DOI] [PMC free article] [PubMed] [Google Scholar]
- 52.Pittau F, Grova C, Moeller F, et al. Patterns of altered functional connectivity in mesial temporal lobe epilepsy. Epilepsia 2012;53:1013–1023. [DOI] [PMC free article] [PubMed] [Google Scholar]
- 53.Bernhardt BC, Liu M, Caldairou B, et al. Temporal lobe epilepsy: hippocampal pathology modulates white matter connectomics. Neurology 2019;in press. [DOI] [PMC free article] [PubMed]
- 54.Bell B, Lin JJ, Seidenberg M, et al. The neurobiology of cognitive disorders in temporal lobe epilepsy. Nat Rev Neurol 2011;7:154–164. [DOI] [PMC free article] [PubMed] [Google Scholar]
- 55.Gaillard WD, Berl MM, Moore EN, et al. Atypical language in lesional and nonlesional complex partial epilepsy. Neurology 2007;69:1761–1771. [DOI] [PubMed] [Google Scholar]
- 56.Woodward KE, Gaxiola-Valdez I, Goodyear BG, et al. Frontal lobe epilepsy alters functional connections within the brain’s motor network: a resting-state fMRI study. Brain Connect 2014;4:91–99. [DOI] [PMC free article] [PubMed] [Google Scholar]
- 57.Jackson GD, Pedersen M, Harvey AS. How small can the epileptogenic region be? A case in point. Neurology 2017;88:2017–2019. [DOI] [PubMed] [Google Scholar]
- 58.Hong S, Bernhardt BC, Gill R, et al. Connectome-Based Pattern Learning Predicts Histology and Surgical Outcome of Epileptogenic Malformations of Cortical Development. MICCAI 2017:390–397.
- 59.Bernhardt BC, Chen Z, He Y, et al. Graph-theoretical analysis reveals disrupted small-world organization of cortical thickness correlation networks in temporal lobe epilepsy. Cereb Cortex 2011;21:2147–2157. [DOI] [PubMed] [Google Scholar]
- 60.Yasuda CL, Chen Z, Beltramini GC, et al. Aberrant topological patterns of brain structural network in temporal lobe epilepsy. Epilepsia 2015;56:1992–2002. [DOI] [PubMed] [Google Scholar]
- 61.Liu M, Chen Z, Beaulieu C, et al. Disrupted anatomic white matter network in left mesial temporal lobe epilepsy. Epilepsia 2014;55:674–682. [DOI] [PubMed] [Google Scholar]
- 62.Wang J, Qiu S, Xu Y, et al. Graph theoretical analysis reveals disrupted topological properties of whole brain functional networks in temporal lobe epilepsy. Clin Neurophysiol 2014. [DOI] [PubMed]
- 63.Bartolomei F, Bettus G, Stam CJ, et al. Interictal network properties in mesial temporal lobe epilepsy: a graph theoretical study from intracerebral recordings. Clin Neurophysiol 2013;124:2345–2353. [DOI] [PubMed] [Google Scholar]
- 64.van Diessen E, Zweiphenning WJ, Jansen FE, et al. Brain Network Organization in Focal Epilepsy: A Systematic Review and Meta-Analysis. PLoS One 2014;9:e114606. [DOI] [PMC free article] [PubMed] [Google Scholar]
- 65.Ponten SC, Bartolomei F, Stam CJ. Small-world networks and epilepsy: graph theoretical analysis of intracerebrally recorded mesial temporal lobe seizures. Clin Neurophysiol 2007;118:918–927. [DOI] [PubMed] [Google Scholar]
- 66.Khambhati AN, Davis KA, Oommen BS, et al. Dynamic Network Drivers of Seizure Generation, Propagation and Termination in Human Neocortical Epilepsy. PLoS Comput Biol 2015;11:e1004608. [DOI] [PMC free article] [PubMed] [Google Scholar]
- 67.Vaessen MJ, Braakman HM, Heerink JS, et al. Abnormal modular organization of functional networks in cognitively impaired children with frontal lobe epilepsy. Cereb Cortex 2013;23:1997–2006. [DOI] [PubMed] [Google Scholar]
- 68.Sethi M, Pedersen M, Jackson GD. Polymicrogyric Cortex may Predispose to Seizures via Abnormal Network Topology: An fMRI Connectomics Study. Epilepsia 2016;57:e64–68. [DOI] [PubMed] [Google Scholar]
- 69.Hong S, Bernhardt BC, Gill RS, et al. The spectrum of structural and functional network anomalies across the spectrum of malformations of cortical development. Brain 2017;140:2133–2143. [DOI] [PubMed] [Google Scholar]
- 70.Abdelnour F, Mueller S, Raj A. Relating Cortical Atrophy in Temporal Lobe Epilepsy with Graph Diffusion-Based Network Models. PLoS Comput Biol 2015;11:e1004564. [DOI] [PMC free article] [PubMed] [Google Scholar]
- 71.Adler S, Hong SJ, Liu M, et al. Topographic principles of cortical fluid-attenuated inversion recovery signal in temporal lobe epilepsy. Epilepsia 2018;59:627–635. [DOI] [PubMed] [Google Scholar]
- 72.Morgan VL, Sonmezturk HH, Gore JC, et al. Lateralization of temporal lobe epilepsy using resting functional magnetic resonance imaging connectivity of hippocampal networks. Epilepsia 2012;53:1628–1635. [DOI] [PMC free article] [PubMed] [Google Scholar]
- 73.Lee HW, Arora J, Papademetris X, et al. Altered functional connectivity in seizure onset zones revealed by fMRI intrinsic connectivity. Neurology 2014;83:2269–2277. [DOI] [PMC free article] [PubMed] [Google Scholar]
- 74.Besson P, Bandt SK, Proix T, et al. Anatomic consistencies across epilepsies: a stereotactic-EEG informed high-resolution structural connectivity study. Brain 2017;140:2639–2652. [DOI] [PubMed] [Google Scholar]
- 75.Bonilha L, Helpern JA, Sainju R, et al. Presurgical connectome and postsurgical seizure control in temporal lobe epilepsy. Neurology 2013;81:1704–1710. [DOI] [PMC free article] [PubMed] [Google Scholar]
- 76.Gleichgerrcht E, Munsell B, Bhatia S, et al. Deep learning applied to whole-brain connectome to determine seizure control after epilepsy surgery. Epilepsia 2018;59:1643–1654. [DOI] [PubMed] [Google Scholar]
- 77.He X, Doucet GE, Pustina D, et al. Presurgical thalamic “hubness” predicts surgical outcome in temporal lobe epilepsy. Neurology 2017;88:2285–2293. [DOI] [PMC free article] [PubMed] [Google Scholar]
- 78.Morgan VL, Englot DJ, Rogers BP, et al. Magnetic resonance imaging connectivity for the prediction of seizure outcome in temporal lobe epilepsy. Epilepsia 2017;58:1251–1260. [DOI] [PMC free article] [PubMed] [Google Scholar]
- 79.Vlooswijk MC, Jansen JF, Majoie HJ, et al. Functional connectivity and language impairment in cryptogenic localization-related epilepsy. Neurology 2010;75:395–402. [DOI] [PubMed] [Google Scholar]
- 80.McCormick C, Protzner AB, Barnett AJ, et al. Linking DMN connectivity to episodic memory capacity: what can we learn from patients with medial temporal lobe damage? Neuroimage Clin 2014;5:188–196. [DOI] [PMC free article] [PubMed] [Google Scholar]
- 81.He X, Bassett DS, Chaitanya G, et al. Disrupted dynamic network reconfiguration of the language system in temporal lobe epilepsy. Brain 2018;141:1375–1389. [DOI] [PMC free article] [PubMed] [Google Scholar]
- 82.Taylor PN, Sinha N, Wang Y, et al. The impact of epilepsy surgery on the structural connectome and its relation to outcome. Neuroimage Clin 2018;18:202–214. [DOI] [PMC free article] [PubMed] [Google Scholar]
- 83.Sidhu MK, Stretton J, Winston GP, et al. A functional magnetic resonance imaging study mapping the episodic memory encoding network in temporal lobe epilepsy. Brain 2013;136:1868–1888. [DOI] [PMC free article] [PubMed] [Google Scholar]
- 84.Bonelli SB, Thompson PJ, Yogarajah M, et al. Imaging language networks before and after anterior temporal lobe resection: results of a longitudinal fMRI study. Epilepsia 2012;53:639–650. [DOI] [PMC free article] [PubMed] [Google Scholar]
- 85.Yogarajah M, Focke NK, Bonelli SB, et al. The structural plasticity of white matter networks following anterior temporal lobe resection. Brain 2010;133:2348–2364. [DOI] [PMC free article] [PubMed] [Google Scholar]
- 86.Goubran M, Bernhardt BC, Cantor-Rivera D, et al. In vivo MRI signatures of hippocampal subfield pathology in intractable epilepsy. Hum Brain Mapp 2016;37:1103–1119. [DOI] [PMC free article] [PubMed] [Google Scholar]
- 87.Concha L, Livy DJ, Beaulieu C, et al. In vivo diffusion tensor imaging and histopathology of the fimbria-fornix in temporal lobe epilepsy. J Neurosci 2010;30:996–1002. [DOI] [PMC free article] [PubMed] [Google Scholar]
- 88.Deco G, Kringelbach ML, Jirsa VK, et al. The dynamics of resting fluctuations in the brain: metastability and its dynamical cortical core. Sci Rep 2017;7:3095. [DOI] [PMC free article] [PubMed] [Google Scholar]
- 89.Schirner M, McIntosh AR, Jirsa V, et al. Inferring multi-scale neural mechanisms with brain network modelling. Elife 2018;7. [DOI] [PMC free article] [PubMed]
- 90.Goodfellow M, Rummel C, Abela E, et al. Computer models to inform epilepsy surgery strategies: prediction of postoperative outcome. Brain 2017;140:e30. [DOI] [PMC free article] [PubMed] [Google Scholar]
- 91.Proix T, Bartolomei F, Guye M, et al. Individual brain structure and modelling predict seizure propagation. Brain 2017;140:641–654. [DOI] [PMC free article] [PubMed] [Google Scholar]
- 92.Wandschneider B, Centeno M, Vollmar C, et al. Motor co-activation in siblings of patients with juvenile myoclonic epilepsy: an imaging endophenotype? Brain 2014;137:2469–2479. [DOI] [PMC free article] [PubMed] [Google Scholar]
- 93.Whelan CD, Altmann A, Botia JA, et al. Structural brain abnormalities in the common epilepsies assessed in a worldwide ENIGMA study. Brain 2018;141:391–408. [DOI] [PMC free article] [PubMed] [Google Scholar]
- 94.Hong SJ, Bernhardt B, Schrader D, et al. MRI-Based Lesion Profiling of Epileptogenic Cortical Malformations. Medical Image Computing and Computer-Assisted Intervention – MICCAI 2015;9350:501–509. [Google Scholar]
- 95.Liao W, Zhang Z, Pan Z, et al. Altered functional connectivity and small-world in mesial temporal lobe epilepsy. PLoS One 2010;5:e8525. [DOI] [PMC free article] [PubMed] [Google Scholar]
- 96.Pedersen M, Omidvarnia AH, Walz JM, et al. Increased segregation of brain networks in focal epilepsy: An fMRI graph theory finding. Neuroimage Clin 2015;8:536–542. [DOI] [PMC free article] [PubMed] [Google Scholar]