

SUMMARY
Serine is a substrate for nucleotides, NADPH and glutathione (GSH) synthesis. Previous studies in cancer cells and lymphocytes have shown that serine-dependent one-carbon units are necessary for nucleotide production to support proliferation. Presently, it is unknown whether serine metabolism impacts the function of non-proliferative cells, such as inflammatory macrophages. We find that in macrophages, serine is required for optimal lipopolysaccharide (LPS) induction of IL-1β mRNA expression, but not inflammasome activation. The mechanism involves a requirement for glycine, which is made from serine, to support macrophage glutathione (GSH) synthesis. Cell-permeable GSH, but not the one-carbon donor formate, rescues IL-1β mRNA expression. Pharmacological inhibition of de novo serine synthesis in vivo decreased LPS induction of IL-1β levels and improved survival in an LPS-driven model of sepsis in mice. Our study reveals that serine metabolism is necessary for GSH synthesis to support IL− 1β cytokine production.
eTOC:
Rodriguez et al. show that serine metabolism controls the inflammatory response in macrophages in vitro and in vivo. They demonstrate that serine metabolism is required for glutathione synthesis which is necessary for optimal IL-1β mRNA expression. Inhibition of de novo serine synthesis is protective in a mouse model of endotoxemia.
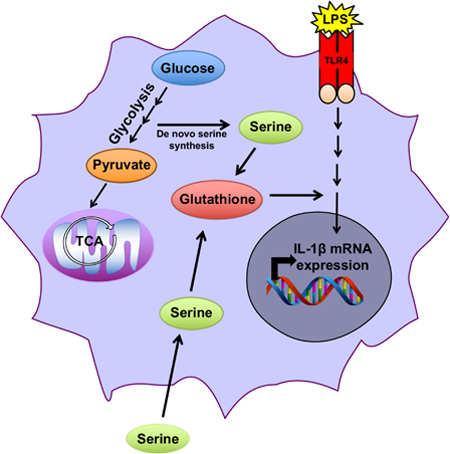
Graphical Abstract
INTRODUCTION
Macrophages exhibit a phenotypic plasticity that allows them to alter their function in response to diverse micro-environmental cues (Glass and Natoli, 2016). For example, macrophages initiate the early promotion of an immune response through the secretion of pro-inflammatory cytokines, as well as the resolution of inflammation after the insult. It is well established that changes in cellular metabolism are required for Toll-like receptor (TLR) driven pro-inflammatory cytokine production (Jha et al. 2015; O’Neil and Pearce, 2016; Langston et al., 2017; Mehta et al., 2017). Specifically, an increase in glycolytic flux is required for macrophages to produce inflammatory cytokines, including IL-1β, in response to TLR4-ligand lipopolysaccharide (LPS). Inhibition of glycolysis through treatment with 2-deoxyglucose (2-DG), a glycolytic inhibitor, results in a decrease in pro-inflammatory cytokine production (Tannahill et al., 2013; Mills et al.,2016). Furthermore, lL-10, an anti-inflammatory cytokine, has been shown to reduce inflammation by inhibiting LPS-induced glycolytic flux and suppressing mTOR activity (Ip et al.,2017). Most recently, it has been reported that inhibition of the pentose phosphate pathway, a branch off of glycolysis, decreases the inflammatory phenotype of macrophages in response to high cholesterol (Baardman et al. 2018). Combined, these studies suggest that glycolytic flux may regulate inflammatory cytokine production in pathological circumstances.
Mitochondrial function, including the turning of the TCA cycle and reactive oxygen species (ROS) generated by the electron transport chain, is also required for a robust LPS response in macrophages (Michelucci et al., 2013; Lampropoulou et al., 2016; Cordes et al., 2016; Mills et al. 2016). Multiple studies have demonstrated that macrophages increase their mitochondrial reactive oxygen species in response to LPS. When macrophages are treated with mitochondrial-targeted antioxidants such as MitoQ, the production of inflammatory cytokines is diminished (West et al., 2011; Kelly et al., 2015).
LPS also induces the accumulation of the metabolite itaconate to limit IL-1β production by inducing Irg1 (Cordes et al. 2016; Lampropoulou et al. 2016). Recent studies indicate that itaconate activates the transcription factor NRF2 and also directly binds glutathione (GSH) (Bambouskova et al., 2018). Furthermore, itaconate binds to IkBζ to decrease cytokine production in activated macrophages (Bambouskova et al., 2018). Furthermore, derivatives of itaconate such as dimethyl-itaconate or octyl-itaconate that are strong electrophiles limit pro- inflammatory cytokine production in vitro and in vivo (Bambouskova et al., 2018, Mills et al.,2018). Despite these well-described itaconate dependent metabolic changes that occur upon macrophage activation, it is not fully understood which metabolic pathways support GSH balance for optimal cytokine production.
Serine is a non-essential amino acid that is required for cellular proliferation. Serine supports one-carbon metabolism, a complex network of metabolic pathways that includes: synthesis of nucleotides, s-adenosyl-methionine (SAM), NADPH, and glutathione (GSH) (Yang and Vousden, 2016; Locasale, 2013). One-carbon metabolism is sustained by uptake of serine from the microenvironment or by de novo synthesis. During de novo synthesis, 3-phosphoglycerate is shunted out of the glycolytic pathway and converted to phosphohydroxypyruvate by phosphoglycerate dehydrogenase (PHGDH) in the first of a series of enzymatic reactions to ultimately generate serine. Subsequently, serine hydroxymethyltransferases (SHMT) 1 and 2 catalyze the reversible reaction of serine to glycine coupled with the generation of 5,10- methylene tetrahydrofolate (5,10-meTHF) from tetrahydrofolate (THF in the cytosol or mitochondria, respectively). 5,10-meTHF is used as a one-carbon donor in multiple reactions including nucleotide synthesis. Reduction of 5,10 meTHF to 5-methyl THF provides the substrate for the remethylation of homocysteine to methionine catalyzed by the cobalamin- dependent enzyme methionine synthase. Serine can contribute to the production of the tripeptide glutathione (GSH) through the generation of glycine, one of its component amino acids, via the SHMT reaction (Lu, S. 2009).
Recent studies have demonstrated that serine-dependent one-carbon metabolism is necessary for nucleotide synthesis to support both cancer and T cell proliferation (Labuschagne et al., 2014; Maddocks et al., 2017; Ma et al., 2017; Ron-Harel et al., 2016). One-carbon metabolism also contributes to redox balance in growing cancer cells through GSH synthesis and folate- dependent NADPH production (Ye et al., 2014; Fan et al., 2014; Ducker et al., 2016; Lewis et al., 2014). In cells with limited intrinsic glycine uptake capacity or poor access to environmental glycine, the SHMT reaction can also support glycine and thereby GSH synthesis (Ducker et al. 2017; Pikman et al. 2016). Presently, it is unknown whether serine-dependent one-carbon metabolism dictates cell fate or function in anabolic, non-proliferating cells such as inflammatory macrophages.
In the present study, we observed that serine deprivation diminished LPS induction of the pro- inflammatory cytokine IL-1β and GSH synthesis in murine peritoneal macrophages. Serine metabolism-dependent GSH synthesis was necessary for optimal LPS induction of IL-1β mRNA expression. Furthermore inhibition of PHGDH, the first step in de novo serine synthesis, decreased LPS induction of pro-inflammatory cytokine levels in mice and improved their survival in a LPS-driven model of sepsis. Our results indicate that serine metabolism supports LPS induction of pro-inflammatory cytokines by generating GSH to maintain cellular redox balance.
RESULTS AND DISCUSSION
Serine metabolism is required for LPS induction of IL-1β.
To determine whether serine metabolism is necessary for LPS induction of pro-inflammatory IL- 1β production, we exposed murine peritoneal macrophages to LPS for 4 hours in media depleted of serine. Serine deprivation did not alter the gross metabolic properties of the macrophages. Oxygen consumption rate and extracellular acidification (glycolytic flux) were unchanged (Figure 1A and 1B). Serine deprivation has previously been shown to decrease mitochondrial mass in HCT116 cells (Gao et al. 2018). Consistent with our OCR data, mitochondrial mass and NAD+/NADH ratio was unaffected by loss of serine in media (Supplemental Figure 1A and 1B). However, serine deprivation decreased mRNA expression of the pro-inflammatory cytokine iL-1β, but not the anti-inflammatory cytokine IL-10 upon LPS stimulation (Figure 1C and1D). Previous studies in cancer and T cells have demonstrated that the addition of formate to serine-depleted media rescues cellular proliferation (Ducker et al. 2016; Ma et al., 2017; Ron-Harel et al., 2016). Formate is a one-carbon metabolite used in the folate cycle, which can produce 10-formyl THf, a donor for purine nucleotide biosynthesis. Interestingly, in the absence of serine, formate did not rescue IL-1β mRNA expression (Figure 1A). Interferon and IRF signaling are ultimately required for LPS responses. (Honda and Taniguchi, 2006). Therefore, we also measured expression of interferon genes and interferon regulated factors (IRFs) upon LPS stimulation for 2 hours and found that type 1 interferons Ifnp and Ifna, as well as IRF1 and IRF7 were unaffected by serine deprivation (Supplementary Figure 1C). CEBPΔ gene expression, a key early transcriptional regulator of LPS induced inflammation (Medzhitov and Horng, 2009), was also unaffected by serine depletion (Supplementary Figure 1C).
Figure 1. Serine is necessary for optimal IL-1β gene expression.
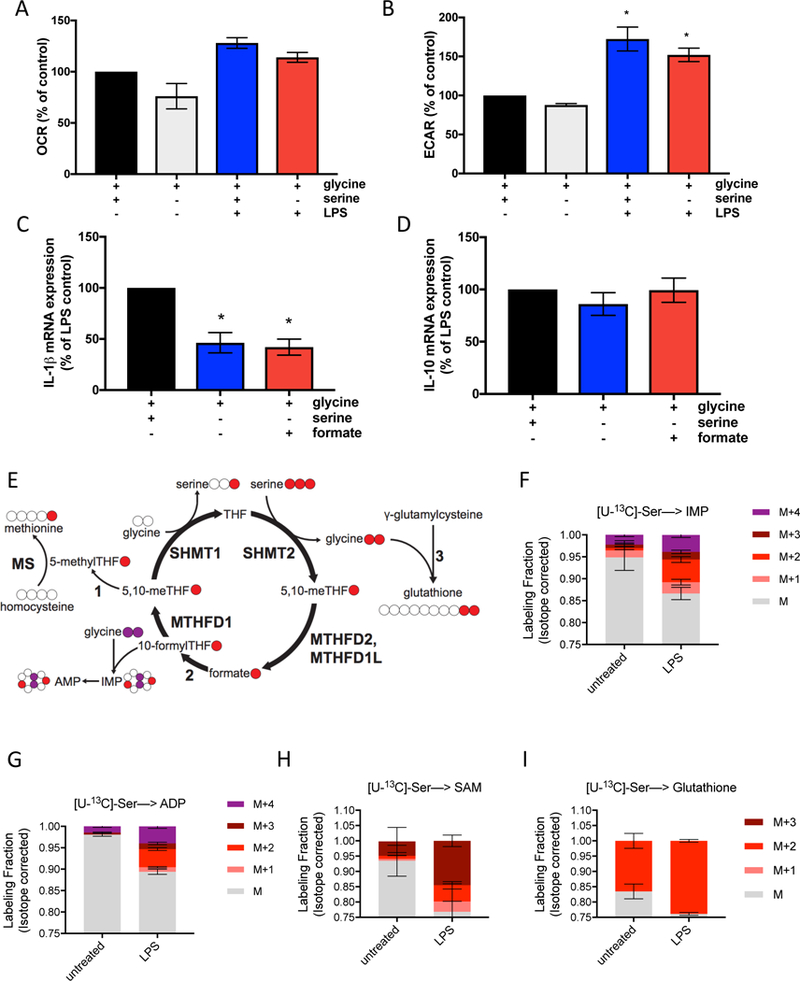
(A) Oxygen consumption rate (OCR) in peritoneal macrophages stimulated with 100ng/mL LPS for 4 hours with or without extracellular serine. Control is untreated macrophages. (n=3)
(B) Extracellular acidification rate (ECAR) in peritoneal macrophages stimulated with 100ng/mL LPS for 4 hours with or without serine. Control is untreated macrophages. (n=3)
(C) IL-1β and (D) IL-10 mRNA expression in peritoneal macrophages stimulated with 100ng/mL LPS for 4 hours with or without extracellular serine. (n=8)
(E) Schematic of U-[13C]-Serine labeling.
(F-I) U-[13C]-Serine labeling of IMP, ADP, SAM and GSH (n=3) in peritoneal macrophages after stimulation with 100ng/mL LPS for 4 hours.
For A-D, Peritoneal macrophages were cultured in media with or without 400μM serine, containing 400μM glycine, and supplemented with 1mM sodium formate where indicated.
Data are shown as mean ± SEM or ± SD (F-I). For A-D, p values were calculated using a paired one-way ANOVA compared to untreated cells or LPS stimulated cells, respectively. *p<0.05.
Next, to determine the fate of serine carbons upon LPS stimulation, we cultured murine peritoneal macrophages in media containing [U-13C]-serine (Figure 1E) or [2,3,3-2H]-serine (Supplemental Figure 1D). Serine-derived carbons were incorporated into the nucleotides IMP and ADP (Figure 1F and1G; Supplemental Figures 1E and 1F) in macrophages exposed to LPS. This one-carbon flux could also be observed in enhanced labeling of S-adenosyl- methionine (SAM) (Figure 1H). This labeling confirms that LPS stimulation up-regulates serine flux through folate one-carbon metabolism.
Finally, upon LPS stimulation an increased fraction of serine-derived carbons were incorporated into GSH (Figure 1I; Supplemental Figure 1G). GSH is synthesized from three components: cysteine, glutamate, and glycine. The m+2 labeling of glutathione indicates that serine contributes to glutathione synthesis through the production of glycine via the SHMT reaction. The inability of formate to rescue this phenotype suggests that it is not related to one-carbon units, but rather glycine. Since LPS stimulation increases ROS in macrophages to regulate cytokine production, enhanced flux through the glutathione synthesis pathway including serine derived glycine is likely needed to maintain GSH balance.
Serine incorporation into glutathione is required for the LPS induction of IL-1β.
To determine whether serine is required for optimal GSH synthesis upon LPS stimulation, we measured total levels of NEM-derivatized GSH and glutathione disulfide (GSSG), the oxidized form of glutathione, in the presence or absence of serine. Consistent with the known increase in ROS, LPS treatment increased oxidized glutathione (GSSG). Serine depletion decreased both GSH and GSSG levels in LPS stimulated macrophages (Figure 2A). To establish whether serine-derived GSH is required for the induction of IL-1β mRNA expression in response to LPS, we administered cell permeable GSH ethyl ester to LPS-stimulated murine peritoneal macrophages cultured in media depleted of serine. Cell permeable GSH increased intracellular GSH levels (Supplementary Figure 2A). Unlike formate, the one-carbon product of serine catabolism, cell-permeable GSH rescued LPS induction of IL-1β mRNA expression (Figure 2B). In contrast, IL-10 mRNA expression was unaffected by the presence of cell permeable GSH (Figure 2C). These results indicate that upon LPS stimulation, serine carbons are incorporated into GSH to maintain optimal mRNA induction of IL-1β.
Figure 2. Serine metabolism supports LPS induction of GSH synthesis, which is required for IL-1β gene expression.
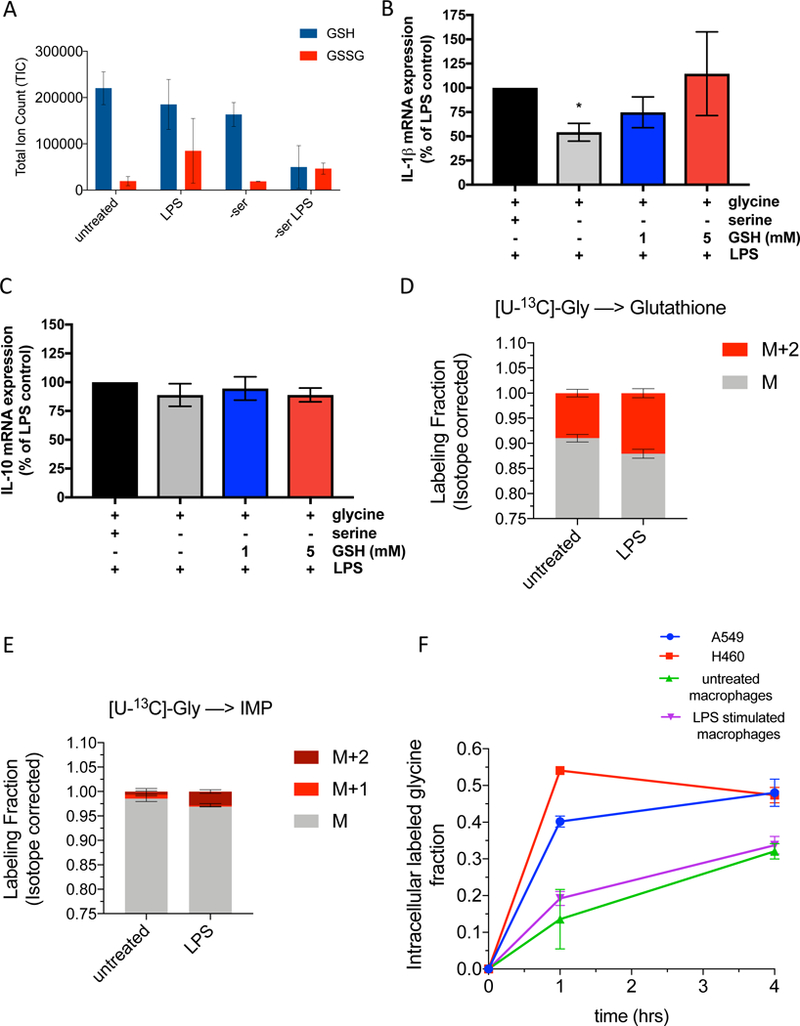
(A) Total ion counts of NEM derivitized GSH and GSSG in peritoneal macrophages (n=3).
(B) IL-1β and (C) IL-10 mRNA expression in peritoneal macrophages stimulated with 100ng/mL LPS for 4 hours in control or serine-depleted media, supplemented with 1 mM or 5mM cell permeable glutathione (GSH) reduced ethyl ester. Data is normalized to LPS treated macrophages with serine and glycine and without GSH (n=5).
(D) U-[13C]-Glycine labeling of GSH in peritoneal macrophages (n=3) at 4 hours post LPS treatment.
(E) U-[13C]-Glycine labeling of IMP in peritoneal macrophages (n=3) at 4 hours post LPS treatment.
(F) Glycine uptake over time as measured by the intracellular U-[13C]-Glycine fraction in A549 cells, H460 cells, and peritoneal macrophages untreated or stimulated with LPS for 4 hours.
Data are shown as mean ± SD (A, D-F) or ± SEM (B-C). For B-C, p values were calculated using a one-way paired ANOVA compared to LPS stimulated cells. *p<0.05.
Serine generates glycine, which is a component of GSH. Serine and glycine can be interconverted (Labuschagne et al., 2014). Serine deprivation decreased intracellular glycine levels (Supplemental Figure 2B). LPS stimulated murine peritoneal macrophages cultured in media containing [U-13C]-glycine revealed a marked attenuation of the incorporation of glycine- derived carbons compared to serine derived carbons into GSH and IMP (Figure 2D and2E). We hypothesized that glycine uptake may be limiting in macrophages. Indeed, glycine uptake was limiting in untreated and LPS stimulated macrophages compared to human lung cancer cell lines A549 and H460 (Figure 2F). Glycine lableling of serine was greater in H460 cells compared to untreated or LPS stimulated macrophages (Supplementary Figure 2C). Moreover, glycine depletion in serine containing media did not decrease IL-1β, IL-10 or TNFα mRNA expression (Supplementary Figure 2D-F). Collectively our results indicate that macrophages rely on intracellular serine-derived glycine to support glutathione synthesis.
It is important to note that the increase in GSH upon LPS stimulation that we observe occurs within the first few hours. This is in contrast to the itaconate-dependent increase in NRF2 mediated expression of antioxidants that occurs after expression of the first wave of LPS induced pro-inflammatory genes (Bambouskova et al., 2018, Mills et al., 2018). Itaconate is generated within mitochondria by IRG1 (Lampropoulou et al. 2016). LPS induces the IRG1 gene after the induction of IL-1β mRNA (Lampropoulou et al. 2016). We propose that in response to LPS, the increase in serine-dependent GSH synthesis is a fast non-transcriptional response to the increase in LPS driven ROS. In contrast, production of itaconate promotes a slower transcription-dependent up-regulation of NRF2 to increase GSH production.
Serine is required for the LPS induction of IL-1β mRNA expression, but not inflammation associated gene networks or inflammasome activation.
In order to determine whether serine is required in other macrophage cell types, we generated bone marrow derived macrophages (BMDMs) from C57Bl/6 mice and tested how serine deprivation affects global LPS gene expression. We assessed global mRNA levels of LPS- treated cells, with or without extracelluar serine using RNAseq. Serine deprivation increased only a small subset of genes in untreated BMDMs (Supplementary Figure 3A). BMDMs treated with LPS for 4 hours increased genes associated with the inflammatory response (Supplementary Figure 3B). However, serine deprivation in LPS-treated BMDMs significantly decreased a total of 20 genes (Figure 3A; Supplementary Figure 3C). Interestingly, Il1b, the gene for IL-1β mRNA was the most significantly down-regulated transcript (Figure 3A). Additionally, serine deprivation significantly increased 64 genes in LPS stimulated BMDMs (Figure 3B; Supplementary Figure 3C). We verified the decrease in IL-1β mRNA expression but did not observe a change in IL-10 or TNFα expression in LPS stimulated BMDMs deprived of serine (Figure 3C-E). LPS stimulation did not significantly change the mRNA expression of de novo serine synthesis enzymes PSAT or PHGDH, but markedly diminished cytosolic SHMT1 mRNA expression compared to SHMT2. (Supplementary Figure 3D-G). Additionally, we observed that when BMDMs were cultured in various concentrations of serine, there was no concentration dependent effect of extracelluar serine on IL-1β mRNA expression (Supplementary Figure 3H). These data suggest that serine metabolism is specifically required for IL-1β mRNA expression, but not for global inflammatory associated gene networks.
Figure 3. Serine deprivation diminishes IL-1β gene expression of BMDMs without altering inflammation-associated gene networks or inflammasome activation.
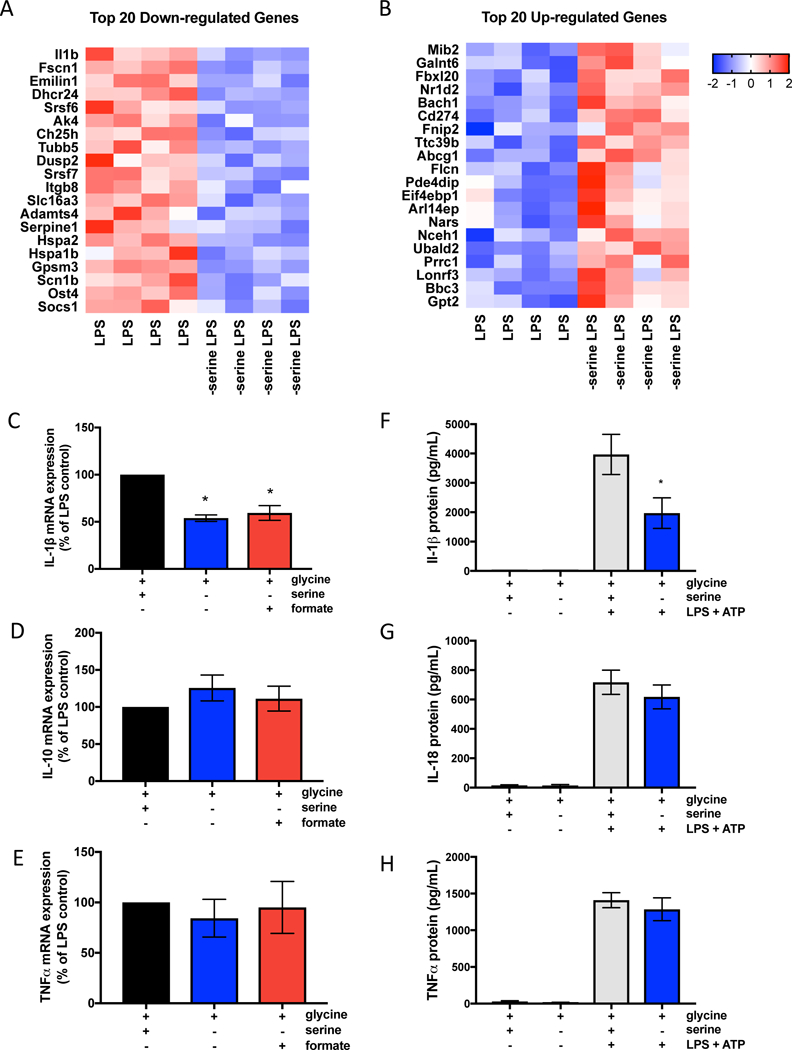
(A) Heat map of 20 down-regulated genes and (B) 20 up-regulated genes in serine deprived bone marrow derived macrophages (BMDMs) stimulated with 100ng/mL LPS for 4 hours with or without extracelluar serine.
(C) IL-1β, n=6 (D) IL-10, n=6 (E) TNFα, n=3 mRNA expression in BMDMs stimulated with 100ng/mL LPS for 4 hours with or without extracellular serine. Data is normalized to LPS treated macrophages with serine and glycine.
(F) Protein secretion of IL-1β, n=6 (G) IL-18, n=7 (H) TNFα, n=4 in BMDMs primed with 100ng/mL LPS for 6 hrs followed by 5mM ATP for 30mins.
For (A-B), BMDMs (n=4) were stimulated with 100ng/mL LPS for 4 hours in the presence or absence of serine. See tables for complete RNAseq list of up-regulated and down-regulated genes in serine deprived BMDMs stimulated with LPS compared to control BMDMs stimulated with LPS.
For C-H, BMDMs were cultured in media with 400μM glycine, with or without 400μM serine, and supplemented with 1mM sodium formate where indicated. Data are shown as mean ± SEM. p values were calculated using a one-way paired ANOVA compared to LPS stimulated cells. *p<0.05.
LPS stimulation of IL-1β production is tightly regulated at multiple steps beyond transcription. Notably, pro-IL-1β is cleaved into mature IL-1β by inflammasome dependent caspase-1 activation (Broz and Dixit, 2016). We tested whether serine deprivation decreases inflammasome activation by measuring caspase 1 activation and its substrates IL-1β and IL-18. Inflammasome activation results in cleavage of pro-caspase-1 to mature active caspase 1. Serine deprivation did not affect caspase-1 activation (Supplementary Figure 3I and 3J). Furthermore, serine deprivation decreased IL-1β, but not IL-18 protein production (Figure 3F, G). These results indicate that serine does not affect inflammasome activation. Thus, the decrease in LPS stimulation of IL-1β protein production is due to a decrease in IL-1β mRNA expression. LPS stimulation of TNFα protein production was not affected (Figure 3H). Previous studies have shown that buthionine sulphoximine (BSO) adminstration decreases IL-1β production in an endotoxemia model in rats (Wrotek et al. 2017). BSO is an inhibitor of glutamylcysteine synthetase, the rate-limiting step in GSH synthesis. Mito-paraquat (MPQ) generates superoxide within mitochondria (Robb et al. 2015). Indeed, BSO and MPQ both decrease IL-1β production in BMDMs indicating that diminishing GSH or increasing mitochondrial superoxide generation decreases IL-1β production (Supplementary Figure 3K). Collectively, our results indicate that serine deprivation diminishes IL-1β mRNA transcription, but not inflammasome activation.
De novo serine synthesis is required for IL-1β production in vivo.
Previous studies have shown that that 2-dexoxyglucose (2-DG), an inhibitor of glycolysis, decreases the LPS-induced production of the inflammatory cytokine IL-1β in vivo (Tanahill et al., 2013). 2-DG also promotes survival of mice exposed to LPS in a model of sepsis (Wang et al.,2016). It is not known why inhibiting glycolysis decreases IL-1β production and systemic inflammation. Due to our observations about the requirement for serine catabolism for LPS activation, we hypothesized that glycolysis supports IL-1β production in vivo by generating 3- phosphoglycerate, a precursor for de novo serine synthesis. PH-739–005N is a small-molecule inhibitor of PHGDH (provided by RAZE Pharmaceuticals). PH-739–005N potently blocks the de novo synthesis of serine as shown by the decrease in glucose carbon labeling into serine (EC50 ~200 nM) (Figure 4A). PH-755–003N (a next generation compound of PH-739–005N) prevented glucose cabon labeling into serine in LPS stimulated peritoneal macrophages (Supplementary Figure 4A). Interestingly, PH-755–003N did not affect LPS stimulated IL-1β or IL-10 mRNA expression in peritoneal macrophages grown in mouse plasma-like media made as described in Cantor et al. 2017 (Supplementary Figure 4B and 4C), indicating that extracellular serine levels dictate IL-1β mRNA expression in vitro. Additionally, in BMDMs treated with PH-755–003N, we also observed that LPS induced IL-1β and IL-10 mRNA expression was not diminished (Supplementary Figure 4D-E). In vivo, PH-755–003N diminished incorporation of carbon labeled glucose into plasma serine (Supplementary Figure 4F).
Figure 4. De novo serine synthesis is required for LPS responses in vivo.
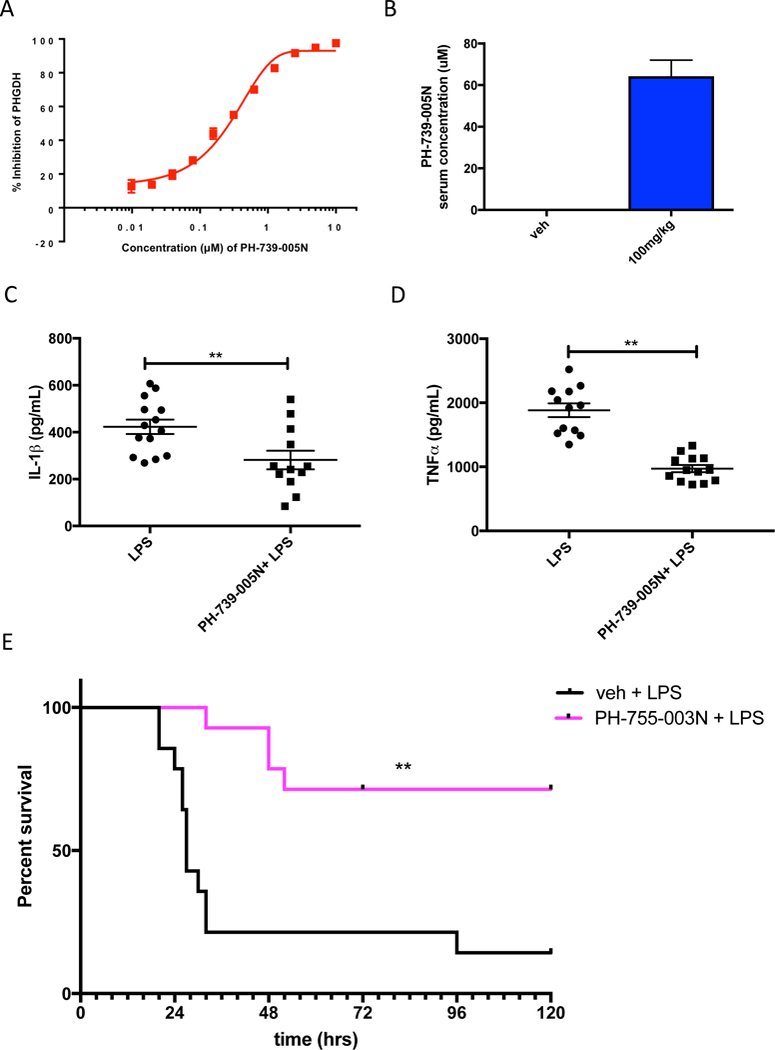
(A) Percent inhibition of PHGDH activity by the inhibitor PH-739–005N as measured by glucose incorporation into serine.
(B) Concentration of PH-739–005N in the serum of mice at 4.5 hours post i.p. injection with 100mg/kg PH-739–005N. Data are shown as mean ± SEM (n=12).
(C) IL-1β and (D) TNFα protein concentrations in serum of mice at 1.5 hours post-LPS administration. Mice were i.p. injected with 100mg/kg PH-739–005N for 3 hours followed by i.p. injection of LPS (15mg/kg) for 1.5 hrs.
(E) Survival curve of mice in a LPS-induced endotoxemia model. Mice were i.p. injected with 100mg/kg PH-755–003N and 3 hours later i.p. injected with 25mg/kg of LPS (n=14). Mice were again i.p. injected with 100mg/kg PH-755–003N 15 hours post-LPS administration.
For B-D, data are shown as mean ± SEM. p values were calculated using a two tailed Student’s t test. For E, data was analyzed using a Log Rank (Mantel-Cox) statistical test for survival (n=14). *p<0.05; **p<0.01.
To assess the requirement of de novo serine synthesis for LPS-induced cytokine production in vivo, C57Bl/6 mice were intra-peritoneally injected with 100mg/kg of PH-739–005N or PH-755– 003N three hours prior to an i.p. administration of a sub-lethal dose of LPS. Intra-peritoneal injection of PH-739–005N can achieve μM levels of the drug in the serum of mice (Figure 4B). PH-739–005N decreased LPS induction of IL-1β and TNFα cytokine levels in the serum of mice 1.5 hours post LPS stimulation (Figure 4C, D). Furthermore, inhibition of PHGDH promoted survival of mice upon LPS-induced endotoxemia (Figure 4E). Our results indicate that de novo synthesis of serine supports LPS induction of pro-inflammatory cytokine levels in vivo. The necessity of de novo serine synthesis for optimal IL-1β production in vivo versus in vitro likely reflects the differences in the in vivo microenvironment compared to cell culture conditions.
To date, numerous studies have shown that pro-inflammatory macrophages upregulate their glycolytic flux. However, it is still unknown why an increase in glycolytic flux is required for cytokine production. In vivo, we have demonstrated that de novo serine synthesis contributes to LPS responses. Since glycolytic intermediates are used for de novo serine synthesis, it is interesting to speculate that one of the reasons that LPS stimulated macrophages increase their glycolytic flux is for the purpose of generating de novo serine from 3-phosphoglycerate. This serine can then be used to make glycine for GSH synthesis, allowing cells to induce cytokine production and avoid cell death from oxidative stress. Further understanding the mechanisms of how serine controls LPS induction of the pro-inflammatory cytokine IL-1β could lead to the discovery of new links between metabolism and transcriptional changes, as well as potentially developing new therapeutic approaches of treating sepsis.
Limitations of the Study
Our data highlight the importance of serine metabolism on IL-1β cytokine production in vitro and in vivo. A key caveat of our study is that the decrease in IL-1β is dependent on extracellular serine in vitro while in vivo it is dependent on de novo serine synthesis. It remains unknown why monocytes require PHGDH dependent serine synthesis in vivo, even though serine and glycine are present in blood. Thus, the precise reason for the in vitro versus in vivo pathways of serine metabolism affecting IL-1β is not fully understood. Nevertheless, our data highlight an emerging theme in the metabolism field that in vitro and in vivo metabolism is different due to variances in the nutrient microenvironment.
EXPERIMENTAL MODEL AND SUBJECT DETAILS
Mice
C57BL/6J mice from Jackson labs were bred at Northwestern University. Mice were maintained at Northwestern University under specific pathogen-free conditions in accordance with Federal and University guidelines and protocols approved by IACUC and Northwestern University. Male and female mice were used at 8–12 weeks of age.
Peritoneal Macrophages Isolation and Cell Culture
Peritoneal macrophages were elicited using thioglycollate and isolated. C57BL/6J mice were injected with 3mL of sterile 3.8% thioglycollate medium (Sigma T9032) i.p. On day 3, mice were euthanized and peritoneal cells were collected via peritoneal lavage with 5mL cold PBS. Peritoneal lavage was spun down for 5mins at 300×g and re-suspended in 10mL serum-free RPMI (1640) media (ThermoScientific 11090–081), HEPES, penicillin, streptomycin, and glutamate. Cells were seeded in tissue culture plates at the desired cell density. After 45 minutes, cells were washed twice with 1X sterile PBS to remove non-adherent cells and cultured in our assay media (MEM (21090) supplemented with 10% dialyzed FBS (Gibco 26400), glutamine, 17mM D-glucose (Sigma), MEM vitamins (11120), penicillin-streptomycin and 400mM serine and glycine).
Peritoneal macrophages were treated with 100ng/mL O5:B55 ultrapure LPS (Invivogen). Peritoneal macrophages that were not subject to amino acid deprivation were cultured with 400μM serine and/or 400μM glycine. Peritoneal macrophages supplemented with sodium formate (Sigma 247596) were given 1mM formate. Peritoneal macrophages supplemented with cell permeable GSH (ethyl ester glutathione Sigma G1404) were given 1mM or 5mM cell permeable GSH. All supplementation was co-administered at the time of LPS treatment. Additionally, peritoneal macrophages were seeded in mouse plasma-like media that contained 95μM serine, 4.4mM glucose, and 217μM glycine (media based on the results from Cantor et al. 2017) while treated with the PHGDH inhibitor PH-755–003N (RAZE Therapeutics). Peritoneal macrophages were treated with PH-755–003N for 1 hour prior to stimulation with 100ng/mL LPS for 4 hours.
BMDM Isolation and cell culture
Bone marrow was isolated from C57BL/6J mice and subjected to red blood cell lysis with ACK lysis buffer prior to neutralization and resupsension in RPMI media. Cells were counted using a hemocytometer and plated in 10cm tissue culture plates at a density of 3-million cells/ plate. Cells were cultured with 20ng/mL mCSF to induce differentiation into BMDMs. Media was changed every 3 days and BMDMs were harvested by scraping on day 6 and plated in 24 well plates at a density of 800,000 cells/well. BMDMs were stimulated in the same manner as peritoneal macrophages.
METHODS DETAILS
qRT-PCR
RNA was extracted from peritoneal macrophages or BMDMs using the Omega E.Z.N.A. RNA Isolation Kit. RNA was quantified using a Nanodrop 2000 UV-visible spectrophotometer and 300ng of RNA was reverse transcribed using RETROscript first-strand synthesis kit (Ambion). Real-time PCR was performed on a BioRadCFX using iQ SYBR green Supermix (Bio-Rad).For qPCR of cytokine expression, the following primers were used: IL-1β (Fwd- TGGCAACTGTTCCTG Rev- GGAAGCAGCCCTTCATCTTT) TNFα (Fwd- GCCTCTTCTCATTCCTGCTT Rev- TGGGAACTTCTCATCCCTTTG) IL-10 (Fwd- AGGCGCTGTCATCGATTT Rev- CACCTTGGTCTTGGAGCTTAT) actin (Fwd- GGAGGGGGTTGAGGTGTT Rev- GTGTGCACTTTTATTGGTCTCAA) Ifnα (Fwd- CAACACCTACACAGGTTACC Rev- AGTGGCTTCCCAGATGTTCC) Ifnβ (Fwd- AGCT CCAAGAAAG GACGAACAT Rev- GCCCTGTAGGT GAGGTT GAT CT) Irf1 (Fwd- CAGAGGAAAGAGAGAAAGTCC Rev- CACACGGTGACAGTGCTGG) Irf7 (Fwd- CTGGAGCCATGGGTATGCA Rev- AAGCACAAGCCGAGACTGCT) C/EBPBΔ (Fwd- CCCCAAAGCTATGTGCCTTTC Rev- CCTGGAGGGTTTGTGTTTTCTG) Values were normalized to actin expression levels, and measurements were done in triplicate. Data were analyzed with LinRegPCR software. All expression changes are normalized to the untreated control.
For qPCR of serine metabolism, the following primers were used:
PSAT1 (Fwd- GCTTGGTTCTGGAGTGGATT Rev- GTCCCACCAGCTTTACAG) PHGDH (Fwd- AACTT CTT CCGCT CCCATTT Rev- GT CAT CAACGCAG CT GAGAA) SHMT1 (Fwd- AGGAAAGGAGTGAAAAGTGTGGAT Rev- GACACCAGTGTCGCTCTGGATCTG) SHMT2 (L primer- ATGCTGT ACTT CT CTTT GTTTT G G aL primer- AGT GAT CCT GAGATGTGGGGAGTT Rev- AGGATAACCCTCCGAGTACTTGTT). Values were normalized to actin expression levels, and measurements were done in triplicate. Fold change was determined by −2^ΔΔCt. All expression changes are normalized to the untreated control.
RNA-Seq Analysis
RNAseq analysis was done on BMDMs. BMDMs were cultured in complete MEM, MEM without serine, MEM with 100ng/mL LPS, MEM without serine but with 100ng/mL LPS. RNA was isolated 4 hrs post LPS. Total RNA was isolated using RNeasy Plus Mini Kit (Qiagen) following manufacturer’s protocol. RNA-seq library was prepared using NEBNext Ultra RNA Library Prep Kit from New England Biolabs. Libraries were pooled and sequenced on an Illumina Nextseq500 platform using the 75bp high output sequencing kit NextSeq 500/550 High Output Kit v2 (75 cycles) (Illu mina).
Raw fastq reads were trimmed to remove low quality base pairs using Trimmomatic-0.33 with the following parameters: SE -threads 20 -phred33 TRAILING:30 MINLEN:20. This made sure that all the reads had base pairs with Phred scores above 30 and a minimum length of 20. The reads were then aligned to the mouse genome mm10 using STAR with the following parameters: —runThreadN 20 —readFilesCommand zcat -c —outSAMtype BAM Unsorted — chimSegmentMin 20 —quantMode TranscriptomeSAM —outReadsUnmapped Fastq — outMultimapperOrder Random —outFilterMultimapNmax 20 —outFilterMismatchNmax 2. Aligned bam files were then sorted using samtools. Reads at exons were counted using htseq-count with the following parameters: -f bam -q -m intersection-nonempty -s no -t exon -i gene_id. Coverage tracks were generated using the R package Rsamtools and the coverage function. Finally, gene differential analysis was done using the EdgeR statistical package in R. Differentially expressed genes were called if they had an FDR < 0.01.
Oxygen Consumption rate, lactate production and NAD+/NADH ratio.
OCR and ECAR were measured in a XF96 extracellular flux analyzer (Seahorse Bioscience). Peritoneal macrophages were plated at 2.5×10⁵ cells/well of a XF96 plate, allowed to adhere for 45 minutes and washed 2 times with PBS. Cells were stimulated with LPS (100ng/mL) for 4 hours in the Seahorse plate, with or without serine. Culture media was removed from cells and replaced with Seahorse media (serine-free RPMI containing 1% dialyzed serum, and 2 mM glutamine, lacking bicarbonate and HEPES according to Seahorse Bioscience’s instructions). Where appropriate, seahorse media was supplemented with 400uM serine. Basal mitochondrial respiration was measured by subtracting the OCR values after treatment with 1 μM antimycin A and 1 μM piericidin A (Sigma) from OCR levels after addition of 11mM glucose. Glycolytic flux was calculated from the difference of ECAR values after glucose administration and treatment with 2-deoxyglucose (2-DG, 25 mM). Percent Basal ECAR and OCR were determined relative to basal readings of the untreated un-stimulated control OCR and ECAR. We measured NAD+/NADH ratio in peritoneal macrophages treated with or without LPS for 4 hours in the presence or absence of serine using the Promega NAD+/NADH Glo-Kit (G9071) according to the manufacterers instructions. Mitochondrial mass was measured in peritoneal macrophages treated with or without LPS for 4 hours in the presence or absence of serine. After treatment, cells were stained with 200nM Mitotracker Green (Thermofisher catalog M7514) and the mean fluorescence intensity was determined using FACS.
Serine/Glycine Labeling and GSH measurements
Peritoneal macrophages were isolated from multiple mice and seeded at the desired density. Cells were washed twice with PBS and stimulated with the following treatments: untreated, serine deprivation (-serine), 100ng/mL LPS, serine deprivation and 100ng/mL LPS (-serine LPS) for 4 hrs. For serine labeling experiments, MEM media was supplemented with 400μM [U-13C]- Serine, [U-13C]-Glycine or 2,3,3-D3 Serine (Cambridge Isotope Laboratories) instead of unlabeled serine or glycine (Sigma). For glucose labeling experiments, glucose-free MEM media supplemented with U-13C-glucose (4.4 mM final) was used. Absolute glycine concentrations were determined by introduction of a 1,2-D2 glycine internal standard during extraction. Labeled glycine uptake was measured over time in H460, A549, and peritoneal macrophages at 1 and 4 hours post LPS treatment. No LPS was given to H460 or A549 cells.
To isolate polar metabolites including amino acids and nucleotide triphosphates, cells were rinsed quickly with ice cold normal saline solution (0.9% NaCl) before they were suspended in cold 80:20 methanol:water, scraped and transferred to a clean microcentrifuge tube. Samples were immediately put on dry ice for 10 mins. Samples were spun down at 16000×g minutes at 4C. Supernatant was collected in a new microcentrifuge tube and flash frozen in liquid nitrogen.
To measure levels of GSH and GSSG, we performed NEM-derivitization. First, cells were rinsed quickly with ice cold normal saline solution (0.9% NaCl) before they were suspended in 40:40:20 methanol:acetonitrile:water with 0.1M Formic acid, scraped and transferred to a clean microcentrifuge tube. After samples were stored on dry ice for 5 minutes, 15% (w/v) NH4HCO3 in water was added. Next, 0.2 mM NEM solution was added and sampels were incubated on ice for 30 minutes. Samples were spun at 16000×g for 10 minutes at 4 °C. Supernatant was collected in a new microcentr ifuge tube. The supernatants were combined and dried under N2, and finally resuspended in 100 μL water per 106 cells.
Samples were analyzed by reversed-phase ion-pairing chromatography coupled with negative-mode electrospray-ionization high-resolution MS on a stand-alone Orbitrap (ThermoFisher Exactive) using the methods described in Lu et al., 2010. Peak intensities and isotope labeling was quantified using the MAVEN software suite. Isotope correction was performed following the method of Su et al., 2017.
Inflammasome activation
BMDMs were stimulated with O5:B55 LPS (Invivogen) for 6 hours with addition of 5mM ATP (Sigma) for 30 minutes to activate the inflammasome. Cell supernatant was collected and analysed by ELISA according to manufacturers instructions for IL-1β (R&D Duoset DY401–05, R&D Quantikine MLB00C), TNFα (R&D Quantikine MTA00B), and IL-18 ELISA (MBL 7625). Caspase-1 activation was by western blot analysis using the anti-caspase 1 from Adipogen (AG-20B-0042), and the control was anti-vinculin (Fisher NC1391571). Secondary antibodies were from LicCOR and the gel was imaged on LiCOR. Densitometry was determined using SoftMax pro software. The ratio of cleaved caspase to vinculin in serine-deprived cells was expessed as a percentage of the cleaved caspase-to-vinculin ratio in cells stimulated with serine-replete media.
Endotoxin-Induced Model of Sepsis
LPS induced sepsis model in mice was approved by Northwestern University Institutional Animal Care and Use Committee. C57/Bl6 mice (aged 10–12 weeks) were treated i.p. ± PH-739– 005N (100 mg/kg) or vehicle (0.5% methylcellulose 0.5% tween80 in PBS) for 3 hours prior to stimulation with ultrapure O5:B55 LPS from Invivogen (15 mg/kg) i.p. for 1.5 hours. Whole blood samples were harvested via retro-orbital bleed before mice were euthanized in a CO2 chamber. Cytokine production in serum from whole blood was measured using the Mouse IL-1β (MLB00C) and TNFα (MTA00B) Quantikine ELISAs from R&D. For survival studies, PH-755–003N (100 mg/kg) or vehicle (0.5% methylcellulose 0.5% tween80 in PBS) was administrated i.p. 3 hours pre and 15 hours-post administration of a lethal dose of 25mg/kg crude O5:B55 LPS (Sigma).
Supplementary Material
HIGHLIGHTS:
Serine deprivation diminishes LPS-induced IL-1β mRNA expression
LPS stimulates serine generation of glycine for glutathione synthesis
Glutathione is necessary to maintain LPS induction of IL-1β production
Inhibition of de novo serine synthesis promotes survival of mice exposed to LPS
Acknowledgements
This work was supported by the NIH (5P01AG049665, 5P01HL071643, 5T32HL076139–15) to N.S.C. and NIH (5DP1DK113643–03) to J.D.R. with support from the Ford Foundation to A.E.R. G.S.D is supported by a fellowship from the NCI (K99 CA215307). NSC is supported by 5P01HL071643 and 5P01AG049665. Flow cytometric analysis was supported by the Northwestern University Flow Cytometry Core Facility supported by Cancer Center Support Grant (NCI CA060553). Flow Cytometry Cell Sorting was performed on a BD FACSAria SORP system, purchased through the support of NIH 1S100D011996–01. We would like to thank Hiam Abdala-Valencia and Kiwon Nam for RNA sequencing. We thank Peng Gao in the metabolomics core within the Robert Lurie Comprehensive Cancer center for metabolomics analysis.
Footnotes
Declaration of Interests: A.E.R, L.B. S.E.W, and N.S.C have nothing to declare. J.D.R is a founder of Raze Therapeutics and Princeton University and has filed patents for inventions of J.D.R. and G.S.D. related to one-carbon metabolism. N.M., V.S., A.F., and M.M. are employees of Raze Therapeutics. M.M. is a consultant and shareholder of Raze Therapeutics.
A.F. is a founder, consultant and shareholder of Raze Therapeutics.
N.M. is a consultant and shareholder of Raze Therapeutics.
V.S. is a consultant and shareholder of Raze Therapeutics.
N.M is an inventor on applications WO2017156165A1, WO2017023894A1, WO2017156181A1 and WO2017156177A1 pertaining to PHGDH inhibitors and their uses.
QUANTIFICATION AND STATISTICAL ANALYSIS
Statistical analyses were performed in GraphPad Prism 6 software using statistical tests indicated for each experiment. Specific statistical tests done for experiments are listed under the corresponding figure.
DATA AND SOFTWARE AVAILABILITY
All data from this manuscript are available from the corresponding author upon request. RNA sequence data that support the findings of this study have been deposited in GEO with the accession code GSE125036.
CONTACT FOR REAGENT AND RESOURCE SHARING
The contact info for sharing reagents is Navdeep Chandel at the following email address nav@northwestern.edu
Publisher's Disclaimer: This is a PDF file of an unedited manuscript that has been accepted for publication. As a service to our customers we are providing this early version of the manuscript. The manuscript will undergo copyediting, typesetting, and review of the resulting proof before it is published in its final citable form. Please note that during the production process errors may be discovered which could affect the content, and all legal disclaimers that apply to the journal pertain.
REFERENCES
- Baardman J, Verberk S, Prange K, Weeghel M, Velden S, Ryan D, Wüst R, Neele A, Speijer D, Denis S, et al. (2018). A Defective Pentose Phosphate Pathway Reduces Inflammatory Macrophage Responses during Hypercholesterolemia. Cell Reports 25, 2044–2052.e5. [DOI] [PubMed] [Google Scholar]
- Bambouskova M, Gorvel L, Lampropoulou V, Sergushichev A, Loginicheva E, Johnson K, Korenfeld D, Mathyer M, Kim H, Huang L-H, et al. (2018). Electrophilic properties of itaconate and derivatives regulate the IkBζ-ATF3 inflammatory axis. Nature 556, 501–504. [DOI] [PMC free article] [PubMed] [Google Scholar]
- Broz P, and Dixit VM. (2016). Inflammasomes: mechanism of assembly, regulation and signalling. Nature Review Immunology, 16:407–20. [DOI] [PubMed] [Google Scholar]
- Cantor J, Abu-Remaileh M, Kanarek N, Freinkman E, Gao X, Louissaint A, Lewis C, and Sabatini D (2017). Physiologic Medium Rewires Cellular Metabolism and Reveals Uric Acid as an Endogenous Inhibitor of UMP Synthase. Cell 169, 258–272.e17. [DOI] [PMC free article] [PubMed] [Google Scholar]
- Cordes T, Wallace M, Michelucci A, Divakaruni A, Sapcariu S, Sousa C, Koseki H, Cabrales P, Murphy A, Hiller K, et al. (2016). Immunoresponsive Gene 1 and Itaconate Inhibit Succinate Dehydrogenase to Modulate Intracellular Succinate Levels. J Biol Chem 291, 14274–14284. [DOI] [PMC free article] [PubMed] [Google Scholar]
- Ducker GS, Chen L, Morscher RJ, Ghergurovich JM, Esposito M, Teng X, Kang Y, and Rabinowitz JD (2016). Reversal of Cytosolic One-Carbon Flux Compensates for Loss of the Mitochondrial Folate Pathway. Cell Metab 23, 1140–1153. [DOI] [PMC free article] [PubMed] [Google Scholar]
- Ducker G, Ghergurovich J, Mainolfi N, Suri V, Jeong S, Li S, Friedman A, Manfredi M, Gitai Z, Kim H, et al. (2017). Human SHMT inhibitors reveal defective glycine import as a targetable metabolic vulnerability of diffuse large B-cell lymphoma. Proc National Acad Sci 114, 11404–11409. [DOI] [PMC free article] [PubMed] [Google Scholar]
- Fan J, Ye J, Kamphorst J, Shlomi T, Thompson C, and Rabinowitz J (2014). Quantitative flux analysis reveals folate-dependent NADPH production. Nature 510, 298–302. [DOI] [PMC free article] [PubMed] [Google Scholar]
- Gao X, Lee K, Reid M, Sanderson S, Qiu C, Li S, Liu J, and Locasale J (2018). Serine Availability Influences Mitochondrial Dynamics and Function through Lipid Metabolism. Cell Reports 22, 3507–3520. [DOI] [PMC free article] [PubMed] [Google Scholar]
- Glass C, and Natoli G (2016). Molecular control of activation and priming in macrophages. Nat Immunol 17, 26–33. [DOI] [PMC free article] [PubMed] [Google Scholar]
- Honda K, and Taniguchi T (2006). IRFs: master regulators of signaling by Toll-like receptors and cytosolic pattern-recognition receptors. Nat Rev Immunol 6, nri1900. [DOI] [PubMed] [Google Scholar]
- Ip W, Hoshi N, Shouval D, Snapper S, and Medzhitov R (2017). Anti-inflammatory effect of IL-10 mediated by metabolic reprogramming of macrophages. Science 356, 513–519. [DOI] [PMC free article] [PubMed] [Google Scholar]
- Jha A, Huang S, Sergushichev A, Lampropoulou V, Ivanova Y, Loginicheva E, Chmielewski K, Stewart K, Ashall J, Everts B, et al. (2015). Network Integration of Parallel Metabolic and Transcriptional Data Reveals Metabolic Modules that Regulate Macrophage Polarization. Immunity 42, 419–430. [DOI] [PubMed] [Google Scholar]
- Kelly B, Tannahill G, Murphy M, and O’Neill L (2015). Metformin Inhibits the Production of Reactive Oxygen Species from NADH:Ubiquinone Oxidoreductase to Limit Induction of Interleukin-1β (IL-1β) and Boosts Interleukin-10 (IL-10) in Lipopolysaccharide (LPS)-activated Macrophages. J Biol Chem 290, 20348–20359. [DOI] [PMC free article] [PubMed] [Google Scholar]
- Labuschagne C, Broek N van den, Mackay G, Vousden K, and Maddocks O (2014). Serine, but Not Glycine, Supports One-Carbon Metabolism and Proliferation of Cancer Cells. Cell Reports [DOI] [PubMed] [Google Scholar]
- Lampropoulou V, Sergushichev A, Bambouskova M, Nair S, Vincent EE, Loginicheva E, Cervantes-Barragan L, Ma X, Huang SC-C, Griss T, et al. (2016). Itaconate Links Inhibition of Succinate Dehydrogenase with Macrophage Metabolic Remodeling and Regulation of Inflammation. Cell Metab 24, 158–166. [DOI] [PMC free article] [PubMed] [Google Scholar]
- Langston PK, Shibata M, Horng T (2017) Metabolism Supports Macrophage Activation. Frontiers in Immunology 8, 61. [DOI] [PMC free article] [PubMed] [Google Scholar]
- Lewis CA, Parker SJ, Fiske BP, McCloskey D, Gui DY, Green CR, Vokes NI, Feist AM, Vander Heiden MG, and Metallo CM (2014). Tracing Compartmentalized NADPH Metabolism in the Cytosol and Mitochondria of Mammalian Cells. Mol Cell 55, 253–263. [DOI] [PMC free article] [PubMed] [Google Scholar]
- Locasale JW (2013). Serine, glycine and one-carbon units: cancer metabolism in full circle. Nat. Rev. Cancer 13, 572–83. [DOI] [PMC free article] [PubMed] [Google Scholar]
- Lu S (2009). Regulation of glutathione synthesis. Molecular Aspects of Medicine 30, 42–59. [DOI] [PMC free article] [PubMed] [Google Scholar]
- Lu W, Clasquin M, Melamud E, Amador-Noguez D, Caudy A, and Rabinowitz J (2010). Metabolomic Analysis via Reversed-Phase Ion-Pairing Liquid Chromatography Coupled to a Stand Alone Orbitrap Mass Spectrometer. Analytical Chemistry 82, 3212–3221. [DOI] [PMC free article] [PubMed] [Google Scholar]
- Ma E, Bantug G, Griss T, Condotta S, Johnson R, Samborska B, Mainolfi N, Suri V, Guak H, Balmer M, et al. (2017). Serine Is an Essential Metabolite for Effector T Cell Expansion. Cell Metabolism 25, 345–357. [DOI] [PubMed] [Google Scholar]
- Maddocks O, Athineos D, Cheung E, Lee P, Zhang T, Broek N van den, Mackay G, Labuschagne C, Gay D, Kruiswijk F, et al. (2017). Modulating the therapeutic response of tumours to dietary serine and glycine starvation. Nature 544, 372–376. [DOI] [PubMed] [Google Scholar]
- Medzhitov R, and Horng T (2009). Transcriptional control of the inflammatory response. Nature Reviews Immunology 9, 692–703. [DOI] [PubMed] [Google Scholar]
- Mehta M, Weinberg S, and Chandel N (2017). Mitochondrial control of immunity: beyond ATP. Nat Rev Immunol 17, nri.2017.66. [DOI] [PubMed] [Google Scholar]
- Michelucci A, Cordes T, Ghelfi J, Pailot A, Reiling N, Goldmann O, Binz T, Wegner A, Tallam A, Rausell A, et al. (2013). Immune-responsive gene 1 protein links metabolism to immunity by catalyzing itaconic acid production. Proc National Acad Sci 110, 7820–7825. [DOI] [PMC free article] [PubMed] [Google Scholar]
- Mills EL, Kelly B, Logan A, Costa ASH, Varma M, Bryant CE, Tourlomousis P, Däbritz JHM, Gottlieb E, Latorre I, et al. (2016). Succinate Dehydrogenase Supports Metabolic Repurposing of Mitochondria to Drive Inflammatory Macrophages. Cell 167, 457–470.e13. [DOI] [PMC free article] [PubMed] [Google Scholar]
- Mills E, Ryan D, Prag H, Dikovskaya D, Menon D, Zaslona Z, Jedrychowski M, Costa A, Higgins M, Hams E, et al. (2018). Itaconate is an anti-inflammatory metabolite that activates Nrf2 via alkylation of KEAP1. Nature 556, 113. [DOI] [PMC free article] [PubMed] [Google Scholar]
- O’Neill L, and Pearce E (2016). Immunometabolism governs dendritic cell and macrophage function. J Exp Medicine 213, 15–23. [DOI] [PMC free article] [PubMed] [Google Scholar]
- Pikman Y, Puissant A, Alexe G, Furman A, Chen L, Frumm S, Ross L, Fenouille N, Bassil C, Lewis C, et al. (2016). Targeting MTHFD2 in acute myeloid leukemia. J Exp Medicine 213, 1285–1306. [DOI] [PMC free article] [PubMed] [Google Scholar]
- Robb E, Gawel J, Aksentijević D, Cochemé H, Stewart T, Shchepinova M, Qiang H, Prime T, Bright T, James A, et al. (2015). Selective superoxide generation within mitochondria by the targeted redox cycler MitoParaquat. Free Radical Bio Med 89, 883–894. [DOI] [PubMed] [Google Scholar]
- Ron-Harel N, Santos D, Ghergurovich J, Sage P, Reddy A, Lovitch S, Dephoure N, Satterstrom K, Sheffer M, Spinelli J, et al. (2016). Mitochondrial Biogenesis and Proteome Remodeling Promote One-Carbon Metabolism for T Cell Activation. Cell Metabolism 24, 104–117. [DOI] [PMC free article] [PubMed] [Google Scholar]
- Su X, Lu W, and Rabinowitz J (2017). Metabolite Spectral Accuracy on Orbitraps. Anal Chem. [DOI] [PMC free article] [PubMed] [Google Scholar]
- Tannahill Curtis, Adamik Palsson-McDermott, McGettrick Goel, Frezza Bernard, Kelly Foley, et al. (2013) Succinate is an inflammatory signal that induces IL-1beta through HIF-1alpha. Nature 496, 238–242. [DOI] [PMC free article] [PubMed] [Google Scholar]
- Wang A, Huen SC, Luan HH, Yu S, Zhang C, Gallezot J-D, Booth CJ, and Medzhitov R (2016). Opposing Effects of Fasting Metabolism on Tissue Tolerance in Bacterial and Viral Inflammation. Cell 166, 1512–1525.e12. [DOI] [PMC free article] [PubMed] [Google Scholar]
- West P, Brodsky I, Rahner C, Woo D, Erdjument-Bromage H, Tempst P, Walsh M, Choi Y, Shadel G, and Ghosh S (2011). TLR signalling augments macrophage bactericidal activity through mitochondrial ROS. Nature 472, 476–480. [DOI] [PMC free article] [PubMed] [Google Scholar]
- Wrotek S, Domagalski K, Jędrzejewski T, Dec E, and Kozak W (2017). Buthionine sulfoximine, a glutathione depletor, attenuates endotoxic fever and reduces IL-1β and IL-6 level in rats. Cytokine 90, 31–37. [DOI] [PubMed] [Google Scholar]
- Yang M & Vousden K Serine and one-carbon metabolism in cancer. Nature Reviews Cancer 16, 650–662 (2016). [DOI] [PubMed] [Google Scholar]
- Ye J, Fan J, Venneti S, Wan Y-W, Pawel B, Zhang J, Finley L, Lu C, Lindsten T, Cross J, et al. (2014). Serine Catabolism Regulates Mitochondrial Redox Control during Hypoxia. Cancer Discovery 4, 1406–1417. [DOI] [PMC free article] [PubMed] [Google Scholar]
Associated Data
This section collects any data citations, data availability statements, or supplementary materials included in this article.