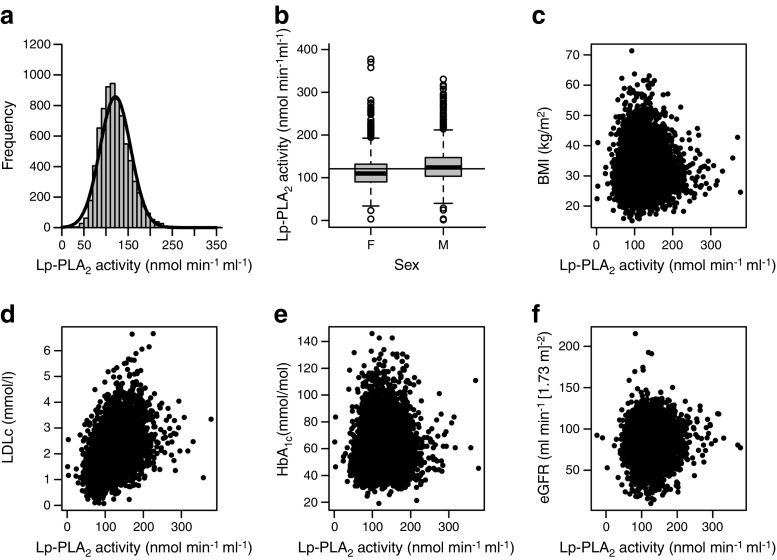
Fig. 1.
(a) Baseline distribution of Lp-PLA2 activity (nmol min−1 ml−1). (b) Distribution by sex (β = −0.12, p < 0.0001). (c) Correlation with BMI (kg/m2) (r = −0.02, p = 0.07). (d) Correlation with LDLc (mmol/l) (r = 0.44, p < 0.0001). (e) Correlation with HbA1c (mmol/mol) (r = 0.08, p = 0.0003). (f) Correlation with eGFR (ml min−1 [1.73 m]−2) (r = 0.03, p = 0.026). F, female; M, male

