

Abstract
We evaluated whether the excluded stomach (ES) after Roux-en-Y gastric bypass (RYGB) can represent a premalignant environment. Twenty obese women were prospectively submitted to double-balloon enteroscopy (DBE) with gastric juice and biopsy collection, before and 3 months after RYGB. We then evaluated morphological and molecular changes by combining endoscopic and histopathological analyses with an integrated untargeted metabolomics and transcriptomics multiplatform. Preoperatively, 16 women already presented with gastric histopathological alterations and an increased pH (≥4.0). These gastric abnormalities worsened after RYGB. A 90-fold increase in the concentration of bile acids was found in ES fluid, which also contained other metabolites commonly found in the intestinal environment, urine, and faeces. In addition, 135 genes were differentially expressed in ES tissue. Combined analysis of metabolic and gene expression data suggested that RYGB promoted activation of biological processes involved in local inflammation, bacteria overgrowth, and cell proliferation sustained by genes involved in carcinogenesis. Accumulated fluid in the ES appears to behave as a potential premalignant environment due to worsening inflammation and changing gene expression patterns that are favorable to the development of cancer. Considering that ES may remain for the rest of the patient’s life, long-term ES monitoring is therefore recommended for patients undergoing RYGB.
Introduction
Bariatric surgeries, such as Roux-en-Y gastric by-pass (RYGB), are increasingly being performed to aid weight loss and favor metabolic effects, particularly in obese patients with type 2 diabetes (T2D)1. RYGB reduces gastric volume by defining a small proximal gastric pouch and excluding the remaining stomach (which is known as the excluded stomach [ES]) from the gastrointestinal tract, thereby making it a hard-to-reach ‘blind loop’2. The bypassed ES, remains in the patient’s body for life.
ES may harbour duodenal bile reflux following RYGB, and its accumulation has been associated with gastritis, intestinal metaplasia, and some rare cases of cancer2–9. In this scenario, duodenal bile reflux can be related to cancer risk as persistent alkaline reflux is accepted as a cause of gastric stump cancer due to Billroth II sub-total gastrectomy8,9.
We have previously shown that duodenal reflux affects 40% to 70% of RYGB patients and the remaining and excluded gastric chambers can present with elevated bacteria and fungi counts postoperatively6. We have also shown that patients undergoing RYGB surgery, with predominantly normal gastric endoscopy, can develop moderate or severe gastritis, atrophy, and intestinal metaplasia in the ES5. It is then possible that the ES can harbor duodenal bile reflux following RYGB, favoring the excessive growth of microorganisms, tissue injury, and subsequent malignance9.
After more than a half-century since the development of the RYGB technique, some authors have shown concerns about the potential inherent risk of this procedure for the development of ES cancer, and have highlighted some cases of the disease which were observed during the postoperative period2,4–6,9. Accordingly, surgeons from different countries with high rates of gastric cancer, such as Japan, Korea, and Chile, have suggested RYGB with resection of the ES2,9. In the present paper, we aimed to provide additional scientific data for this little-known condition and evaluated the general and molecular behavior of ES tissue, and its environment, after RYGB and its potential association with cancer development. To do this, we combined endoscopic and histopathological analyses with an integrated untargeted metabolomics and transcriptomics multiplatform.
Methods
This study is part of the SURMetaGIT protocol10, registered at www.ClinicalTrials.gov (NCT01251016). The specific procedures involved were approved by the local institutional ethics board (Comissão de Ética para Análise de Projetos de Pesquisa - CAPPesq 1011/09) and were conducted according to the ethical standards of the World Medical Association’s Declaration of Helsinki.
Study subjects and interventions
After obtaining informed consent, we studied 20 obese (body mass index ≥35 kg/m2) adult women (age: 18–60 years), with T2D (fasting plasma glucose >126 mg/dL and hemoglobin A1c >6.5%) admitted for elective RYGB at the Gastrointestinal Surgery Division of the Hospital das Clinicas from University of Sao Paulo Medical School (HC-FMUSP). We recruited patients between 2011 and 2014. Patients were excluded if they suffered from type 1 diabetes, used insulin, had a Helicobacter pylori infection, suffered from thyroid or hepatic disease, or if they were currently participating, or had recently participated, on an interventional trial10.
All participants underwent RYGB, without silicon rings and with standardized biliary-pancreatic loops (50–60 cm) and feed handles (100–120 cm). Double-balloon enteroscopies were performed by an expert endoscopist (IR) before and 3 months after RYGB; these tests were carried out after 12-h fasting and 3–5 days abstinence from oral medications (except antihypertensive drugs). During the procedure, gastric macroscopic screening was carried out, with fluid reflux; local fluid and mucosal biopsies (10–15 mg) were also collected and frozen at −80 °C for subsequent untargeted metabolomic and transcriptomic analysis, respectively. A portion of the fluid was also used to measure pH, and a portion of the biopsies was formalin-fixed and embedded in paraffin for haematoxylin and eosin (H & E) staining and histopathological analysis. In each patient, the preoperative biopsy site was highlighted with India ink (SPOT; GI Supply, Camp Hill, PA) in order to ensure that postoperative collection occurred at the same location.
Histopathology of the excluded stomach
Macroscopic alterations of the stomach fundus (pre-operatively) and ES (post- operatively) were screened during enteroscopy, such as gastritis, mucous lake and the presence of polyps. Gastritis was classified according to the Sydney grading system criteria11. Biopsies were also assessed for microscopic inflammation, mucosal atrophy, glandular dilation and intestinal metaplasia by two independent pathologists. Alterations were graded as follows: 0 = none; 1 = slight; 2 = moderate; and 3 = intense.
Gastric fluid pH and metabolomic analysis
Samples of gastric fluid were thawed and homogenized for pH measurements, which involved gently dipping universal pH test strips (Merck, Darmstadt, Germany) into the fluid for colorimetric indication. Homogenized gastric fluid (200 µL) was pre-treated by protein precipitation with 600 µL cold methanol overnight (−20 °C). After centrifugation (15 min at 17,000 g and −4 °C), 250 µL supernatants were used as individual samples for metabolomic analyses. Quality control (QC) samples were prepared by mixing 200 µL of each supernatant; QCs were prepared by pooling equal volumes of all studied samples). A blank solution was prepared by using deionized water and the precipitation procedures described above. For liquid chromatography–mass spectrometry (LC-MS) analyses, samples were injected directly into the equipment, without any specific preparation. For gas chromatography–mass spectrometry (GC-MS) analyses, samples were evaporated to dryness and submitted to the derivatization protocol published previously by our group12.
LC-MS analyses (positive and negative modes) were performed on a Q Exactive Hybrid Quadrupole-Orbitrap Mass Spectrometer (Thermo Fisher Scientific, MA, U.S.A.) equipped with a nanoflow High Performance Liquid Chromatography system (Thermo Fisher Scientific, MA). GC-MS analyses were performed in a Gas Chromatography system coupled to a Single Quadrupole Mass Spectrometer (Agilent Technologies, CA, U.S.A.). Details of the specific methods and equipment parameters are presented in Supplementary Material S1.
Data processing was performed using XCMS software package (version 1.24.1). The parameters used for XCMS are described in Supplementary Material S1.
Transcriptomic analysis of ES tissue
Transcriptomic analysis was carried out using the SURMetaGIT protocol10. In brief, following RNA extraction (RNeasy Plus kit-Qiagen, Germantown, MD), ES biopsies with an RNA concentration ≥100 ng/µL, and RNA integrity number (RIN) ≥7, were submitted for global expression analysis using the Human GeneChip 1.0 ST Array (Affymetrix, Inc., Santa Clara, CA). Significance of microarrays and rank product methods were analysed to select differentially expressed genes, using p < 0.05 (corrected for false discovery rate). Target analysis was also performed by real time quantitative polymerase chain reaction (RT-qPCR) to validate certain genes of interest which are potentially involved in carcinogenesis. We did this by using TaqMan gene expression assays (Thermo Fisher Scientific, Waltam, MA). β-actin was used as a reference gene.
Statistical analysis
R software (version 3.1.3, 2015; R Core Team, Vienna, Austria) was used to report descriptive data as median (minimum–maximum). Pre- and postoperative data were compared using the nonparametric Mann–Whitney test.
For metabolomics data, we performed multivariate statistical analyses using Principal Component Analysis (PCA) and Partial Least Squares Discriminant Analysis (PLS- DA) models in SIMCA P+ software (12.0.1 version, Umetrics, CA, U.S.A.) and MetaboAnalyst 4.0, in which discriminant entities were selected according to Variable Importance Projection scores (VIP > 1). Univariate analyses were performed using the Mann–Whitney U test (p-value < 0.05), after checking data normality using Lilliefors test, performed in Statistica 13 software (StatSoft, OK, U.S.A.). Putative metabolites from LC-MS data were searched in the Human Metabolome Database, HMDB (http://www.hmdb.ca/), using [M + H]+, [2M + H]+ and [M + Na]+ adducts for positive ionization mode, and [M − H]− and [M − 2H]2− for negative mode. The metabolite identification for GC-MS data was performed using Fiehn RTL Library (Fiehn Lib) and the National Institute of Standards and Technology (NIST) database.
For tissue gene expression, the non-parametric Rank Products (RP) method was used to select Differentially Expressed Genes (DEGs), following a paired analysis design, p value < 0.05, and correction by False Discovery Rate (FDR). DEGs were analyzed using DAVID software (https://david.ncifcrf.gov) to identify biological processes and signal pathways potentially altered in ES and IPA (QIAGENInc; https://www.qiagenbioinformatics.com/products/ingenuitypathwayanakysis) to assess canonical pathways, networks and predictive regulatory networks13.
For all analyses, p-values < 0.05 were considered to be statistically significant. When a minimum sample was applied (n = 6 for gene expression; see Results section), the power of the study was >80% to detect differences in gene expression with an effect size ≥1.35-times the standard deviation (SD) of the difference.
Results
Sample descriptive data and flowchart
Main anthropometric and metabolic data are provided in Table 1. After 3 months of RYGB, all patients (mean age: 46.9 ± 6.2 years) experienced a significant reduction in body weight, body mass index (BMI), fasting blood glucose, and glycated haemoglobin values, as compared to the preoperative period.
Table 1.
Descriptive data of obese women (n = 20) before and three months after Roux en-Y gastric bypass (RYGB).
| Variables | Pre-operative | Postoperative | p-value* |
|---|---|---|---|
| Body weight (kg) | 113.2 (83.5–143.6) | 90.3 (68.2–113.7) | <0.001 |
| Body mass index (kg/m2) | 46.4 (37.1–7.5) | 38.5 (30.3–45.5) | <0.001 |
| Fasting glycaemia (mg/dL) | 221.1 (77.0–321.0) | 91.5 (75.0–153.0) | <0.001 |
| Glycated haemoglobin (%) | 9 (6–13) | 6 (5–7) | <0.001 |
Data are expressed as median (minimum-maximum). *Mann–Whitney test.
Some surgical anatomical changes (intracavitary adhesions, fixed angulations, stomach stenosis, and extrinsic compression), along with increased peristalsis after intravenous sedation, precluded use of the enteroscopic device in the ES of 10 patients postoperatively. Furthermore, biopsy collection could not be safely performed in 4 of these 10 patients. Due to these complications, data from all samples (n = 20) were evaluated for macro and micro histological changes preoperatively. In order for each woman to serve as her own control, pH and molecular analyzes were performed only in those patients providing pre- and postoperative matching samples of ES juice obtained by successful enteroscopy (pH and metabolomics; n = 10) and those for which tissue had been successfully obtained by biopsy (transcriptomics; n = 6). Only 3 pre- and postoperative matching biopsies provided adequate RNA for microarray analysis, but target validation of gene expression was performed in all 6 samples. Supplementary Fig. S1 illustrates a flowchart of sample size for each of the studied variables.
Macroscopic findings in the gastric tissue
At the macroscopic level, only 30% and 20% of patients presented with normal gastric mucosa pre- and postoperatively, respectively. Most patients (65%) already presented with gastritis preoperatively, including some with pangastritis (Table 2). Postoperatively, the incidence of gastritis remained high (80%) and progressed in intensity, with an almost 5-fold increased frequency of pangastritis. Furthermore, one case of intestinal metaplasia was observed and all patients presented with a green mucous fluid lake (Table 2).
Table 2.
Macroscopic gastric histology and duodenal reflux of obese women before and 3 months after Roux en-Y gastric bypass.
| Variable | Preoperative (n = 20) | Postoperative (n = 10) | ||
|---|---|---|---|---|
| n | % | n | % | |
| Enanthematous gastritis | 5 | 25 | 0 | 0 |
| Erosive gastritis** | 5 | 25 | 1 | 10 |
| Atrophic gastritis | 0 | 0 | 1 | 10 |
| Enanthematous pangastritis* | 3 | 15 | 7 | 70 |
| Enanthematous pangastroduodenitis* | 0 | 0 | 1 | 10 |
| Presence of polyps | 1 | 5 | 1 | 10 |
| Intestinal metaplasia | 0 | 0 | 1 | 10 |
| Mucous green lake♯ | 0 | 0 | 10 | 100 |
Data expressed as number of patients. *Mild/Moderate; **High and flat; ♯Indicator of duodenal reflux.
Gastric fluid pH and metabolite profile
Eighty percent of patients (n = 10) presented with alkaline gastric fluid (pH ≥ 4.0) preoperatively (Supplementary Table S1) with a distinct global metabolomics profile when compared between pre- and postoperative periods, as showed by both PCA (Supplementary Fig. S2) and PLS-DA (Fig. 1) models. These distinct molecular patterns were more visible with GC-MS and LC-MS in positive mode platforms. Those metabolites with a higher contribution for group separation (periods) by PLS-DA are identified and highlighted in Fig. 2.
Figure 1.

Partial Least Square Discriminant Analysis (PLS-DA) of the metabolomic profile of gastric fluid from the ES of obese women before and 3 months after RYGB. Analysis was performed in 10 patients using (A) GC-MS acquisition, (B) LC-MS positive mode acquisition, and (C) LC-MS negative mode acquisition. Pre, preoperative time point; Pos, 3-month postoperative time point.
Figure 2.

Metabolites that showed a higher contribution for separation in the metabolomics profile of gastric fluid from the ES of obese women between the periods before and 3 months after RYGB. Analysis was performed in 10 patients by using (A) GC-MS acquisition, (B) LC-MS positive mode acquisition, and (C) LC-MS negative mode acquisition. Unknown identities are represented as mass retention time. Identities known: 365, glucuronic acid. 1379, phosphoric acid. 1461, sucrose. 373, mannose. 496/794, docosapentanoyl carnitine. 520/776, LysoPC(18:2). 524/834, LysoPC(18:0). 514/702, taurocholic acid. 464/678, glycocholic acid. 482/819, litocholytaurine. Pre, preoperative time point; Pos, 3-month postoperative time point.
Based on the exact mass, retention time, and isotopic distribution, we identified 90 metabolites with different alterations between the pre- and postoperative period. Some of these included those participating in bile acid metabolism, phosphatidic acid cycle, and toxic metabolite conjugation; metabolites found in the urine and faeces; microbial metabolites; inflammatory mediators; and endocannabinoids (Table 3). Enriched metabolic pathways are shown in Supplementary Fig. S3.
Table 3.
Metabolites undergoing significant changes in the gastric fluid of obese women 3 months after Roux en-Y gastric bypass.
| Mass | Retention Time (min) | Metabolite | Fold Change | Biological Identities | Analytical Technique |
|---|---|---|---|---|---|
| 408.2875 | 11.67 | Trihidroxycholanoic acid/Allocholic acid/Cholic acid | 51.3 | Primary bile acid synthesis | LC-MS neg |
| 374.2820 | 12.20 | Hydroxycholenoate | 7.87 | LC-MS pos | |
| 515.2916 | 11.48 | Taurohyocholate/taurocholic acid/taurallocholic acid | 1.82 | LC-MS pos | |
| 11.71 | 1.61 | LC-MS neg | |||
| 532.3069 | 12.34 | 5b-Cyprinol sulphate | 3.89 | Bile alcohol | LC-MS neg |
| 465.3090 | 11.30 | Glycocholic acid | 2.73 | Primary bile acid | LC-MS pos |
| 11.31 | 1.24 | LC-MS neg | |||
| 449.3141 | 11.81 | Chenodeoxycholic glycine conjugate/Glycoursodeoxycholic acid | 3.07 | Primary or secondary bile acid | LC-MS pos |
| 433.3192 | 12.25 | Lithocholic acid glycine conjugate | 6.17 | Secondary bile acid | LC-MS pos |
| 12.26 | 1.94 | LC-MS neg | |||
| 483.3018 | 13.64 | Lithocholytaurine | 2.45 | LC-MS neg | |
| 499.2967 | 12.41 | Tauroursodeoxycholic acid | 2.80 | LC-MS neg | |
| 390.2770 | 14.29 | Hydroxyoxocholanoate (ketholithocolic acid) | 0.54 | LC-MS pos | |
| 529.2709 | 11.16 | Glycochenodeoxycholic acid 3-sulfate | 2.63 | Sulphate bile acid | LC-MS neg |
| 563.2586 | 12.67 | Taurolithocholic acid 3-sulfate | 1.46 | LC-MS neg | |
| 304.2402 | 13.72 | Arachidonic acid | 1.67 2.04 |
Inflammatory mediators | LC-MS pos LC-MS neg |
| 481.3168 | 12.92 | LysoPC(15:0) | 7.73 | LC-MS pos | |
| 493.3168 | 12.74 | LysoPC(16:1) | 8.04 | LC-MS pos | |
| 495.3324 | 13.23 | LysoPC(16:0) | 2.24 | LC-MS pos | |
| 509.3481 | 13.55 | LysoPC(17:0) | 7.16 | LC-MS pos | |
| 517.3168 | 12.55 | LysoPC(18:3) | 15.4 | LC-MS pos | |
| 519.3324 521.3481 |
12.93 13.42 |
LysoPC(18:2) LysoPC(18:1) |
7.63 3.88 |
LC-MS pos | |
| LC-MS pos | |||||
| 523.3637 | 13.91 | LysoPC(18:0) | 3.12 | LC-MS pos | |
| 541.3168 | 12.51 | LysoPC(20:5) | 25.8 | LC-MS pos | |
| 547.3637 | 13.00 | LysoPC(20:2) | 20.4 | LC-MS pos | |
| 567.3324 | 12.83 | LysoPC(22:6) | 12.6 | LC-MS pos | |
| 392.2327 | 16.12 | Phosphatidic acid (16:0) | 2.12 | Turnover membrane and Phosphatidic acid cycle | LC-MS pos |
| 17.54 | 1.68 | LC-MS neg | |||
| 416.2327 | 16.69 | Phosphatidic acid (18:2) | 10.1 | LC-MS neg | |
| 180.0633 | 18.89 | myo-inositol | 1.88 | GC-MS | |
| 572.2961 | 16.37 | 1-Palmitoylglycerophosphoinositol | 0.81 | LC-MS neg | |
| 600.3274 | 18.58 | Stearoylglycerophosphoinositol | 0.81 | LC-MS neg | |
| 620.2961 | 8.59 | Arachidonoylglycerophosphoinositol | 0.02 | LC-MS neg | |
| 686.4910 | 8.91 | DG(20:5n3/0:0/22:6n3) | 0.42 | LC-MS neg | |
| 714.5223 | 9.19 | DG(20:5n6/0:0/22:6n3) | 0.47 | LC-MS neg | |
| 327.3137 | 12.22 | Stearoylethanolamide | 2.85 | Endocannabinoid | LC-MS pos |
| 194.0426 | 16.89 | Glucuronic acid | 0.02 | Toxic metabolite conjugation | GC-MS |
| 132.0575 | 6.82 | Atropaldehyde | 5.50 | Drug metabolite (found in the urine) | LC-MS neg |
| 433.2100 | 8.68 | Dextrorphan O-glucuronide | 2.76 | LC-MS neg | |
| 551.2519 | 12.14 | Endoxifen O-glucuronide | 1.16 | LC-MS neg | |
| 440.2344 | 13.70 | Tirofiban | 1.13 | LC-MS neg | |
| 592.3260 | 9.53 | Mesobilirubinogen | 5.61 | Bilirubin catabolism (found in the urine and faeces) | LC-MS pos |
| 594.3417 | 9.57 | L-Stercobilin | 4.69 | LC-MS pos | |
| 466.3116 | 11.29 | Cholesterol sulphate | 3.73 | Steroid biosynthesis (found in the urine) | LC-MS pos |
| 11.30 | 1.24 | LC-MS neg | |||
| 318.2558 | 14.38 | Pregnanolone | 14.6 | LC-MS pos | |
| 320.2715 | 14.78 | Pregnanediol | 47.9 | LC-MS pos | |
| 464.2410 | 14.30 | Dehydroepiandrosterone 3-glucuronide | 0.27 | LC-MS pos | |
| 164.0684 | 15.21 | Fucose | 0.15 | Microbial metabolites: fermentation of non-digestible polysaccharides and proteins (SCFAs) | GC-MS |
| 150.0528 | 14.66 | Ribose/Lyxose (pentose monosaccharide) | 0.13 | GC-MS | |
| 152.0684 | 15.14 | Arabitol/Ribitol/Xylitol (sugar alcohol) | 0.17 | GC-MS | |
| 270.2558 | 16.97 | C16 methyl palmitate | 3.71 | GC-MS | |
| 298.2871 | 18.88 | C18 methyl stearate | 1.88 | GC-MS | |
| 161.0840 | 13.14 | Tryptophanol | 4.79 | LC-MS pos | |
| 214.1317 | 1.81 | Dethiobiotin | 8.53 | Microbial metabolites: vitamin synthesis | LC-MS pos |
| 278.1266 | 5.35 | N1-(alpha-D-ribosyl)-5,6-Dimethyl-benzimidazole | 3.02 | LC-MS pos | |
| 246.1215 | 1.97 | L-beta-Aspartyl-l-leucine | 1.26 | Microbial metabolites: cholesterol synthesis | LC-MS neg |
| 414.3497 | 11.79 | Hydroxymethyl-cholestadienol | 18.6 | LC-MS pos | |
| 384.3392 | 16.57 | Cholesterol synthesis intermediates | 10.3 | LC -MS pos | |
| Warburg effect | |||||
| 175.0956 | 17.28 | Citrulline | 2.14 | Nitric oxide synthesis | GC-MS |
| 180.0633 | 16.93 | Mannose/Glucose/Allose (aldohexose) | 0.95 | Glycolysis | GC-MS |
| 157.0738 | 11.71 | Methylcrotonylglycine | 3.54 | Mitochondrial damage | LC-MS pos |
| 385.2828 | 11.07 | Hydroxytetradecenoyl-L-carnitine | 10.9 | Acylcarnitines | LC-MS pos |
| 421.3192 | 11.45 | Linolenylcarnitine | 2.94 | LC-MS pos | |
| 423.3348 | 11.92 | Acylcarnitine C18:2 | 9.08 | LC-MS pos | |
| 425.3505 | 12.18 | Acylcarnitine C18:1 | 9.24 | LC-MS pos | |
| 275.1368 | 8.24 | Glutaryl-L-carnitine | 1.13 | LC-MS neg | |
| 285.1940 | 9.04 | Octenoyl-L-carnitine | 4.90 | LC-MS pos | |
| 287.2096 | 9.71 | Octanoyl-L-carnitine | 3.95 | LC-MS pos | |
| 313.2253 | 10.22 | 9-Decenoylcarnitine | 6.83 | LC-MS pos | |
| 315.2409 | 10.60 | Decanoyl-L-carnitine | 7.86 | LC-MS pos | |
| 341.2566 | 10.90 | Dodecenoyl-L-carnitine | 5.07 | LC-MS pos | |
| 471.3348 | 12.76 | Cervonylcarnitine | 8.04 | LC-MS pos | |
| 473.3505 | 13.23 | Docosapentaenoylcarnitine/Clupadonylcarnitine | 2.22 | LC-MS pos | |
| 256.2402 | 18.14 | Palmitic acid | 28.0 | Fatty acid synthesis and uptake | GC-MS |
| 282.2558 | 19.71 | Oleic acid | 11.4 | GC-MS | |
| 280.2402 | 19.67 | Linoleic acid | 11.3 | GC-MS | |
| 13.76 | 1.54 | LC-MS neg | |||
| 97.9768 | 9.49 | Phosphoric acid | 36.3 | Membrane phospholipid synthesis | GC-MS |
| 188.1160 | 4.76 | N-acetyl-lysine | 3.08 | Active gene transcription process (hystone acetylation) | LC-MS pos |
Metabolites were identified by GC-MS and LC-MS (VIP score > 1, and p-value < 0.05). LysoPC, lysophosphatidylcholine; DG, diacylglycerol.
Microscopic histology and transcriptomics in the gastric tissue
At the microscopic level, representative histopathological findings included gastritis, atrophic gastritis, glandular dilatation, and intestinal metaplasia (Fig. 3). Prior to RYGB, most patients already showed some grade of inflammation and mucosal atrophy with gastritis (Table 4). We also observed glandular dilatation and intestinal metaplasia foci (Table 4). Following surgery, inflammation and mucosal atrophy remained the most frequent histological change (Table 4), but the intensity of these alterations increased among patients with pre- and postoperative matching biopsies and one patient progressed with new intestinal metaplasia (Table 5).
Figure 3.

Representative histological findings in the ES of obese women before and 3 months after RYGB. (A) gastritis; (B) atrophic gastritis; (C) glandular dilatation; (D) intestinal metaplasia.
Table 4.
Gastric microscopic histopathology of obese women before and 3 months after Roux en-Y gastric bypass.
| Variable | Preoperative (n = 20) | Postoperative (n = 6) | ||
|---|---|---|---|---|
| n | % | n | % | |
| Inflammation | 18 | 90 | 6 | 100 |
| Atrophy | 13 | 65 | 5 | 83 |
| Glandular dilation | 8 | 40 | 4 | 67 |
| Intestinal metaplasia | 2 | 10 | 1 | 17 |
Table 5.
Evolution of the altered gastric histology grade of obese women, before and 3 months after Roux en-Y gastric bypass.
| Patient’ code | Inflammation | Atrophy | Glandular dilatation | Intestinal metaplasia | ||||
|---|---|---|---|---|---|---|---|---|
| T0 | T1 | T0 | T1 | T0 | T1 | T0 | T1 | |
| A | 1 | 2 | 1 | 2 | 1 | 2 | 0 | 1 |
| B | 0 | 1 | 0 | 2 | 1 | 2 | 0 | 0 |
| C | 1 | 2 | 0 | 1 | 0 | 0 | 0 | 0 |
| D | 2 | 3 | 1 | 1 | 0 | 0 | 0 | 0 |
| E | 2 | 2 | 2 | 3 | 2 | 2 | 0 | 0 |
| F | 1 | 1 | 0 | 0 | 0 | 1 | 0 | 0 |
Bold numbers highlight the evolution in degree of inflammation, atrophy, glandular dilation and intestinal metaplasia 3 months after the surgery (T1), compared to the preoperative period (T0). 0, absent; 1, slight grade; 2, moderate grade; 3, intense grade.
Global microarray analysis identified 135 differentially expressed genes (DEGs) after RYGB (38 upregulated genes and 97 downregulated genes; p < 0.05). Based on these, functional enrichment, using the DAVID software internal data base, identified processes involved in inflammation and immune response to microorganisms as the main biological pathways increased in ES tissue after RYGB, representing 50% of the changes induced by surgery (Table 6). Processes involved in increased cell proliferation and histone acetylation, necrosis, and apoptosis, together with those related to cell metabolism changes, represented 20% of the local postoperative metabolic alterations (Table 6).
Table 6.
More prominent biological processes in the ES tissue after RYGB, according to the DAVID database.
| Biological process | Count | % | p value | Benjamini |
|---|---|---|---|---|
| Imune response | 9 | 10,1 | 4,3E-4 | 2,3E-1 |
| Chemotaxis | 5 | 5,6 | 1,9E-3 | 4,4E-1 |
| Chemokine-mediated signaling pathway | 4 | 4,5 | 3,5E-3 | 5,1E-1 |
| Cell-cell signaling | 6 | 6,7 | 4,7E-3 | 5,1E-1 |
| defense response to virus | 5 | 5,6 | 5,5E-3 | 4,9E-1 |
| Signal transduction | 12 | 13,5 | 1,0E-2 | 6,5E-1 |
| Response to virus | 4 | 4,5 | 1,2E-2 | 6,4E-1 |
| Negative regulation of osteoblast differentiation | 3 | 3,4 | 1,2E-2 | 6,1E-1 |
| Negative regulation of endopeptidase activity | 4 | 4,5 | 1,5E-2 | 6,5E-1 |
| Regulation of oligodendrocyte progenitor proliferation | 2 | 2,2 | 2,1E-2 | 7,3E-1 |
| Positive regulation of cAMP metabolic process | 2 | 2,2 | 2,5E-2 | 7,6E-1 |
| Positive regulation of energy homeostasis | 2 | 2,2 | 2,5E-2 | 7,6E-1 |
| O-glycan processing | 3 | 3,4 | 2,7E-2 | 7,6E-1 |
| Glucose metabolic process | 3 | 3,4 | 3,4E-2 | 8,0E-1 |
| T cell chemotaxis | 2 | 2,2 | 3,4E-2 | 7,8E-1 |
| Striated muscle cell differentiation | 2 | 2,2 | 4,2E-2 | 8,3E-1 |
| Positive regulation of T cell migration | 2 | 2,2 | 4,2E-2 | 8,3E-1 |
| Regulation of cell proliferation | 4 | 4,5 | 4,5E-2 | 8,3E-1 |
| Positive regulation of cAMP-mediated signaling | 2 | 2,2 | 5,0E-2 | 8,4 E-1 |
| Regulation of necrotic cell death | 2 | 2,2 | 5,0E-2 | 8,4 E-1 |
| Negative regulation of smooth muscle cell migration | 2 | 2,2 | 5,8E-2 | 8,7E-1 |
| Peptidyl-tyrosine dephosphorylation | 3 | 3,4 | 6,7E-2 | 8,9E-1 |
| Negative regulation of peptidase activity | 2 | 2,2 | 7,0E-2 | 8,90E-1 |
| Positive regulation of histone acetylation | 2 | 2,2 | 7,4E-2 | 9,0E-1 |
| Positive regulation of leukocyte chemotaxis | 2 | 2,2 | 7,4E-2 | 9,0E-1 |
| Negative regulation of smoothened signaling pathway | 2 | 2,2 | 7,8E-2 | 9,0E-1 |
| Negative regulation of growth | 2 | 2,2 | 7,8E-2 | 9,0E-1 |
| Inflammatory response | 5 | 5,6 | 8,0E-2 | 8,9E-1 |
| Cellular response to lipopolysaccharide | 3 | 3,4 | 8,5E-2 | 9,0E-1 |
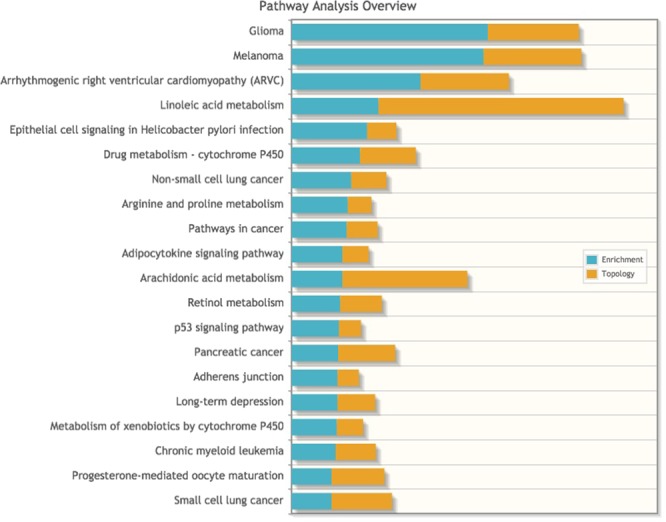
Accordingly, signaling pathways highlighted by the KEGG database as showing the most activation after RYGB also included those related to response to inflammation and microorganisms, together with pathways directly associated with cancer (Supplementary Table S2).
IPA software identified the 24 most connected canonical pathways that were significantly changed in the ES tissue after RYGB. These also included pathways associated with inflammation, in response to bile and microorganisms, immune tolerance, and cancer development (Fig. 4). Some DEGs involved directly or indirectly with the identified canonical pathways were validated by quantitative reverse transcription polymerase chain reaction (RT-qPCR, Supplementary Table S3). The analysis of gene interaction networks highlighted biological processes involved in infectious inflammation (gastroenteritis) and cancer development (Fig. 5). Additional predictive analysis of regulatory genes showed that the activation of gastroenteritis by RYGB was independent of classical nuclear factor kappa B (NFkB) activation and tumor necrosis factor alpha (TNF-α) expression (Fig. 6A). Instead, the set of processes significantly altered after RYGB indicated activated epithelial cell death/necrosis processes, while cell repopulation or tissue regeneration occurred at the expense of changes in the expression of genes involved in carcinogenesis (Fig. 6B). Joint analysis, combining our transcriptomic data with the metabolomic data highlighted pathways involved in cancer development, inflammation, and immune response to microorganisms (Fig. 7).
Figure 4.

Canonical pathways in the ES tissue activated by RYGB. Data were analyzed via the use of IPA (QIAGEN Inc.; https://www.qiagenbioinformatics.com/products/ingenuitypathway-analysis).
Figure 5.

Gene interaction networks in the ES tissue activated by RYGB, showing (A) gastroenteritis and (B) carcinogenesis as biological networks activated by the surgery. Data were analyzed by IPA (QIAGEN Inc.; https://www.qiagenbioinformatics.com/products/ingenuitypathway-analysis).
Figure 6.

Gene interaction network associated with the predictive activation of (A) infectious inflammation (gastroenteritis) and (B) epithelial cell necrosis and cell proliferation towards neoplasia after RYGB. Data were analyzed by IPA (QIAGEN Inc., https://www.qiagenbioinformatics.com/products/ingenuitypathway- analysis).
Figure 7.
Joint analysis, combining our transcriptomic data with our metabolomis data, highlighted pathways involved in cancer development, inflammation, and immune response to microorganisms.
Discussion
In this study, we identified abnormal gastric histology in obese women that worsened after RYGB in parallel to an increased alkaline duodenal reflux into the ES, which was rich in bile acids (BA) and metabolites common to the intestinal environment (urine and faeces). Our molecular analyzes suggested the existence of a potential premalignant environment created by the fluid accumulating in the bypassed organ, which caused inflammation to worsen and promoted the expression of genes that may favor carcinogenesis in the long-term. Considering that the ES will remain for the rest of the patient’s life, potentially for 30–50 years, this tissue needs to be monitored periodically.
Bile-rich duodenal reflux has previously been directly related to postoperative gastric mucosal damage2,4,5,7,9. Accordingly, our patients presented with a predominant increase of BA in the gastric fluid contained in the ES, including primary, secondary, conjugated, and sulphated BA. It is possible that the increased amounts of abdominal fat in obese women physically favors a light preoperative duodenal gastric reflux. The changes in gastrointestinal anatomy induced after RYGB appears to increase the intensity of this reflux and BA accumulation with more intense consequences on the normal architecture of the ES, regardless of body weight loss.
A typical example of the inflammatory potential of BA is cholestatic disease. This can be triggered by the lipophilic characteristics of BA, mainly conjugated, by promoting cell-membrane damage via activation of the phospholipase A2 (PLA2) and interleukin 17 A (IL-17A) pathway14. PLA2 activation is involved in the production of the pro-inflammatory eicosanoid precursor arachidonic acid (AA) and lysophosphatidylcholine (LysoPC), while IL-17A favors inflammation by increasing neutrophil recruitment and proinflammatory cytokine synthesis through pathways independent of TNF-α and NFkB activation14,15. In our study, we observed increased levels of AA and LysoPC in the ES along with IL-17A gene activation, suggesting that the accumulation of conjugated BA may have activated inflammatory pathways, contributing to the progression of tissue inflammatory alterations.
Complementary metabolic data supported the non-physiological accumulation of primary BA at the ES. In epithelial cells, primary BA promotes sulphation of accumulated bile by activating nuclear receptors such as the farnesoid X receptor (FXR), pregnane X receptor (PXR), vitamin D receptor (VDR), and peroxisome proliferator-activated receptor coativator 1 alpha (PPARGC1A). Sulphated BA are less toxic compounds than non-sulphated BA and is more suitable for faecal and urinary excretion15. We observed predictive activation of these nuclear receptors, together with increased sulphated BA, indicative of the activation of biological pathways which deal with toxic bile accumulation. It is worth noting that even sulphated BA may lose its protective role and become highly inflammatory when accumulated instead of excreted16.
In our study, some drugs and metabolites that use bile as the excretion route had also accumulated in the ES, as suggested by the increase in metabolites often found in the urine and faeces after RYGB17–19. Accumulation of these products may have clinically relevant consequences. The biliary enterohepatic cycle may result in ‘false positive’ systemic hepatic feedback, while non-excreted and accumulated metabolites may become co-participants of bile-induced tissue inflammation in the ES.
On the other hand, some BA, mainly secondary BA, can exert anti-inflammatory effects by activating the G-protein coupled bile acid receptor 5 (TGR5). This receptor can reduce the production of pro-inflammatory cytokines (TNF-α, IL-1β and IL-6) induced by lipopolysaccharides (LPS) in neutrophils and macrophages via NFkB inhibition20. Moreover, TGR5 can activate endocannabinoid pathways and enhance their immunosuppressive action by the synthesis of stearoylethanolamide, a substrate of the cytochrome P450 family 2 subfamily C member 8 (CYP2C8)21–24. However, TGR5 activation is associated with a certain immunological tolerance, which is modestly effective in reducing inflammation21,25. In the present study, increased secondary BA and stearoylethanolamide in the gastric fluid, combined with the increased tissue expression of CYP2C8, are indicative of the activation of TGR5 in the ES. Consistent with this, levels of the IL-1β gene were significantly reduced and predictive gene analysis revealed that the inflammation observed in the ES occurred independently of TNF-α and NFκB (other TGR5 targets).
However, considering its immunosuppressive role, TGR5 may favor immunological tolerance and bacterial colonization, especially by bacteria involved in secondary BA synthesis20,21,25. In support of this hypothesis, we observed an increase in phosphatidic acid, a membrane lipid essential for bacterial immune tolerance that can be generated by the activation of TGR521.
Other molecular markers of tolerance to microorganisms were altered in RYGB-ES, such as the olfactomedim 4 (OLFM4) gene and transmembrane 1 gene (SECTM1). The gastric increase of OLFM4 is related to H. pylori colonization by decreasing NFκB activity and inhibiting inflammation, while the reduced expression of SECTM1 may be considered as a potential marker of immunosuppressive response to constant exposure to LPS26,27.
In tumors, increased OLFM4 expression is associated with differentiation, staging, metastasis, and poor prognosis, suggesting potential clinical value as a tumor marker in the early stages of carcinogenesis26. Changes in the expression of SECTM1 and OLFM4, as well as in the activity of TGR5, play a role in the immunological tolerance to cancer cells and the colonization of tissues by bacteria26,27. We also found significantly reduced expression of radical S-adenosyl methionine domain containing 2 (RSAD2) and increased expression levels of protein tyrosine phosphatase, type S receptor (PTPRS) in ES tissue. Both genes encode proteins involved in virus-immune tolerance, suggesting immunological tolerance to the virus after RYGB28,29.
Once in the tissue, microorganisms have an important impact on metabolism by complementing human enzymatic activities and promoting health or disease30. Gram-negative bacteria (e.g. Escherichia coli) are more resistant to the lipophilic characteristics of BA and can grow in environments with high concentrations of bile31. In the bile-enriched environment of the ES, a potentially higher amount of Gram-negative resistant bacteria could act on the primary BA to produce its secondary derivatives20,32. Under anaerobic conditions, the predominant secondary BA formed is ursodeoxycholic. This, and its conjugated derivative, tauroursodeoxycholic (TUDCA), is hydrophilic, less toxic, and anti apoptotic32,33. The increase of TUDCA, and decrease of ketolitocolic acid, observed by us in the ES points to a predominantly anaerobic environment and the participation of Gram-negative bacteria to control the toxicity of accumulated bile after the procedure.
Under such anaerobic conditions, microorganisms may synthesize vitamins and ferment undigested carbohydrates and amino acids derived from dietary or host-derived proteins to short-chain fatty acids (SCFAs), such as butyrate and propanoate, in order to supply energy and cholesterol and thus regulate lipid metabolism. Gases, such as hydrogen and carbon dioxide are consequences of fermentation. The removal of these gases allows fermentation to continue. Specifically, methanogenesis uses hydrogen and carbon dioxide to produce methanol and transesterify fatty acids. This process is relevant for intestinal health by replacing the inflammatory characteristics of saturated fatty acids with anti-inflammatory functions30–36.
In the present study, we observed increased metabolism and synthesis of vitamins, oxidation of SCFAs, and metabolism of propanoate as methyl palmitate and methyl stearate (transesterified lipids); these findings support the presence of anaerobic bacteria in the RYGB-ES. Similarly, the observed increase in tryptophanol, hydroxymethyl-cholestadienol, and cholesterol are indicative of proteolytic activity. Myxobacteria, a type of Gram-negative anaerobic bacteria, exclusively synthesize hydroxymethyl-cholestadienol into cholesterol from leucine36.
In particular, the typically low stomach pH values (pH 1–3) seem important for the appropriate production of mucin (MUC) which acts as a barrier for pathogenic bacteria and controls inflammation37,38. We found a significant reduction of MUC17, GCNT3 (glucosaminyl (N-acetyl) transferase 3, mucin type) and B3GALT5 (beta-1,3- galactosyltransferase 5) expression following RYGB-ES; all of these factors are involved in the production of mucin37–42. We also observed an increase of intellectin 1/omentin (ITLN1) expression, which is responsible for the mucosal secretion of galactose-linked lecithin that participates in the recognition of pathogenic bacteria42. ITLN-1 overexpression has been reported in intestinal metaplasia and may be a marker of intestinal-type gastric tumors41. In our study, mucin expression decreased following RYGB-ES, together with an increase in ITLN-1 and galactose metabolism, thereby favoring potential colonization by microorganisms.
Postoperative inflammation, the excessive growth of microorganisms, and the generation of reactive oxygen species (ROS), together with a reduction in mucin, are likely to act as aggressive factors in ES epithelial tissue, inducing cell death with subsequent signaling for repopulation. Notably, ITLN1 is predominantly expressed in the gut where it can stimulate epithelial cell survival through Akt activation; following RYGB-ES, we observed increased levels of ITLN but reduced levels of the mitogenic gastric cell factor GAST. Our molecular findings suggest that stress-induced tissue regeneration in ES may progress towards intestinal metaplasia, and be considered as a pre-tumor lesion41,42.
Successful stress-induced regeneration depends on cell proliferation. In our study, the increased expression of insulin-like growth factor 1 receptor (IGF1R), insulin-like growth factor binding protein 5 (IGFBP5), glypican-3 (GPC3), and cyclin dependent kinase 6 (CDK6), together with a decrease in serpin family B (SERPINB) 5 and 7 suggest that the RYGB-ES cells are proliferating and that the tissue extracellular matrix is remodeling to accommodate new cells. In breast and stomach cancers, the increased expression of IGF1R, GPC3, and IGFBP5 genes is associated with tumor progression and metastasis43–46. Moreover, extracellular matrix remodeling occurs when the expression of SERPINB5 and 7 is reduced, favoring cellular proliferation and migration and, in cases of cancer, invasion and metastasis47.
Cell repopulation involves the fine control of cell positioning and adhesion in tissue; an imbalance in these processes are often observed in tumors48,49. In our transcriptomic analysis, the significant increase of Eph receptor B3 (EphB3), in conjunction with cadherin 2 (CDH2), suggests tissue regeneration, positional control, and cell adhesion in the ES. EphB3 is often expressed in the intestinal epithelium and functions as an important agent in cell repositioning during tissue regeneration48. This can positively regulate the expression of cadherins such as CDH2, thus increasing cell adhesion48. However, an increase of EphB3 expression in tissues that do not normally express this gene, such as the lung, appears to promote oncogenic transformation and tumor development48.
Any process involving tissue remodeling and proliferation can be downregulated by protein phosphatases (PTPs), including protein tyrosine phosphatase, receptor type R (PTPRR). PTPRR can inhibit the IGF1R or Eph pathways by increasing its degradation50. In the RYGB-ES, the observed significant reduction in PTPRR expression suggests less degradation of both molecules, thus prolonging the proliferation signaling triggered by these receptors. Clinical and experimental studies have recognized that the epigenetic silencing of PTPRR is an early event in colorectal tumorigenesis50.
Epigenetic events control gene expression and play an important role in carcinogenesis. Epigenetic silencing (mainly of tumor suppressor genes), a result of DNA methylation and histone deacetylation, is the most frequent epigenetic event observed in tumors. However, in our transcriptomic and metabolomic analysis, the increase in N-acetyl-lysine (metabolite from histone acetylation; Table 3), along with positive regulation of the histone acetylation pathway, observed by DAVID analysis (Table 6), suggests an active gene transcripton process in ES-cells and not a global mechanism of gene silencing or DNA methylation. Interestingly both events may be related to carcinogenesis since epigenetic events are transient. A previous experimental study, using breast cells cultured with chemical carcinogens, demonstrated that during malignant transformation, the silencing or increase in gene expression depended on the dose and time of exposure to the carcinogens. In addition, when the chemical carcinogen was removed from the culture medium, the gene transcription process was regulated in a manner similar to the control cells51. This means that highly proliferative environments exposed to toxic agents are susceptible to both epigenetic events and may subsequently facilitate genetic mutations if the stressful stimulus is not controlled or removed51. In the ES-microenvironment, the immunological tolerance acquired with the continuation of stress (reflux), suggested by our molecular data, could favor genetic instability and impair the elimination of mutated cells. In the long term, the metabolic and genetic changes promoted by postoperative reflux may result in irreversible mutations and make the ES a fertile environment for cancer development. In our transcriptomic analysis, we observed a non-significant decrease in the expression of the mutL homolog 1 (MLH1) gene early after RYGB. This gene encodes a protein that detects and repairs DNA damage during cell proliferation52. It is possible that in the long-term, the downregulation of MLH1 becomes significant and results in the accumulation of DNA mutations with increased risk for cancer development.
For clinical cancer development, genetic mutations must contribute to and maintain clonal expansion. This includes, but is not limited to: (i) proliferative advantages, and (ii) disorders in cell cycle control and DNA repair, or even the absence of restrictive proliferation signals. When present, these changes are considered shortcuts to the development of cancer. However, for complete malignant transformation, a third component, which binds (i) and (ii) appears to be mandatory: the metabolic reprogramming of cells, including their microenvironment53.
Activation of the mammalian target of rapamycin (mTOR) protein complex is common in inflammatory processes, immune tolerance, and cancer, and is considered to lin these processes together54. mTOR regulates the expression of genes and signaling pathways involved in cell metabolism, in an attempt to prevent the interruption of immune and proliferative functions owing to a lack of energy and oxygen. In order to maintain energy delivery, mTOR enhances pathways involved in rapid ATP synthesis (via the Warburg effect), while stimulating mitochondrial biogenesis via the expression of PPARGC1A. The end products of glycolysis are shared between resident cells by the monocarboxylate transporter 2 (MCT2), a transporter encoded by the solute carrier family 16-member 7 (SLC16A7) gene to avoid interruptions in metabolic flow. mTOR also increases the synthesis of cholesterol and fatty acids, at the expense of decreased beta-oxidation, mainly to synthesize membranes and their lipid rafts. These membrane microdomains harbor and activate proliferative (IGF-1R and GPC-3) and immunological (TGR5) signaling receptors, as well as the concentrated production of phosphatidic acid. mTOR is especially activated by the unsaturated chains of phosphatidic acid21,54. Our data showed compatible changes of these genes and metabolites, suggesting that ES fluid after RYGB activates mTOR for the maintenance of local inflammatory, tolerant, and proliferative conditions
Taken together, genetic and metabolic alterations observed in the RYGB-ES were similar to those occurring in carcinogenesis, although it is unlikely that these arose from gene mutations, considering the short analysis period after surgery (3 months). Nevertheless, the hostile environment of the ES highlighted by our data (with absence of food along with biliary reflux rich in intestinal content, decreased mucins, increased pH, excessive microorganism growth and increased ROS production) may enhance inflammation and activate immunological tolerance in the long-term, thus hindering the elimination of mutated cells.
It is possible that the diagnosis of cancer in patients undergoing RYGB-ES has been underestimated, as endoscopic access to this anatomical portion in the postoperative period is difficult2,4–6,9. This clinical challenge represents the most relevant scientific limitation of our study: data relating to postoperative histological, metabolomics, and mainly transcriptomics were obtained from ≤50% of the total number of patients recruited. This also prevented us from obtaining an adequate amount of ES-tissue with which to assess functional and mechanistic data related to gene expression, which was based solely at the transcriptional level. However, gene expression can be influenced by environmental factors and our metabolomic analysis identified significant alterations in the ES environment. Furthermore, the observed set of DEGs shared common biological pathways, in which activation/inhibition was consistent with the identified environmental changes. Another limitation of our study was the fact that our analyses only involved obese women. This, however, ensured that we had a more homogeneous sample, as gender may have influenced gene expression. In addition, most bariatric patients in our institution are women.
The development and application of alternative methods for cancer screening in the RYGB-ES, such as medical imaging, should be strongly encouraged. Alternatively, surgeons should be invited to reflect on the relevance of conserving the excluded stomach as part of the RYGB technique. Our molecular data supports the need for some action in these directions, by highlighting the fact that RYGB can generate a pre-malignant environment in ES early after the procedure. Some of our findings are very relevant at this point, such as the local presence of 5-ciprinol sulphate, a toxic bile alcohol present in the adult phase only under specific dysfunctional conditions, such as inflammation and carcinogenesis in the liver55. Because carcinogenesis is usually a long-term process, it may be possible that reports relating to RYGB-ES cancer will increase over time. It is probable that surgery does not behave as a pre-neoplasm lesion for gastric cancer but rather exposes the ES-RYGB to a detrimental environment with a potential risk for cancer development.
Supplementary information
Acknowledgements
This study was supported by FAPESP – Fundacao de Amparo à Pesquisa do Estado de Sao Paulo (Process Number 2011/09612-3) and Faculty of Medicine Foundation (PROFAP-LIM).
Author Contributions
G.R.R. conceived the study design and wrote the first and final draft; R.I. helped to collect tissue samples and interpreted endoscopy data; R.S.T. reviewed the first and final draft; P.S. performed microarray analysis; N.M.M. performed the bioinformatic analysis on genetic data; D.C.F. performed the RT-qPCR experiments and statistical analysis; G.A.B.C. was responsible for standardization and prepared samples for the metabolic experiments; E.P. performed Gas Chromatography; V.N. performed Liquid Chromatography; M.F.M.T. performed metabolomic statistical analysis; P.S. and J.F. conducted endoscopy analyses; M.A.S. and E.G.H.M. performed the clinical follow-up of patients. R.A.N. and A.F.L. conducted histopatological analyses; D.L.W. helped to interpret data and reviewed the first and final draft. All authors have reviewed and approved the final manuscript.
Competing Interests
The authors declare no competing interests.
Footnotes
Publisher’s note: Springer Nature remains neutral with regard to jurisdictional claims in published maps and institutional affiliations.
Supplementary information
Supplementary information accompanies this paper at 10.1038/s41598-019-42082-4.
References
- 1.Frühbeck G. Bariatric and metabolic surgery: a shift in eligibility and success criteria. Nat Rev Endocrinol. 2015;11:465–77. doi: 10.1038/nrendo.2015.84. [DOI] [PubMed] [Google Scholar]
- 2.Csendes A, et al. Results of gastric bypass plus resection of the distal excluded gastric segment in patients with morbid obesity. J Gastrointest Surg. 2005;9:121–31. doi: 10.1016/j.gassur.2004.05.006. [DOI] [PubMed] [Google Scholar]
- 3.Tseng CH, et al. Gastric microbiota and predicted gene functions are altered after subtotal gastrectomy in patients with gastric cancer. Sci Rep. 2016;6:1–8. doi: 10.1038/s41598-016-0001-8. [DOI] [PMC free article] [PubMed] [Google Scholar]
- 4.Kuga R, et al. Endoscopic findings in the excluded stomach after Roux-en-Y gastric baypass surgery. Arch Surg. 2007;142:942–6. doi: 10.1001/archsurg.142.10.942. [DOI] [PubMed] [Google Scholar]
- 5.Safatle-Ribeiro AV, et al. What to expect in the excluded stomach mucosa after vertical banded Roux-en-Y gastric bypass for morbid obesity. J Gastrointest Surg. 2007;11:133–7. doi: 10.1007/s11605-006-0047-1. [DOI] [PubMed] [Google Scholar]
- 6.Ishida RKCA, et al. Microbial flora of the stomach after gastric bypass for morbid obesity. Obes Surg. 2007;17:752–8. doi: 10.1007/s11695-007-9139-6. [DOI] [PubMed] [Google Scholar]
- 7.Aron-Wisnewsky J, Dore J, Clement K. The importance of the gut microbiota after bariatric surgery. Nat Rev Gastroenterol Hepatol. 2012;9:590–8. doi: 10.1038/nrgastro.2012.161. [DOI] [PubMed] [Google Scholar]
- 8.Sitarz R, et al. Gastroenterostoma after Billrothanterectomy as a premalignant condition. World J Gastroenterol. 2012;18:3201–6. doi: 10.3748/wjg.v18.i25.3201. [DOI] [PMC free article] [PubMed] [Google Scholar]
- 9.Dantas ACB, et al. Influence of obesity and bariatric surgery on gastric cancer. Cancer Biol Med. 2016;13:269–76. doi: 10.20892/j.issn.2095-3941.2016.0011. [DOI] [PMC free article] [PubMed] [Google Scholar]
- 10.Sala P, et al. The SURMetaGIT study: Design and rationale for a prospective pan-omics examination of the gastrointestinal response to Roux-en-Y gastric bypass surgery. J Int Med Res. 2016;44:1359–75. doi: 10.1177/0300060516667862. [DOI] [PMC free article] [PubMed] [Google Scholar]
- 11.Lash JG, Genta RM. Adhrence to the Sydney System guidelines increases the detection of Helicobacter gastritis and intestinal metaplasia in 400738 sets of gastric biopsies. Aliment Pharmacol Ther. 2013;38:424–31. doi: 10.1111/apt.12383. [DOI] [PubMed] [Google Scholar]
- 12.Canuto, G. A. B. et al. New insights into the mechanistic action of methyldehydrodieugenol B towards Leishmania (L.) infantum via a multiplatform based untarget metabolomics approach. Metabolomics 13–56 (2017)
- 13.Kramer A, et al. Causal analysis approaches in Ingenuity Pathway Analysis. Bioinformatics. 2014;30:523–30. doi: 10.1093/bioinformatics/btt703. [DOI] [PMC free article] [PubMed] [Google Scholar]
- 14.O’Brien KM, et al. IL-17A synergistically enhances bile-acid induced inflammation during obstructive cholestasis. Am J Pathol. 2013;183:1498–507. doi: 10.1016/j.ajpath.2013.07.019. [DOI] [PMC free article] [PubMed] [Google Scholar]
- 15.Jia W, Xie G, Jia W. Bile acid-microbiota crosstalk in gastrointestinal inflammation and carcinogenesis. Nat Rev Gastroenterol Hepatol. 2018;15:111–28. doi: 10.1038/nrgastro.2017.119. [DOI] [PMC free article] [PubMed] [Google Scholar]
- 16.Duboc H, et al. Connecting dysbiosis, bile-acid dysmetabolism and gut inflammation in inflammatory bowel diseases. Gut. 2013;62:531–9. doi: 10.1136/gutjnl-2012-302578. [DOI] [PubMed] [Google Scholar]
- 17.Hosey CM, Broccatelli F, Benet LZ. Predicting when biliary excretion of parent drug is a major route of elimination in humans. AAPS J. 2014;16:1085–96. doi: 10.1208/s12248-014-9636-1. [DOI] [PMC free article] [PubMed] [Google Scholar]
- 18.Klein DJ, et al. PharmGKB summary: tamoxifen pathway, phamacokinetics. Pharmacogenet Genomics. 2013;23:643–7. doi: 10.1097/FPC.0b013e3283656bc1. [DOI] [PMC free article] [PubMed] [Google Scholar]
- 19.Nobles CL, Green SI, Maresso AW. A product of heme catabolism modulates bacterial function and survival. PLoS Pathog. 2013;9:e1003507. doi: 10.1371/journal.ppat.1003507. [DOI] [PMC free article] [PubMed] [Google Scholar]
- 20.Thomas C, et al. Targeting bile-acid signaling for metabolic disease. Nat Rev Drug Discov. 2008;7:678–93. doi: 10.1038/nrd2619. [DOI] [PubMed] [Google Scholar]
- 21.Brown HA, Thomas PG, Lindsley CW. Targeting phospholipase D in cancer, infection and neurodegenerative disorders. Nat Rev Drug Discov. 2017;16:351–67. doi: 10.1038/nrd.2016.252. [DOI] [PMC free article] [PubMed] [Google Scholar]
- 22.Snider NT, Walker VJ, Hollenberg PF. Oxidation of the Endogenous Cannabinoid Arachidonoylethanolamide by the cytochrome P450 monooxygenases: physiological and pharmacological implications. Pharmacol Rev. 2010;62:136–54. doi: 10.1124/pr.109.001081. [DOI] [PMC free article] [PubMed] [Google Scholar]
- 23.Panigrahy D, et al. Cytocrome P450-derived eicosanoids: the neglected pathway in cancer. Canc Metastasis Rev. 2010;29:723–35. doi: 10.1007/s10555-010-9264-x. [DOI] [PMC free article] [PubMed] [Google Scholar]
- 24.Magotti P, et al. Structure of human N- acylphosphatidylethanolamine-hydrolyzing phospholipase D: regulation of fatty acid ethanol amide biosynthesis by bile acids. Structure. 2015;23:598–604. doi: 10.1016/j.str.2014.12.018. [DOI] [PMC free article] [PubMed] [Google Scholar]
- 25.Yoneno K, et al. TGR5 signaling inhibits the production of pro-inflammatory cytokines by in vitro differentiated inflammatory and intestinal macrophages in Crohn’s disease. Immunology. 2013;139:19–29. doi: 10.1111/imm.12045. [DOI] [PMC free article] [PubMed] [Google Scholar]
- 26.Liu W, Rodgers GP. Olfactomedin 4 expression and functions in innate immunity, inflammation, and cancer. Canc Metastasis Rev. 2016;35:201–12. doi: 10.1007/s10555-016-9624-2. [DOI] [PubMed] [Google Scholar]
- 27.Huyton T, et al. The T/NK cell co-stimulatory molecule SECTM1 is an IFN “early response gene” that is negatively regulated by LPS in human monocytic cells. BiochimBiophysActa. 2011;1810:1294–301. doi: 10.1016/j.bbagen.2011.06.020. [DOI] [PubMed] [Google Scholar]
- 28.Hhelbig KJ, Beard MR. The role of viperin in the innate antiviral response. J Mol Biol. 2014;426:1210–9. doi: 10.1016/j.jmb.2013.10.019. [DOI] [PubMed] [Google Scholar]
- 29.Bunin A, et al. Protein tyrosine phosphatase PTPRS is an inhibitory receptor on human and murine plasmacytoid dendritic cells. Immunity. 2015;43:277–88. doi: 10.1016/j.immuni.2015.07.009. [DOI] [PMC free article] [PubMed] [Google Scholar]
- 30.Flint HJ, et al. The role of the gut microbiota in nutrition and health. Nat Rev Gastroenterol Hepatol. 2012;9:577–89. doi: 10.1038/nrgastro.2012.156. [DOI] [PubMed] [Google Scholar]
- 31.Thanassi DG, Cheng LW, Nikaido H. Active efflux of bile salts by Escherichia coli. J Bacteriol. 1997;17:2512–8. doi: 10.1128/jb.179.8.2512-2518.1997. [DOI] [PMC free article] [PubMed] [Google Scholar]
- 32.Hirano S, Masuda N, Oda H. In vitro transformation of chenodeoxycholic acid and ursodeoxycholic acid by human intestinal flora, with particular reference to the mutual conversion between the two bile acids. J Lipid Res. 1981;22:735–43. [PubMed] [Google Scholar]
- 33.Rowland I, et al. Gut microbiota functions: metabolism of nutrients and other food component. Eur J Nutr. 2018;57:1–24. doi: 10.1007/s00394-017-1445-8. [DOI] [PMC free article] [PubMed] [Google Scholar]
- 34.Cai P, Kaphalia BS, Ansari GA. Methyl palmitate: inhibitor of phagocytosis in primary rat kupffer cells. Toxicol. 2005;210:197–204. doi: 10.1016/j.tox.2005.02.001. [DOI] [PubMed] [Google Scholar]
- 35.Muller KD, et al. Trans-esterification of fatty acids from microorganisms and human blood serum by trimethylsulfonium hydroxide (TMSH) for GC analysis. Chromatographia. 1990;30:245–8. doi: 10.1007/BF02319701. [DOI] [Google Scholar]
- 36.Bode HB, et al. Steroid biosynthesis in prokaryotes: identification of myxobacterial steroids and cloning of the first bacterial 2,3(S)- oxidosqualenecyclase from the myxobacterium Stigmatella aurantiaca. Mol Microbiol. 2003;47:471–81. doi: 10.1046/j.1365-2958.2003.03309.x. [DOI] [PubMed] [Google Scholar]
- 37.Linden SK, et al. Mucins in the mucosal barrier to infection. Mucosal Immunol. 2008;1:183–97. doi: 10.1038/mi.2008.5. [DOI] [PMC free article] [PubMed] [Google Scholar]
- 38.Resta-Lenert S, Das S, Batra SK, Ho SB. Muc17 protects intestinal epithelial cells from enteroinvasive E. coli infection by promoting epithelial barrier integrity. Am J Physiol Gastrointest Liver Physiol. 2011;300:G1144–55. doi: 10.1152/ajpgi.00138.2010. [DOI] [PMC free article] [PubMed] [Google Scholar]
- 39.Gonzáles-Vallinas M, et al. Clinical relevance of the differential expression of the glycosyltransferase gene GCNT3 in colon cancer. Eur J Canc. 2015;51:1–8. doi: 10.1016/j.ejca.2014.10.021. [DOI] [PubMed] [Google Scholar]
- 40.Trinchera M, et al. Controlo f glycosylation-related genes by DNA methylation: the intrigating case of the B3GALT5 gene and its distinct promoters. Biology (Basel) 2014;3:484–97. doi: 10.3390/biology3030484. [DOI] [PMC free article] [PubMed] [Google Scholar]
- 41.Zheng L, et al. Aberrant expression of intelectin-1 in gastric cancer: its relationship with clinicopathological features and prognosis. J Cancer Res Clin Oncol. 2012;138:163–72. doi: 10.1007/s00432-011-1088-8. [DOI] [PMC free article] [PubMed] [Google Scholar]
- 42.Mirkov MU. Genetics of inflammatory bowel disease: beyond NOD2. Lancet. Gastroenterol Hepatol. 2017;2:224–34. doi: 10.1016/S2468-1253(16)30111-X. [DOI] [PubMed] [Google Scholar]
- 43.Pavelic K, et al. Gastric cancer: the role of insulin-like growth factor 2 (IGF 2) and its receptors (IGF 1R and M6-P/IGF 2R) J Pathol. 2003;201:430–8. doi: 10.1002/path.1465. [DOI] [PubMed] [Google Scholar]
- 44.Baxter RC. IGF binding proteins in cancer: mechanistic and clinical insights. Nat Rev Canc. 2014;14:329–41. doi: 10.1038/nrc3720. [DOI] [PubMed] [Google Scholar]
- 45.Ushiku T, et al. Glypican 3-expressing gastric carcinoma: distinct subgroup unifying hepatoid, clear-cell, and alpha- fetoprotein-producing gastric carcinomas. Cancer Sci. 2009;100:626–32. doi: 10.1111/j.1349-7006.2009.01108.x. [DOI] [PMC free article] [PubMed] [Google Scholar]
- 46.Gao W, Tang Z, Zhang Y. Immunotoxin targeting glypican-3 regresses liver cancer via dual inhibition of Wnt signaling and protein synthesis. Nature Commun. 2015;6:6536. doi: 10.1038/ncomms7536. [DOI] [PMC free article] [PubMed] [Google Scholar]
- 47.Chou RH, Wen HC, Liang WG. Suppression of the invasion and migration of cancer cells by SERPINB family genes and their derived peptides. Oncol Rep. 2012;27:238–45. doi: 10.3892/or.2011.1497. [DOI] [PubMed] [Google Scholar]
- 48.Ji XD, et al. EphB3 is overexpressed in non-small-cell lung cancer and promotes tumor metastasis by enhancing cell survival and migration. Cancer Res. 2011;71:1156–66. doi: 10.1158/0008-5472.CAN-10-0717. [DOI] [PubMed] [Google Scholar]
- 49.Ramis-Conde I, et al. Multi-scale modelling of cancer cell intravasation: the role of cadherins in metastasis. Phys Biol. 2009;6:016008. doi: 10.1088/1478-3975/6/1/016008. [DOI] [PubMed] [Google Scholar]
- 50.Menigatti M, et al. The protein tyrosine phosphatase receptor type R gene is an early and frequent target of silencing in human colorectal tumorigenesis. Mol Cancer. 2009;8:124. doi: 10.1186/1476-4598-8-124. [DOI] [PMC free article] [PubMed] [Google Scholar]
- 51.Bradley C, et al. Carcinogen-induced histone alteration in normal human mammary epitelial cells. Carcinogenesis. 2007;28:2184–2192. doi: 10.1093/carcin/bgm100. [DOI] [PubMed] [Google Scholar]
- 52.Zhu H, et al. Polymorphisms in mismatch repair genes are associated with risk and microsatellite instability of gastric cancer, and Interact with life exposures. Gene. 2016;579:52–7. doi: 10.1016/j.gene.2015.12.050. [DOI] [PubMed] [Google Scholar]
- 53.Lewis NE, Abdel-Haleem AM. The evolution of genome-scale models of cancer metabolism. Frontiers Physiol. 2013;4:1–7. doi: 10.3389/fphys.2013.00237. [DOI] [PMC free article] [PubMed] [Google Scholar]
- 54.Weichhart T, Hengstschläger M, Linke M. Regulation of innate immune cell function by mTOR. Nat Rev Immunol. 2015;15:599–614. doi: 10.1038/nri3901. [DOI] [PMC free article] [PubMed] [Google Scholar]
- 55.Goto T, et al. Physicochemical and physiological properties of 5 alpha-cyprinol sulfate, the toxic bile salt of cyprinid fish. J Lipid Res. 2003;44:1643–51. doi: 10.1194/jlr.M300155-JLR200. [DOI] [PubMed] [Google Scholar]
Associated Data
This section collects any data citations, data availability statements, or supplementary materials included in this article.