

Abstract
Neural invasion is one of the malignant features contributing to locally advanced and/or metastatic disease progression in patients with pancreatic ductal adenocarcinoma (PDAC). Few studies exist on the distribution and state of nerve fibers in PDAC tissue and their clinicopathological impacts. The aim of the present study was to investigate the clinicopathological characteristics and prognostic value of intrapancreatic neural alterations in patients with PDAC. We retrospectively analyzed 256 patients with PDAC who underwent macroscopic curative surgery. Nerve fibers, immunolabeled with a specific neural marker GAP‐43, were digitally counted and compared among PDAC, chronic pancreatitis (CP) and normal pancreatic tissues. Interlobular nerve fibers were apparently hypertrophic in both CP and PDAC, although intrapancreatic neural density and nerve number decreased characteristically in PDAC. They tended to decrease toward the center of the tumor. Kaplan‐Meier survival analyses revealed a statistically significant correlation between low neural density and shorter overall survival (OS) (P = 0.014), and between high neural invasion and shorter OS (P = 0.017). Neural density (P = 0.04; HR = 1.496; 95% CI 1.018‐2.199) and neural invasion ratio (P = 0.064; HR = 1.439; 95% CI .980‐2.114) were prognostic factors of shorter OS in the multivariate analysis. These findings suggest low intrapancreatic neural density in patients with PDAC as an independent prognosticator, which may represent aggressive tumor behavior. Furthermore, we propose a simple, practical and reproducible method (to measure neural density and the neural invasion ratio during conventional histopathological diagnosis of PDAC), which has been validated using another cohort (n = 81).
Keywords: ductal carcinoma, intrapancreatic neural density, intrapancreatic neural invasion, pancreas, prognosis
1. INTRODUCTION
Pancreatic ductal adenocarcinoma (PDAC), an aggressive malignancy with a dismal survival rate and the fourth leading cause of cancer‐related death both in the United States and Japan,1 is predicted to be the second leading cause of cancer‐related mortality worldwide by 2030.2 At the time of diagnosis, the majority of patients with PDAC present with unresectable disease due to locally advanced and/or metastatic disease.3, 4 In patients with resectable non‐metastatic PDAC, disease recurrence after curative surgery is common and long‐term survival rates are low.5 Adjuvant therapies have demonstrated efficacy in delaying tumor recurrence and improving survival.6 However, PDAC patient outcomes have not changed over the past three decades.7
The pancreas possesses extrinsic and intrinsic innervation by sympathetic, parasympathetic, and afferent fibers. Nerve fibers enter or exit the pancreas as neurovascular stalks, which disseminate in the interlobular or intralobular stromal septa as periacinar nerve fibers comprising the pancreatic stroma.8, 9 Through neural invasion, cancer cells spread widely and profoundly; and cancer cells can also be spread through lymph vascular invasion.10, 11, 12 Neural invasion contributes to locally advanced and/or metastatic disease progression in patients with PDAC. Among gastrointestinal malignancies, the incidence of neural invasion in PDAC was reported to be highest, and the severity of neural invasion was the strongest.13 To date, however, the criteria for categorization of the severity of neural invasion have not been set using numerical criteria and have been somewhat vague. Further to the neural invasion of cancer cells, other neural alterations, such as increased neural hypertrophy and neuritis in PDAC, have been reported.8, 14, 15 Several authors have reported on the interaction between pancreatic cancer cell and nerves during tumor growth.16, 17, 18 However, few studies exist on the distribution and state of nerve fibers in PDAC tissue and their clinicopathological impacts.
The aim of this study was to investigate the intrapancreatic neural alterations in the PDAC tissue as well as their clinicopathological significance. We also attempted developing how these intrapancreatic neural alterations are evaluated, during the conventional histopathological diagnosis of PDAC.
2. MATERIALS AND METHODS
2.1. Study population
A total of 256 patients with PDAC were treated with pancreatectomy between 2004 and 2011 at the National Cancer Center Hospital, Tokyo. Of these, 31 patients (7 who underwent preoperative chemotherapy, 3 who underwent remnant pancreatectomy for post‐pancreatectomy recurrence and 21 with variant histology) were excluded from this study. Finally, this study included 225 patients with the conventional PDAC (Table 1). From 2004 to 2008, adjuvant therapy was not administered routinely, and a total of 99 (39%) patients received adjuvant chemotherapy. Tumors were staged according to the International Union against Cancer (UICC) tumor‐node‐metastasis (TNM) classification19 as follows: stages IA (n = 14), IB (n = 31), IIA (n = 13), IIB (n = 80), III (n = 71) and IV (n = 16). All patients with stage IV disease were diagnosed on the basis of para‐aortic lymph node involvement. Patients were followed up every 1 to 2 months during the first year of surgery. Recurrence was diagnosed when a new local or distant metastatic lesion was found in imaging studies, or when an increase in tumor marker levels with deterioration of a patient's condition was recognized. The median follow‐up period was 23.4 (0.6‐127.9) months. Overall, for patients: 134 patients were alive, 84 died due to the pancreatic cancer, while 7 died of other causes.
Table 1.
Univariate and multivariate analysis of prognostic factors associated with overall survival
| Variables | Categories | n | 5‐year survival rate (%) | Median survival time (months) | Univariate analysis | Multivariate analysis | |
|---|---|---|---|---|---|---|---|
| P | Hazard ratio | P | |||||
| Age (median, 66 years) | <66 | 105 | 23.0 | 27.7 (19.8‐35.6)) | 0.03 | ||
| ≥66 | 120 | 38.2 | 35.6 (22.5‐46.2) | ||||
| Sex | Male | 139 | 30.5 | 32.4 (21.2‐43.7) | 0.687 | ||
| Female | 87 | 29.2 | 29.2 (20.8‐37.6) | ||||
| Location | Ph | 140 | 26.0 | 27.7 (19.5‐36.0) | 0.134 | ||
| Pbt (Pt) | 85 (15) | 36.2 | 33.4 (20.7‐46.1) | ||||
| CA19‐9 (IU/L) (median, 155 IU/L) | <155.5 | 113 | 40.7 | 38.8 (24.1‐53.5) | 0.007 | 1.527 (1.056‐2.209) | 0.025 |
| ≥155.5 | 112 | 20.6 | 25.1 (20.8‐29.4) | ||||
| Size (median, 3.5 cm) | ≤3.5 | 118 | 40.1 | 41.7 (28.8‐54.6) | <0.001 | ||
| >3.5 | 107 | 19.8 | 20.1 (15.1‐25.1) | ||||
| Serosal invasion | Absent | 165 | 36.5 | 38.8 (30.2‐47.4) | <0.001 | ||
| Present | 60 | 13.1 | 19.1 (12.8‐25.4) | ||||
| Lymph node metastasis | Absent | 58 | 54.4 | 68.9 (21.5‐116.3) | 0.001 | 1.782 (1.095‐2.898) | 0.02 |
| Present | 167 | 21.3 | 26.0 (20.8‐31.1) | ||||
| Retroperitoneal invasion | Absent | 46 | 55.2 | 67.0 (18.0‐116.0) | 0.003 | ||
| Present | 179 | 24.3 | 27.7 (21.5‐34.0) | ||||
| Portal vein invasion | Absent | 125 | 30.5 | 32.4 (24.9‐39.9) | 0.345 | ||
| Present | 100 | 28.6 | 27.7 (19.0‐36.5) | ||||
| Nerve plexus invasion | Absent | 67 | 56.7 | 67.0 (50.4‐83.7) | <0.001 | 1.897 (1.133‐3.176) | 0.015 |
| Present | 158 | 20.4 | 23.9 (20.2‐27.6) | ||||
| Tumor grade | G1/G2 | 192 | 31.1 | 32.4 (26.2‐38.5) | 0.046 | 1.763 (1.033‐3.007) | 0.037 |
| G3 | 33 | 22.9 | 20.7 (10.3‐31.1) | ||||
| Lymphatic invasion | low | 46 | 45.3 | 42.3 (4.7‐79.9) | 0.020 | ||
| high | 179 | 26.7 | 27.9 (21.9‐33.9) | ||||
| Venous invasion | low | 51 | 54.6 | 67.0 (43.9‐90.2) | <0.001 | ||
| high | 174 | 22.4 | 25.5 (19.5‐31.5) | ||||
| Intrapancreatic neural invasion | low | 110 | 37.9 | 33.9 (21.3‐46.4) | 0.025 | ||
| high | 115 | 21.3 | 27.3 (21.3‐36.2) | ||||
| Surgical margin status | Negative | 138 | 38.7 | 41.4 (28.3‐54.5) | <0.001 | 1.597 (1.086‐2.349) | 0.017 |
| Positive | 87 | 17.3 | 19.7 (15.3‐24.0) | ||||
| Adjuvant chemotherapy | Yes | 99 | 36.5 | 43.2 (30.1‐56.3) | 0.001 | 1.769 (1.203‐2.602) | 0.004 |
| No | 126 | 24.2 | 23.4 (18.7‐28.1) | ||||
| Intrapancreatic neural density | low | 112 | 23.6 | 23.9 (20.6‐27.2) | 0.014 | 1.496 (1.018‐2.199) | 0.04 |
| high | 113 | 36.0 | 41.7 (32.2‐51.2) | ||||
| Intrapancreatic nerve number | low | 112 | 27.7 | 25.1 (20.3‐29.9) | 0.082 | ||
| high | 113 | 32.3 | 38.8 (29.9‐47.8) | ||||
| Intrapancreatic neural invasion ratio | high | 113 | 23.1 | 23.63 (17.63‐29.64) | 0.017 | ||
| low | 112 | 36.3 | 38.83 (29.26‐48.41) | ||||
For the validation study, we included 81 patients with PDAC treated with pancreatectomy between 2012 and 2013 at our hospital. The demographic characteristics of participants are presented in Table S1. The median follow‐up period was 24.1 (1.8‐80.8) months. Overall, for patients: 43 patients were alive while 38 died due to the pancreatic cancer.
For the control, tissues of normal pancreas (NP) and chronic pancreatitis (CP) were analyzed. NP tissues were all pancreatic body tissues obtained from patients with pancreatic tail tumors, such as serous cystic neoplasm (n = 1), solid‐pseudopapillary neoplasm (n = 4) and neuroendocrine tumor (n = 5). In CP (n = 10) cases, we selected tissue slides containing the typical features of chronic pancreatitis that were at least 2 cm distant from the nearest cancer tissue detected microscopically. These were cases of pancreatic body cancer in which cancer‐associated chronic obstructive pancreatitis had developed in the pancreatic tail side from the PDAC lesion.
This study was approved by the Institutional Review Board of the National Cancer Center, Tokyo. Written informed consent was obtained from all participants involved in this study and all clinical investigations were conducted according to the principles expressed in the Declaration of Helsinki.
2.2. Pathological examination
All PDAC lesions were pathologically examined and classified according to World Health Organization (WHO) classification,20 UICC TNM classification,19 and the Classification of Pancreatic Cancer of the Japan Pancreas Society (JPS Classification).21 Surgically resected specimens were fixed in 10% formalin and cut into serial slices (5 mm thick), horizontally in the pancreas head and sagittally in the pancreas body and tail. All sections were subjected to pathologic examination after staining with HE. Neural invasion was defined as infiltration of cancer cells into the endoneurium.
2.3. Immunohistochemistry
Immunohistochemistry was performed on formalin‐fixed, paraffin‐embedded tissue sections as described previously.22 We used antibodies against the following: PGP9.5 (1:500; Dako, Glostrup, Denmark), growth associated protein 43 (GAP‐43) (1:1000, Merck, Darmstadt, Germany) and SMAD4 (1:400, Santa Cruz Biotechnology, Dallas, TX, USA). Immunohistochemistry, without the primary antibody, was performed as a negative control.
2.4. Evaluation of intrapancreatic nerve features
The maximum cut surface of the tumor was used for all the examinations of the tissue specimen in this study. To evaluate the nerve features within pancreatic parenchyma in PDAC tissues, we drew a borderline along the cancer cell invasive margin. Because both neural density and neural distribution in these areas seemed to be different from those in the pancreatic parenchyma, the extrapancreatic structures were excluded from the measurement field in this study. When the pancreatic parenchyma was replaced by fibrous tissue, we determined the field of pancreatic parenchyma by the residual islets. We preliminarily compared the 2 markers PGP9.5 and GAP‐43 for the detection of nerve fibers and chose GAP‐43, because both molecules were expressed in exactly the same nerves but PGP9.5 was also expressed in pancreatic islet cells.
After immunohistochemistry, the microscopic images were imported as digital photo files using a NanoZoomer 2.0‐HT (Hamamatsu Photonics, Hamamatsu, Japan), and the density of the immunolabeled cells was analyzed using the image analysis software Tissue Studio (Definiens, Munich, Germany).23 The total area and the total number of GAP‐43‐labeled nerves in the target field were measured, and the following factors were calculated. We defined “neural density” as the sum of the nerve area per unit area, “nerve number” as the total number of nerves per unit area, “mean nerve size” as the average area of nerve fibers and “neural invasion ratio” as the ratio of the numbers of nerves invaded by cancer cells to the total numbers of nerves in the pancreatic parenchyma within the PDAC tissue. We evenly counted all nerve fibers observed in tissue sections regardless of the nerve size, nerve shape and cut directions of the nerves.
Pancreatic ductal adenocarcinoma tissue was divided into 3 areas as follows: “Area 1,” a band area 3 mm inward from the tumor borderline; “Area 2,” a band area 3 mm inward from the medial boundary of Area 1; and “Area 3,” an inward area from the medial boundary of Area 2. In addition, the “surrounding area” was defined as a band area 3 mm outward from the tumor borderline in the surrounding area of PDAC.
For survival and correlation analyses, patients were divided into 2 groups, with high and low values of variables, using the median value as a cut‐off.
2.5. Attempted practical method to evaluate neural alterations during conventional histopathological diagnosis
We attempted to make a practical method to evaluate both the intrapancreatic neural density and the neural invasion ratio as prognostic factors during conventional histopathological diagnosis of PDAC. We measured the number of nerve fibers (except the thin nerve fibers present at the periacinar space usually found in the NP) instead of the nerve area, because this was difficult to measure and the neural density was significantly correlated with the nerve number that can be counted by the conventional microscopic observation. We randomly measured the number of nerve fibers from 8 areas (low power field using 10× object lens; 4 each were at the center and periphery of the tumor tissues, respectively) in the pancreatic parenchyma, within PDAC. Simultaneously, we detected the presence of cancer invasion into the nerve fibers, counted as above. Then we calculated the sum of the total number of nerve fibers from the 8 areas, the sum of the number of the nerve fibers that were invaded by cancer cells from the 8 areas, and the neural invasion ratio.
First, we determined the cut‐off levels for the Kaplan‐Meier analysis between the high and low values of both the intrapancreatic nerve number and the neural invasion ratio from the receiver operating characteristic (ROC) curve using the training set. The training set consisted of 148 patients who had died of pancreatic cancer or were alive for at least 5 years after the surgery, among the 225 PDAC patients. According to the median survival time of the training set (22.4 months), the cut‐off levels were determined at an optimized accuracy, with equal weight given to sensitivity and specificity errors.24 We confirmed their cut‐off levels using the validation set that consisted of 81 patients, as mentioned above.
2.6. Statistical analysis
To compare more than 2 subgroups of samples, the Kruskal‐Wallis test was used. If a significant result was found, further pairwise comparisons of the subgroups were performed using the Mann‐Whitney U test. Fisher's exact test was used to compare categorical data. The postoperative OS rate and disease‐free survival (DFS) were calculated using the Kaplan‐Meier method. Univariate analysis was performed for prognostic factors using the log rank test. Factors found to be significant in the univariate analysis were incorporated into the multivariate analysis using the Cox proportional hazards model (forced entry method). Differences at P < 0.05 were considered statistically significant. Statistical analyses were performed using the Statistical Package for the Social Sciences (IBM SPSS Statistics for Windows, Version 25.0, IBM, Armonk, NY, USA).
3. RESULTS
3.1. Apparent hypertrophic interlobular nerve fibers in both chronic pancreatitis and PDAC, with distinct numbers between both
A lot of thin nerve fibers were present at the periacinar spaces in the pancreatic lobules in NP, and interlobular nerves were inconspicuous (Figure 1). As acinar cells were replaced by the fibrous tissue, thin nerve fibers at the periacinar spaces decreased and somewhat thickened in CP. Notably, hypertrophy of interlobular nerves was frequently induced. These interlobular nerve fibers did not disappear even when the surrounding tissues were replaced by fibrous tissue; instead, they characteristically became hypertrophic (Figure 1). The hypertrophic changes of the nerve were observed not only in inflamed or fibrotic tissue but also in the pancreatic parenchyma surrounding that lesion, which is often adjacent to the extrapancreatic tissue. Alteration in intrapancreatic nerve fibers in PDAC was similar to that in CP, although hypertrophic nerve fibers in the fibrous tissue were apparently decreased, especially in the central position of the PDAC (Figure 1). Intralobular nerve fibers were almost lost and had disappeared from the desmoplastic stroma (Figure 1).
Figure 1.

Comparisons of the neural alteration among normal pancreas (NP), chronic pancreatitis (CP), and pancreatic ductal adenocarcinoma (PDAC) tissue. Representative immunohistochemical images with GAP‐43 in NP, CP and PDAC, and the corresponding HE‐stained images. In NP (A to D), there are large numbers of intraparenchymal minute nerve fibers. Several hypertrophic nerves are seen but intraparenchymal nerve fibers are decreased in the atrophy of the acinar cell within CP (E to H), and in the desmoplastic stroma within PDAC (I to L). Adenocarcinoma cells proliferate with desmoplastic stromal reaction in the right half of the panel, and invade into the surrounding pancreatic parenchyma with chronic inflammation and fibrosis in I and J. Low‐power field in A, B, E, F, I and J, and middle‐power field in C, D, G, H, K and L
We determined some factors representing the nerve alterations quantitatively and compared these among NP, CP and PDAC (Figure 2). The neural density was comparable between NP and CP, although it was significantly reduced in PDAC compared to NP and CP. The nerve number in CP decreased and the mean nerve size in CP increased compared to NP. The intrapancreatic nerve number in PDAC was less than those in CP, and the mean nerve size was comparable between CP and PDAC.
Figure 2.
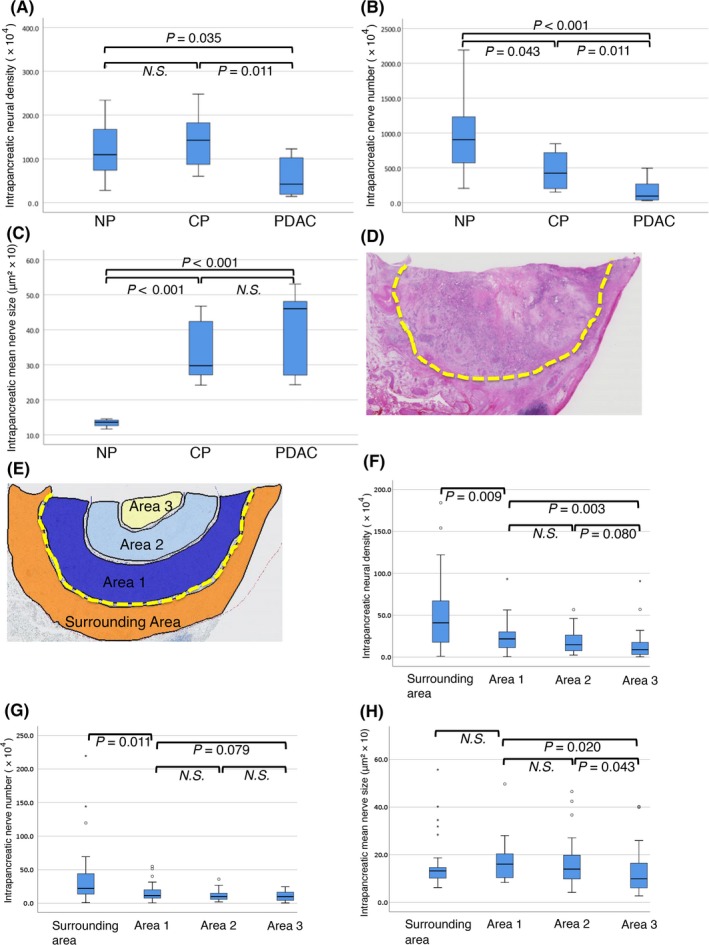
Quantitative analysis of the neural alterations in normal pancreas (NP), chronic pancreatitis (CP) and pancreatic ductal adenocarcinoma (PDAC). The intrapancreatic neural density (A), the nerve number (B) and the mean nerve size (C) are measured and compared among NP, CP and PDAC. Defining the intra‐tumoral measurement field by drawing a dotted line (yellow) along the cancer invasive margin (D), which is divided into 3 areas from “Area 1” to “Area 3” (refer to Materials and Method). In addition, the “surrounding area” is defined (E). The neural density (F), the nerve number (G) and the mean nerve size (H) are measured and compared among these areas. N.S., not significant
3.2. Intrapancreatic neural density tended to decrease toward the center of the tumor
We examined whether the intrapancreatic neural density differed according to the position in PDAC tissue. We randomly selected 30 cases among PDAC that had: tumor sizes of ≥30 mm, moderately differentiated adenocarcinoma, and were at UICC stage IIB. PDAC tissue was divided into 3 areas according to the position (refer to Section 2 and Figure 2E); also, the surrounding PDAC tissue area was defined. The neural alterations were then compared among the areas. Both the intrapancreatic neural density and nerve number exhibited a tendency to have a graded decrease toward the center of the tumor in PDAC (Figure 2). Tissue remodeling of pancreatic parenchyma, from acinar cell structure to the fibrous tissue in PDAC, progressed usually from the center to the periphery in tumor tissue. The surrounding area of the PDAC contained tissues mixed with CP and NP. It is assumed that these neural alterations in PDAC became more severe as tissue remodeling progressed.
Furthermore, intrapancreatic neural density and nerve number were not graded within the tumor tissue, but relatively uniform nerve distribution occurred in exceptional cases (7.5% of the total case). In these cases, pancreatic lobular structures were relatively preserved even if at the tumor center, while hypertrophic interlobular nerves were also found in the tumor center.
3.3. Relationship between intrapancreatic neural density and other clinicopathological variables
Intrapancreatic neural density had significant correlations with tumor grade, intrapancreatic neural invasion, intrapancreatic nerve number, intrapancreatic neural invasion ratio and recurrence pattern (Table 2). When the tumor location was classified into pancreatic head + body/tail, because peripancreatic nerve plexus is more common in the head and the body than in the tail of the pancreas, no significant relationship was found. Notably, the low neural density group of PDAC showed a significantly high neural invasion ratio, while the high neural density group of PDAC had a significantly low neural invasion ratio (Table 2). It was suggested that the reduction in intrapancreatic neural density in PDAC tissue may be implicated in the higher invasion of cancer cells into nerve fibers.
Table 2.
Relationship between the intrapancreatic neural density and other clinicopathological factors
| Variables | Intrapancreatic neural density | P | |
|---|---|---|---|
| Low | High | ||
| Age (median, 66 years) | |||
| <66 | 47 (44.8%) | 58 (55.2%) | 0.182 |
| ≧66 | 65 (54.2%) | 55 (45.8%) | |
| Sex | |||
| Male | 71 (51.4%) | 67 (48.6%) | 0.585 |
| Female | 41 (47.1%) | 46 (52.9%) | |
| Location | |||
| Ph | 63 (45.0%) | 77 (55.0%) | 0.075 |
| Pbt | 49 (57.6%) | 36 (42.4%) | |
| CA19‐9 (IU/L) (median, 155 IU/L) | |||
| <155.5 | 49 (43.4%) | 64 (56.6%) | 0.062 |
| ≥155.5 | 63 (56.3%) | 49 (43.8%) | |
| Size (median, 3.5 cm) | |||
| ≤3.5 | 57 (48.3%) | 61 (51.7%) | 0.690 |
| >3.5 | 55 (51.4%) | 52 (48.6%) | |
| Serosal invasion | |||
| Absent | 76 (46.1%) | 89 (53.9%) | 0.072 |
| Present | 36 (60.0%) | 24 (40.0%) | |
| Lymph node metastasis | |||
| Absent | 31 (53.4%) | 27 (46.6%) | 0.545 |
| Present | 81 (48.5%) | 86 (51.5%) | |
| Retroperitoneal invasion | |||
| Absent | 19 (41.3%) | 27 (58.7%) | 0.247 |
| Present | 93 (52.0%) | 86 (48.0%) | |
| Portal vein invasion | |||
| Absent | 58 (46.4%) | 67 (53.6%) | 0.284 |
| Present | 54 (54.0%) | 46 (46.0%) | |
| Nerve plexus invasion | |||
| Absent | 28 (41.8%) | 39 (58.2%) | 0.145 |
| Present | 84 (53.2%) | 74 (46.8%) | |
| Tumor grade | |||
| G1/G2 | 90 (46.9%) | 102 (53.1%) | 0.040 |
| G3 | 22 (66.7%) | 11 (33.3%) | |
| Lymphatic invasion | |||
| Low | 28 (60.9%) | 18 (39.1%) | 0.101 |
| High | 84 (46.9%) | 95 (53.1%) | |
| Venous invasion | |||
| Low | 27 (52.9%) | 24 (47.1%) | 0.636 |
| High | 85 (48.9%) | 89 (51.1%) | |
| Intrapancreatic neural invasion | |||
| Low | 40 (36.4%) | 70 (63.6%) | <0.001 |
| High | 72 (62.6%) | 43 (37.4%) | |
| Surgical margin status | |||
| Negative | 73 (52.9%) | 65 (47.1%) | 0.274 |
| Positive | 39 (44.8%) | 48 (55.2%) | |
| Adjuvant chemotherapy | |||
| Yes | 46 (45.1%) | 56 (54.9%) | 0.231 |
| No | 68 (54.0%) | 58 (46.0%) | |
| Intrapancreatic nerve number | |||
| Small number | 99 (88.4%) | 13 (11.6%) | <0.001 |
| Large number | 13 (11.5%) | 100 (88.5%) | |
| Intrapancreatic neural invasion ratio | |||
| High | 67 (59.8%) | 45 (40.2%) | 0.005 |
| Low | 45 (40.2%) | 67 (59.8%) | |
| Pattern of recurrence | |||
| Distant metastasis | |||
| Absent | 15 (27.3%) | 40 (72.7%) | <0.001 |
| Present | 72 (58.5%) | 51 (41.5%) | |
| Local recurrence | |||
| Absent | 60 (55.6%) | 48 (44.4%) | 0.060 |
| Present | 26 (40.0%) | 39 (60.0%) | |
| SMAD4 protein expression | |||
| Absent | 39 (48.8%) | 41 (51.2%) | 0.715 |
| Present | 21 (47.2%) | 26 (52.8%) | |
Bold values are statistically significant.
Recurrence was observed in 175 patients. Initial recurrence at locoregional, distant and both sites occurred in 52, 110 and 13 patients, respectively. Patients with PDAC having a low neural density had the tendency to develop initial recurrence at distant sites (Table 2). We examined the relationship between neural density and SMAD4 expression in 127 patients who underwent surgery after 2009 and who underwent adjuvant therapy almost routinely, although statistical correlation was not evident between them (Table 2).
3.4. Clinicopathological impacts of the intrapancreatic neural alterations in pancreatic ductal adenocarcinoma
Kaplan‐Meier survival analyses (Figure 3) revealed a statistically significant correlation between the low neural density and shorter OS. With the neural invasion ratio, the high invasion group showed a statistically significant correlation with shorter OS.
Figure 3.
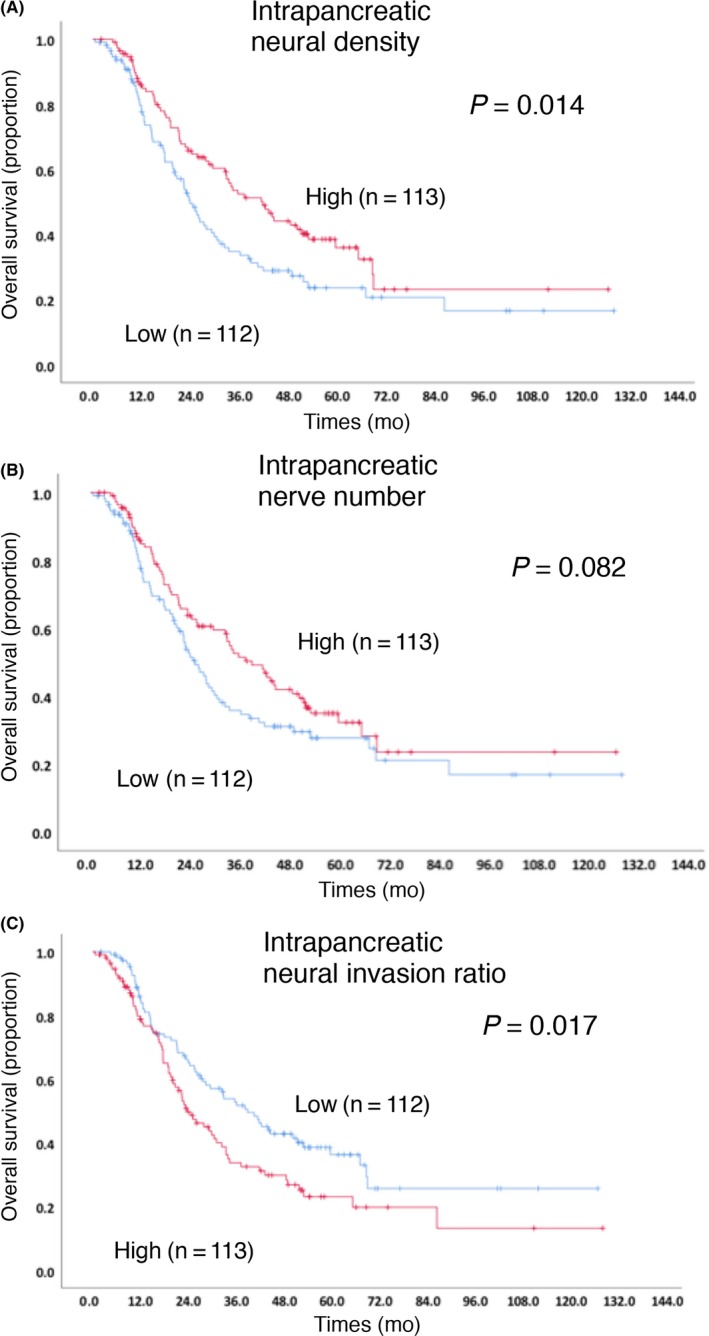
Kaplan‐Meier survival curves for overall survival (OS) in patients with pancreatic ductal adenocarcinoma (PDAC) according to the intrapancreatic neural density (A), nerve number (B) and neural invasion ratio (C)
Nineteen clinicopathological factors shown in Table 1 were investigated to determine whether they were of prognostic significance to OS. When the factors identified in the univariate analysis were assessed in the multivariate analysis, the following factors were found to be independently associated with longer OS: a low value of CA 19‐9, no lymph node metastasis, absence of extrapancreatic nerve invasion, G1/G2 grade, negative surgical margin, adjuvant chemotherapy and high neural density. No significant correlations were found with DFS in any of the neural alterations, but low neural density had a tendency for shorter DFS (P = 0.089, data not shown).
3.5. Attempted practical method to evaluate the intrapancreatic neural density and the neural invasion ratio during conventional histopathological diagnosis
It was suggested that intrapancreatic neural density and the neural invasion ratio are prognostic in PDAC patients, as mentioned above. Thus, we attempted to make method to evaluate them for use during conventional histopathological diagnosis of PDAC. To conduct a simple and practical method (refer to Section 2), we measured the number of intrapancreatic nerve fibers at 8 randomly selected areas in the pancreatic parenchyma within PDAC. We generated ROC curves to evaluate the nerve number as a prognostic biomarker for the survival of PDAC patients (Figure 4). Corresponding area under the curve (AUC) and cut‐off levels were calculated, which yielded AUC of .658. When the cut‐off levels were set at 7 (≤7 and >7) and PDAC patients were dichotomized into high and low nerve number groups, the calculated median survival time was 31.6 and 17.8 months, respectively (P < 0.001). Similarly, we generated ROC curves to evaluate the neural invasion ratio as a prognostic biomarker, and calculated the corresponding AUC (reported as .610). The candidate cut‐off value corresponding to the point with the lowest distance to the upper‐left corner of the ROC curve is 46.2% and another candidate corresponding to the point with the highest distance to the reference line of the ROC curve is 55.6%. To carry out a simple and practical method, we determined the cut‐off value as 50%. When the cut‐off levels were set at 50% (<50% and ≥50%) and PDAC patients were dichotomized into high and low neural invasion ratio groups, the calculated median survival time was 21.1 and 25.3 months, respectively (P = 0.018).
Figure 4.
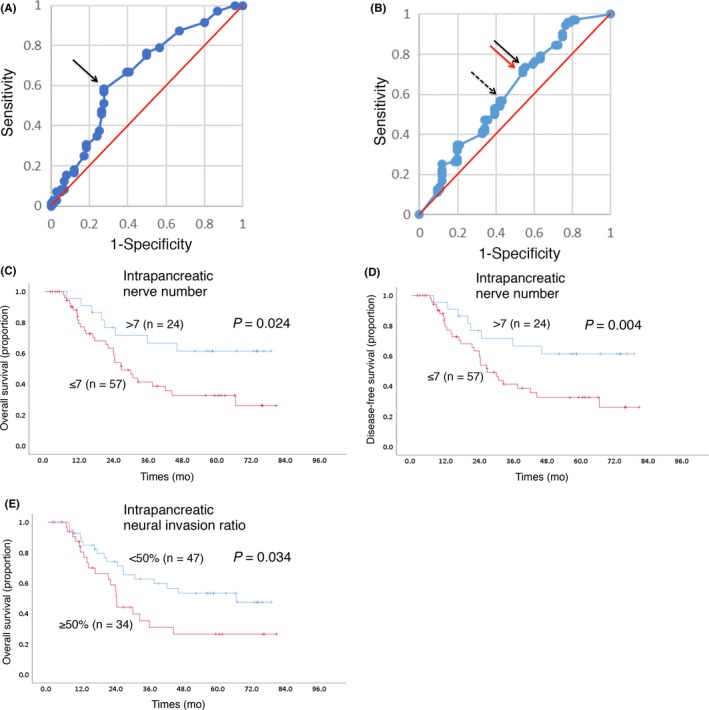
Receiver operating characteristic (ROC) curve analysis and Kaplan‐Meier survival curves. Cut‐off point of the intrapancreatic nerve number (A) or the intrapancreatic neural invasion ratio (B) in ROC curve analysis. The cut‐off value corresponding to the point with the lowest distance to the upper‐left corner of the ROC curve (and also the point with the highest distance to the reference line) is indicated by arrow in A. The candidate cut‐off value corresponding to the point with the lowest distance to the upper‐left corner of the ROC curve (dotted arrow) is 46.2% and another candidate corresponding to the point with the highest distance to the reference line of the ROC curve (black arrow) is 55.6%. To carry out a simple and practical method, we set the cut‐off value as 50%, with the corresponding point indicated with a red arrow in B. Kaplan‐Meier survival curves showing the comparison of OS (C, E) and DFS (D) between the high (red) and low (blue) nerve number groups (C, D) and those of the neural invasion ratio groups (E) in the validation cohort. P‐values are obtained from the log‐rank test
To confirm the prognostic impact of the intrapancreatic nerve number and the neural invasion ratio, we performed the same assay using another cohort (n = 81). Kaplan‐Meier survival analyses revealed that both OS and DFS were significantly shorter in the low‐nerve number group than in the high‐nerve number group (Figures 4C and D). Kaplan‐Meier survival analyses also revealed that OS was significantly shorter in the high‐neural invasion ratio group than in the low‐neural invasion ratio group (Figure 4E). Thus, both the nerve number and the neural invasion ratio were practical and useful prognostic‐related variables for patients with PDAC for the conventional pathological diagnosis.
4. DISCUSSION
The present study demonstrated new findings concerning intrapancreatic neural alterations developed in tumor tissue within pancreatic parenchyma of PDAC. First, interlobular nerve fibers were apparently hypertrophic in both CP and PDAC, although intrapancreatic neural density and nerve number decreased characteristically within PDAC. Second, the distribution of nerves was not even within the PDAC tissue, while the intrapancreatic neural density and nerve number were low at the center of the tumor but relatively high in marginal areas of the tumor. Third, intrapancreatic neural density (P = 0.04; HR = 1.496; 95% CI 1.018‐2.199) and the intrapancreatic neural invasion ratio (P = 0.064; HR = 1.439; 95% CI .980‐2.114) were prognostic factors of shorter OS in PDAC patients in the multivariate analysis. We demonstrated for the first time that the intrapancreatic neural density reflects the clinical malignancy of the tumor. Furthermore, we proposed a practical method to measure intrapancreatic neural density and the neural invasion ratio during conventional histopathological diagnosis of PDAC.
Compared to NP, intrapancreatic neural density and nerve number were significantly decreased in PDAC, and so was the nerve number in CP. A few previous studies have reported an increase in the neural density and/or nerve number in PDAC as well as CP.14, 25, 26 These findings seemed to be the opposite of our observation, although there might have been differences in the target area and the target nerve. Our analyses were based on the neural changes having occurred exactly in the tumor tissue within the pancreatic parenchyma and not in the extrapancreatic area, and both enlarged nerves and fine periacinar nerves were analyzed. We also observed the hypertrophic changes in nerves that were found in inflamed or fibrotic tissues and in the pancreatic and extrapancreatic tissues surrounding the lesion. According to Ceyhan et al, the neurotropic effect of pancreatic cancer extended into the peritumoral normal pancreatic areas25. Our observation is consistent with their report.
Regarding the pattern of the neural alterations within PDAC, nerves had the tendency to decrease gradually in an outward‐in manner. At the center of the tumor, nerves were scarce and the tissues in this area were fully replaced by desmoplastic stroma. Although tissues in both PDAC and CP were characterized by stromal reactions with marked fibrotic change, differences in the stromal composition between them were attributed to the interaction between pancreatic cancer cells and stromal cells, such as pancreatic stellate cells, cancer‐associated fibroblasts and macrophages.27, 28, 29 Their desmoplastic changes also differ macroscopically.30 Intrapancreatic nerves were also expected to interact with stromal cells as well as with cancer cells.16 Thus, there is the possibility that neural alterations which developed in tumor tissue within the pancreatic parenchyma might reflect the characteristics of the stromal change. It might also be assumed that nerve fibers were broken by cancer invasion, due to the significant correlation between nerve density and the nerve invasion ratio as well as the distribution of nerve fibers within PDAC tissue. We still do not understand the molecular mechanisms to explain the relationship between neural density and stromal characters and/or the invasive activity of cancer cells, although several studies have mentioned the prognostic value of factors relevant to stromal components;31, 32, 33 neural density and the nerve invasion ratio may be promising factors of practical use. It is possible if a strong interaction between the pancreatic cancer cells and nerves enables the survival of the nerve fibers and the acceleration of cancer growth,16, 17, 18 although no apparent findings support the hypothesis in this study.
It is unusual that the intrapancreatic neural density was not graded within the tumor tissue but relatively uniform nerve distribution was found in less than 10% of PDAC cases. These cases showed that pancreatic lobular structures were relatively preserved even at the tumor center, and hypertrophic interlobular nerves were also found at the tumor center. There were no significant differences in the clinicopathological variables between PDAC cases with relatively uniform nerve distribution and those with deviated nerve distribution (data not shown). When we analyzed 30 PDAC cases with a tumor size of 30 mm or more, consisting of a moderately differentiated adenocarcinoma, and at UICC stage IIB, only 4 cases showed relatively uniform nerve distribution. All of these 4 cases belonged to the high neural density and low neural invasion ratio group, and showed relatively good prognosis (OS for these 4 patients were 59.6, 68.1, 41.7 and 51.5 months, respectively). This is consistent with the finding that decreasing neural density causes deviated nerve distribution and poor patient outcome.
Intrapancreatic neural density was found to be an independent prognosticator in PDAC patients. Low intrapancreatic neural density was significantly correlated with higher tumor grade, lower number of intrapancreatic nerves, higher intrapancreatic neural invasion ratio, and development of initial recurrence at distant sites. Iacobuzio‐Donahue et al reported that PDAC with SMAD4/DPC4 gene alteration is highly correlated with the presence of widespread metastasis but not with locally destructive tumors in autopsied cases.34 We examined the relationship between neural density and SMAD4 expression. However, no significant correlation was observed between them in the present study.
Here we proposed a practical method to evaluate the intrapancreatic neural density and intrapancreatic neural invasion ratio during conventional histopathological diagnosis of PDAC. If the nerve number was ≤7, it was categorized as an unfavorable outcome. The neural invasion ratio of ≥50% was categorized as an unfavorable outcome. This method is simple and has been validated using another cohort (Figure 4). When the cut‐off level of the nerve invasion ratio was 55.6%, both OS and DFS were significantly shorter in the high‐neural invasion ratio group than in the low‐neural invasion ratio group in the validation cohort. To make the method more simple and practical, it might be better to set the cut‐off level at 50%.
Intrapancreatic neural invasion has been reported as being prognostic in PDAC.10, 11 Recent meta‐analysis revealed that there were high variances in the frequency of intrapancreatic neural invasion (76.2% to 97.8%), as well as extrapancreatic ones (52.2% to 75.8%).10 These high variances could arise from the lack of standardized method to evaluate neural invasion in PDAC tissues. Furthermore, the severity of neural invasion also showed large variance due to no numerical criterion, even if the severity was used to stratify the patients on their outcome. To make this a more reproducible variable, we need more specific criteria for neural invasion grades. It is possible that our proposed criteria for the neural invasion ratio may be used instead of neural invasion, because this will provide more reproducible results.
There are several limitations to this study. First, data collection and analyses were performed retrospectively. The indication for adjuvant chemotherapy, which was performed in 39% of patients and an independent prognostic factor for OS, was influenced by time trend. Second, in 31 of the 225 patients, the total nerve number counted in the measurement field was less than 10. Of the 31 patients, 9 had a tumor of 2 cm or less, and 11 of the 31 had stage I tumors. Compared to all of our series, the proportion of early disease in the small total number was relatively high, and this unequal distribution might have affected the prognostic analysis of the neural invasion ratio. Third, our study evaluated the neural alterations using immunohistochemical and conventional pathological method; verification was not performed from a molecular point of view. Further studies are warranted to clarify the molecular mechanism of neural alterations within PDAC.
In conclusion, our findings indicate that the intrapancreatic neural density in tumor tissue can be an independent prognostic factor in patients with PDAC, and the intrapancreatic neural invasion ratio has the potential to serve as a prognostic factor. For the practical use of these 2 prognosis‐related factors during conventional histopathological diagnosis of PDAC, we propose a simple and reproducible evaluation method that has been validated using another cohort.
Supporting information
ACKNOWLEDGMENTS
The authors thank Ms Sachiko Miura, Ms Toshiko Sakaguchi and Ms Chizu Kina for excellent technical support.
Iwasaki T, Hiraoka N, Ino Y, et al. Reduction of intrapancreatic neural density in cancer tissue predicts poorer outcome in pancreatic ductal carcinoma. Cancer Sci. 2019;110:1492‐1503. 10.1111/cas.13975
REFERENCES
- 1. Hidalgo M. Pancreatic cancer. N Engl J Med. 2010;362:1605‐1617. [DOI] [PubMed] [Google Scholar]
- 2. Rahib L, Smith BD, Aizenberg R, Rosenzweig AB, Fleshman JM, Matrisian LM. Projecting cancer incidence and deaths to 2030: the unexpected burden of thyroid, liver, and pancreas cancers in the United States. Cancer Res. 2014;74:2913‐2921. [DOI] [PubMed] [Google Scholar]
- 3. Greer JB, Brand RE. New developments in pancreatic cancer. Curr Gastroenterol Rep. 2011;13:131‐139. [DOI] [PubMed] [Google Scholar]
- 4. Huguet F, Orthuon A, Touboul E, Marseguerra R, Mornex F. Pancreatic cancer. Cancer Radiother. 2010;14(Suppl 1):S94‐S102. [DOI] [PubMed] [Google Scholar]
- 5. Chadha AS, Khoo A, Aliru ML, Arora HK, Gunther JR, Krishnan S. Recent advances and prospects for multimodality therapy in pancreatic cancer. Semin Radiat Oncol. 2016;26:320‐337. [DOI] [PubMed] [Google Scholar]
- 6. Oettle H, Neuhaus P, Hochhaus A, et al. Adjuvant chemotherapy with gemcitabine and long‐term outcomes among patients with resected pancreatic cancer: the CONKO‐001 randomized trial. JAMA. 2013;310:1473‐1481. [DOI] [PubMed] [Google Scholar]
- 7. Nattress C, Hallden G. Advances in oncolytic adenovirus therapy for pancreatic cancer. Cancer Lett 2018;434:56‐69. [DOI] [PubMed] [Google Scholar]
- 8. Demir IE, Friess H, Ceyhan GO. Neural plasticity in pancreatitis and pancreatic cancer. Nat Rev Gastroenterol Hepatol. 2015;12:649‐659. [DOI] [PubMed] [Google Scholar]
- 9. Dolensek J, Rupnik MS, Stozer A. Structural similarities and differences between the human and the mouse pancreas. Islets. 2015;7:e1024405. [DOI] [PMC free article] [PubMed] [Google Scholar]
- 10. Schorn S, Demir IE, Haller B, et al. The influence of neural invasion on survival and tumor recurrence in pancreatic ductal adenocarcinoma – A systematic review and meta‐analysis. Surg Oncol. 2017;26:105‐115. [DOI] [PubMed] [Google Scholar]
- 11. Shimada K, Nara S, Esaki M, Sakamoto Y, Kosuge T, Hiraoka N. Intrapancreatic nerve invasion as a predictor for recurrence after pancreaticoduodenectomy in patients with invasive ductal carcinoma of the pancreas. Pancreas. 2011;40:464‐468. [DOI] [PubMed] [Google Scholar]
- 12. Cheng P, Jin G, Hu X, et al. Analysis of tumor‐induced lymphangiogenesis and lymphatic vessel invasion of pancreatic carcinoma in the peripheral nerve plexus. Cancer Sci. 2012;103:1756‐1763. [DOI] [PMC free article] [PubMed] [Google Scholar]
- 13. Liebl F, Demir IE, Mayer K, et al. The impact of neural invasion severity in gastrointestinal malignancies: a clinicopathological study. Ann Surg 2014;260:900‐907; discussion 7‐8. [DOI] [PubMed] [Google Scholar]
- 14. Ceyhan GO, Bergmann F, Kadihasanoglu M, et al. Pancreatic neuropathy and neuropathic pain–a comprehensive pathomorphological study of 546 cases. Gastroenterology. 2009;136(177–86):e1. [DOI] [PubMed] [Google Scholar]
- 15. Ceyhan GO, Demir IE, Rauch U, et al. Pancreatic neuropathy results in “neural remodeling” and altered pancreatic innervation in chronic pancreatitis and pancreatic cancer. Am J Gastroenterol. 2009;104:2555‐2565. [DOI] [PubMed] [Google Scholar]
- 16. Amit M, Na'ara S, Gil Z. Mechanisms of cancer dissemination along nerves. Nat Rev Cancer 2016;16:399‐408. [DOI] [PubMed] [Google Scholar]
- 17. Stopczynski RE, Normolle DP, Hartman DJ, et al. Neuroplastic changes occur early in the development of pancreatic ductal adenocarcinoma. Cancer Res. 2014;74:1718‐1727. [DOI] [PMC free article] [PubMed] [Google Scholar]
- 18. Gil Z, Cavel O, Kelly K, et al. Paracrine regulation of pancreatic cancer cell invasion by peripheral nerves. J Natl Cancer Inst. 2010;102:107‐118. [DOI] [PMC free article] [PubMed] [Google Scholar]
- 19. Brierley JD, Gospodarowicz M, Wittekind C. TNM classification of malignant tumors, 8th edn Hoboken, NJ: Wiley‐Blackwell; 2017. [Google Scholar]
- 20. Bosman FT, Carneiro F, Hruban RH, Theise ND. WHO classification of tumours of the digestive system. Lyon: World Health Organization; 2010. [Google Scholar]
- 21. Classification of Pancreatic Cancer, 4th edn Tokyo, Japan: Kanehara; 2017. [Google Scholar]
- 22. Oguro S, Shimada K, Ino Y, et al. Pancreatic intraglandular metastasis predicts poorer outcome in postoperative patients with pancreatic ductal carcinoma. Am J Surg Pathol. 2013;37:1030‐1038. [DOI] [PubMed] [Google Scholar]
- 23. Oguro S, Ino Y, Shimada K, et al. Clinical significance of tumor‐infiltrating immune cells focusing on BTLA and Cbl‐b in patients with gallbladder cancer. Cancer Sci. 2015;106:1750‐1760. [DOI] [PMC free article] [PubMed] [Google Scholar]
- 24. Youden WJ. Index for rating diagnostic tests. Cancer. 1950;3:32‐35. [DOI] [PubMed] [Google Scholar]
- 25. Ceyhan GO, Schafer KH, Kerscher AG, et al. Nerve growth factor and artemin are paracrine mediators of pancreatic neuropathy in pancreatic adenocarcinoma. Ann Surg. 2010;251:923‐931. [DOI] [PubMed] [Google Scholar]
- 26. Ceyhan GO, Bergmann F, Kadihasanoglu M, et al. The neurotrophic factor artemin influences the extent of neural damage and growth in chronic pancreatitis. Gut. 2007;56:534‐544. [DOI] [PMC free article] [PubMed] [Google Scholar]
- 27. Haeberle L, Steiger K, Schlitter AM, et al. Stromal heterogeneity in pancreatic cancer and chronic pancreatitis. Pancreatology 2018;18:536‐549. [DOI] [PubMed] [Google Scholar]
- 28. Helm O, Mennrich R, Petrick D, et al. Comparative characterization of stroma cells and ductal epithelium in chronic pancreatitis and pancreatic ductal adenocarcinoma. PLoS ONE. 2014;9:e94357. [DOI] [PMC free article] [PubMed] [Google Scholar]
- 29. Zhan HX, Zhou B, Cheng YG, et al. Crosstalk between stromal cells and cancer cells in pancreatic cancer: new insights into stromal biology. Cancer Lett. 2017;392:83‐93. [DOI] [PubMed] [Google Scholar]
- 30. Hori S, Shimada K, Ino Y, et al. Macroscopic features predict outcome in patients with pancreatic ductal adenocarcinoma. Virchows Arch. 2016;469:621‐634. [DOI] [PubMed] [Google Scholar]
- 31. Nishida T, Yoshitomi H, Takano S, et al. Low stromal area and high stromal microvessel density predict poor prognosis in pancreatic cancer. Pancreas. 2016;45:593‐600. [DOI] [PubMed] [Google Scholar]
- 32. Wang LM, Silva MA, D'Costa Z, et al. The prognostic role of desmoplastic stroma in pancreatic ductal adenocarcinoma. Oncotarget. 2016;7:4183‐4194. [DOI] [PMC free article] [PubMed] [Google Scholar]
- 33. Sinn M, Denkert C, Striefler JK, et al. alpha‐Smooth muscle actin expression and desmoplastic stromal reaction in pancreatic cancer: results from the CONKO‐001 study. Br J Cancer. 2014;111:1917‐1923. [DOI] [PMC free article] [PubMed] [Google Scholar]
- 34. Iacobuzio‐Donahue CA, Fu B, Yachida S, et al. DPC4 gene status of the primary carcinoma correlates with patterns of failure in patients with pancreatic cancer. J Clin Oncol. 2009;27:1806‐1813. [DOI] [PMC free article] [PubMed] [Google Scholar]
Associated Data
This section collects any data citations, data availability statements, or supplementary materials included in this article.
Supplementary Materials