Abstract
Nasopharyngeal carcinoma (NPC) is one of the most common malignancies in the head and neck. The aim of the current study was to identify the key pathways and genes involved in NPC through bioinformatics analysis and to identify potential molecular mechanisms underlying NPC proliferation and progression. Three gene expression profiles (GSE12452, GSE34573 and GSE64634) were downloaded from the Gene Expression Omnibus database. A total of 76 samples were analyzed, of which 59 were NPC samples and 17 were normal samples. Gene ontology (GO) and Kyoto Encyclopedia of Genes and Genomes (KEGG) pathway enrichment analyses were subsequently conducted. The protein-protein interaction (PPI) network of the differentially expressed genes (DEGs) was constructed using Cytoscape software. Analysis of GSE12452, GSE34573 and GSE64634 datasets identified 1,301 (553 upregulated and 748 downregulated), 1,232 (348 upregulated and 884 downregulated) and 1,218 (555 upregulated and 663 downregulated) DEGs, respectively. Using Venn diagram analysis, 268 DEGs (59 upregulated and 209 downregulated) that intersected all three datasets, were selected for further analysis. The results of GO analysis revealed that upregulated DEGs were significantly enriched in biological processes, including ‘cell adhesion’, ‘cell division’, ‘mitosis’ and ‘mitotic cell cycle’. The downregulated DEGs were mainly enriched in ‘microtubule-based movement’, ‘cilium movement’, ‘cilium axoneme assembly’ and ‘epithelial cell differentiation’. The KEGG pathway analysis results revealed that the upregulated DEGs were highly associated with several pathways, including ‘extracellular matrix-receptor interaction’, ‘human papillomavirus infection’, ‘arrhythmogenic right ventricular cardiomyopathy’ and ‘focal adhesion’, whereas the downregulated DEGs were enriched in ‘metabolic pathways’, ‘Huntington's disease’, ‘fluid shear stress and atherosclerosis’ and ‘chemical carcinogenesis’. On the basis of the PPI network of the DEGs, the following top 10 hub genes were identified: Dynein axonemal light intermediate chain 1, dynein axonemal intermediate chain 2, calmodulin 1, coiled-coil domain containing 114, dynein axonemal heavy chain 5, radial spoke head 9 homolog, radial spoke head component 4A, NDC80 kinetochore complex component, thymidylate synthetase and coiled-coil domain containing 39. In conclusion, by performing a comprehensive bioinformatics analysis of DEGs, putative targets that could be used to elucidate the molecular mechanisms underlying NPC were identified.
Keywords: nasopharyngeal carcinoma, bioinformatics analysis, microarray, differentially expressed genes
Introduction
Nasopharyngeal carcinoma (NPC) is one of the most common malignancies in the head and neck (1). NPC has a unique geographical distribution, and is prevalent in Southeast Asia, the Middle East and North Africa (1). In endemic areas, NPC incidence may reach up to 35 cases per 100,000 persons among middle-aged males (2). The 5-year survival of patients with early-stage NPC is up to 95%, however, the survival rate of patients with advanced-stage NPC is only ~60% (3,4), and 70% of newly diagnosed patients with NPC have locoregionally advanced disease (5). Therefore, investigating potential biomarkers for the identification of patients with early-stage NPC is important to improve patient outcomes.
The presence of Epstein-Barr virus (EBV) DNA in plasma is currently used for screening asymptomatic patients with NPC, however, its positive predictive value for tumor screening is relatively low (11%) (6). Additionally, accumulating evidence indicates that polygenes and cell pathways, including the transforming growth factor-β signaling pathway and Notch signaling pathway, may contribute to the development and progression of NPC (7–9).
The precise molecular mechanisms underlying the progression of NPC remain unclear, and the early diagnosis and treatment of NPC is currently limited (10,11). Therefore, further studies to elucidate the molecular mechanisms involved in NPC proliferation and progression are required for a comprehensive understanding of NPC carcinogenesis.
Gene microarrays, which are high-throughput platforms for the analysis of gene expression, allow the identification of hundreds of differentially expressed genes (DEGs) involved in various signaling pathways, molecular functions and biological processes (12–14). However, only limited overlaps were observed when comparative analysis of the DEGs in independent studies was conducted (15,16). Combining microarray technologies and bioinformatics tools enhances the efficiency and accuracy of analysis (15,16). Wang et al (15) and Jiang et al (16) analyzed the GSE12452 dataset, which contained 31 NPC samples and 10 normal control samples, to identify the key genes involved in NPC. However, the number of samples included in these two studies was relatively small, and the molecular pathways involved in NPC carcinogenesis remain unclear. In the present study, the GSE12452 (17), GSE34573 (18) and GSE64634 (19) datasets were downloaded from the Gene Expression Omnibus database (GEO; www.ncbi.nlm.nih.gov/geo; GPL570 [HG-U133_Plus_2] Affymetrix Human Genome U133 Plus 2.0 Array) to identify DEGs in NPC tissues. Subsequently, gene ontology (GO; www.geneontology.org) and pathway enrichment analysis were conducted to identify the biological functions and pathways of key genes (20). The results of the present study provides novel insights into potential biomarkers for NPC and may contribute to the current understanding of the molecular mechanisms underlying NPC proliferation and progression.
Materials and methods
Microarray data
Three gene expression profiles (GSE12452, GSE34573, and GSE64634) were downloaded from the GEO database. GSE12452, which was based on the Affymetrix GPL570 platform [GPL570 (HG-U133_Plus_2) Affymetrix Human Genome U133 Plus 2.0 Array], was submitted by Ahlquist et al (17). The GSE12452 dataset contained 31 NPC samples and 10 normal NPC samples. The analysis for differential gene expression between tumor and normal tissue was performed using GeneSpring software version 11.5 (Agilent Technologies, Inc., Santa Clara, CA, USA). GSE34573, submitted by Hu et al (18), was based on the Affymetrix GPL570 platform [GPL570 (HG-U133_Plus_2) Affymetrix Human Genome U133 Plus 2.0 Array] and consisted of 16 NPC samples and 3 normal control samples. GSE64634, submitted by Xiong et al, was based on the Affymetrix GPL570 platform [GPL570 (HG-U133_Plus_2) Affymetrix Human Genome U133 Plus 2.0 Array] and consisted of 12 NPC samples and 4 normal controls (19). A Student's t-test was used to identify DEGs with an alteration of ≥2-fold. P<0.05 was considered to indicate a statistically significant difference.
GO and pathway enrichment analysis of DEGs
GO analysis and Kyoto Encyclopedia of Genes and Genomes (KEGG; www.genome.jp/kegg/pathway.html) pathway analysis were conducted to identify DEGs at the biologically functional level (21). The Database for Annotation, Visualization, and Integrated Discovery (DAVID; david.abcc.ncifcrf.gov) was used to integrate functional genomic annotations (22). P<0.05 was considered to indicate a statistically significant difference (23).
Integration of the protein-protein interaction (PPI) network
The Search Tool for the Retrieval of Interacting Genes version 10.0 (STRING; string-db.org) was used for the exploration of potential DEG interactions at the protein level (24). The PPI networks of DEGs by STRING were derived from validated experiments (25). A PPI score of >0.4 was considered significant. The PPI networks were visualized using Cytoscape software (http://www.cytoscape.org) (26). P<0.05 was considered to indicate a statistically significant difference.
Results
Identification of DEGs
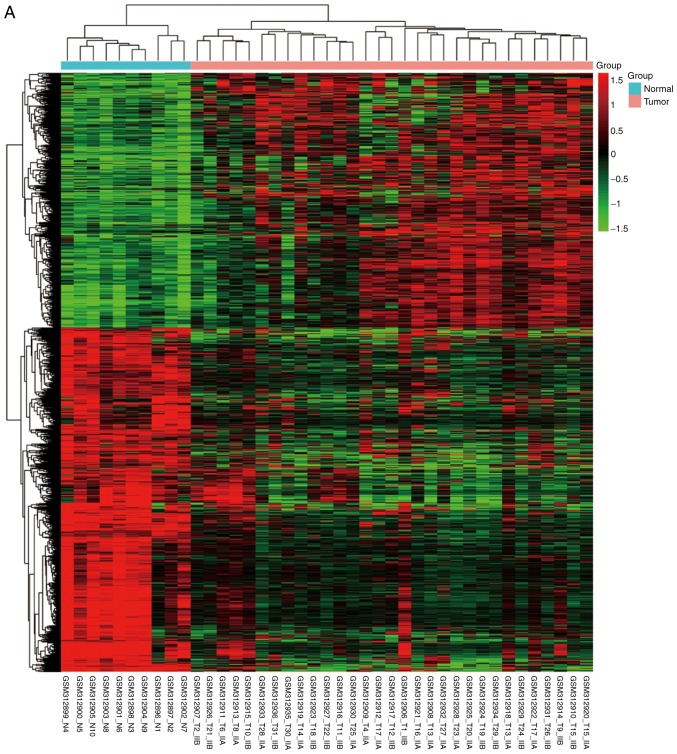
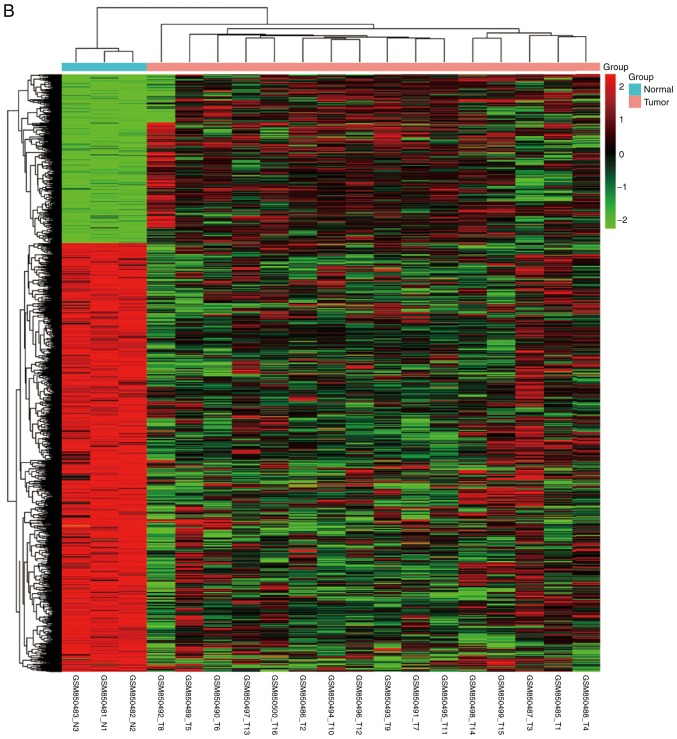
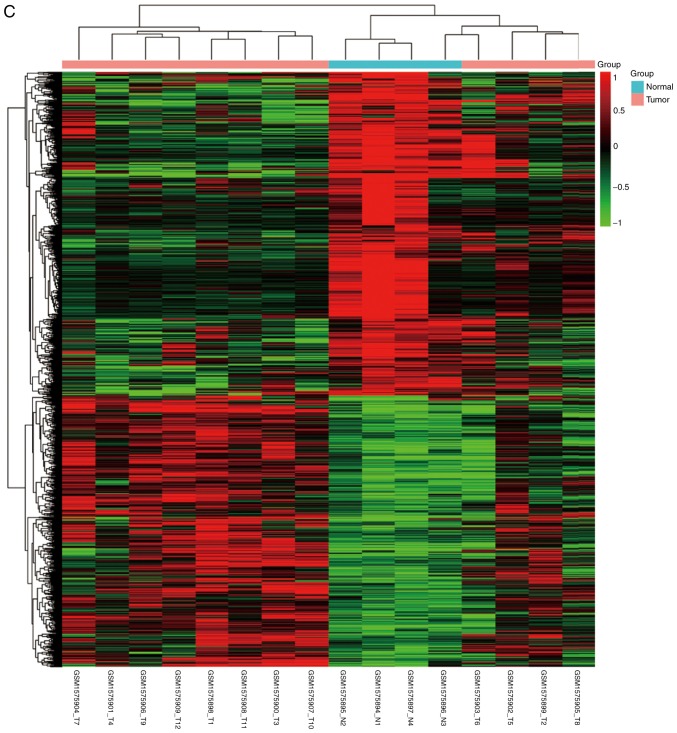
NPC and normal samples (59 and 17, respectively) were first analyzed. GeneSpring software was used to analyze the series of each chip and to identify the DEGs. Following analysis of GSE12452, GSE34573, GSE64634 datasets, 1,301 (553 upregulated and 748 downregulated), 1,232 (348 upregulated and 884 downregulated) and 1,218 (555 upregulated and 663 downregulated) genes were identified, respectively. The results of the cluster analysis of DEGs revealed significant differences between the normal nasopharyngeal tissue and NPC samples (Fig. 1). Using Venn diagram analysis, 268 DEGs (59 upregulated and 209 downregulated) in the intersection of the above three datasets were selected for further analysis (Fig. 2).
Figure 1.
Cluster analysis of DEGs. The abscissa represents different samples; the vertical axis represents clusters of DEGs. Red color represents downregulation; green color represents upregulation. Expression data are represented as normalized values (Z-scores). (A) GSE12452 and (B) GSE34573. (C) GSE64634. DEGs, differentially expressed genes.
Figure 2.
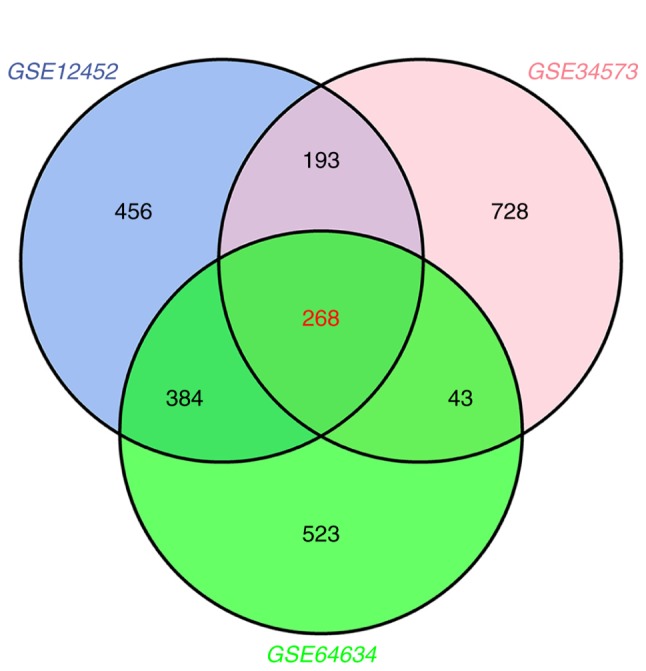
Venn diagram analysis of DEGs. The blue circle represents the GSE12452 dataset, the pink circle represents the GSE34573 dataset and the green circle represents the GSE64634 dataset. The intersection of the three circles represents overlapping DEGs among the three datasets. DEGs, differentially expressed genes.
GO term enrichment analysis
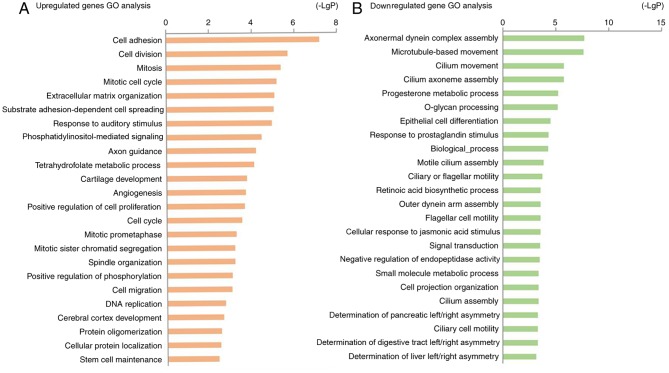
The identified DEGs were uploaded to the online software DAVID for GO and KEGG pathway analyses. The results of the GO analysis revealed that upregulated DEGs were significantly enriched in biological processes, including ‘cell adhesion’, ‘cell division’, ‘mitosis’, and ‘mitotic cell cycle’ (Table I; Fig. 3A). The downregulated DEGs were mainly enriched in ‘microtubule-based movement’, ‘cilium movement’, ‘cilium axoneme assembly’ and ‘epithelial cell differentiation’ (Table I; Fig. 3B). In terms of molecular function, the upregulated DEGs were enriched in ‘phosphatidylinositol-mediated signaling’, and the downregulated DEGs were enriched in ‘axonemal dynein complex assembly’ (Table I).
Table I.
Gene ontology analysis of differentially expressed genes associated with nasopharyngeal carcinoma.
| Gene name | Term/gene function | Gene count | P-value |
|---|---|---|---|
| FN1, ITGAV, ADAM23, DSG2, SSX2IP, COL5A1, LAMB1, CNTNAP2 | GO:0007155/cell adhesion | 8 | <0.01 |
| CCND2, HELLS, AURKA, SMC4, NDC80, HAUS6 | GO:0051301/cell division | 6 | <0.01 |
| HAUS6, NDC80, ANLN, AURKA, HELLS | GO:0007067/mitosis | 5 | <0.01 |
| SMC4, RFC4, NUP107, NDC80, TYMS, AURKA | GO:0000278/mitotic cell cycle | 6 | <0.01 |
| FN1, COL5A1, COL22A1, ITGAV, COL4A1 | GO:0030198/extracellular matrix organization | 5 | <0.01 |
| LAMB1, FZD7, FN1 | GO:0034446/substrate adhesion-dependent cell spreading | 3 | <0.01 |
| CXCL10, NTRK2 | GO:0010996/response to auditory stimulus | 2 | <0.01 |
| RFC4, NDC80, AURKA, TYMS | GO:0048015/phosphatidylinositol-mediated signaling | 4 | <0.01 |
| COL4A1, LHX2, LAMB1, ITGAV, COL5A1 | GO:0007411/axon guidance | 5 | <0.01 |
| TYMS, MTHFD2 | GO:0046653/tetrahydrofolate metabolic process | 2 | <0.01 |
| TYMS, HOXA3, PRRX1 | GO:0051216/cartilage development | 3 | <0.01 |
| FN1, COL4A1, ITGAV, HOXA3 | GO:0001525/angiogenesis | 4 | <0.01 |
| NTRK2, ARNT2, ITGAV, HOXA3, CXCL10 | GO:0008284/positive regulation of cell proliferation | 5 | <0.01 |
| RIF1, NDC80, CCND2, AURKA | GO:0007049/cell cycle | 4 | <0.01 |
| NUP107, SMC4, NDC80 | GO:0000236/mitotic prometaphase | 3 | <0.01 |
| SMC4, NDC80 | GO:0000070/mitotic sister chromatid segregation | 2 | <0.01 |
| AURKA, NDC80 | GO:0007051/spindle organization | 2 | <0.01 |
| FZD7, GRB10 | GO:0042327/positive regulation of phosphorylation | 2 | <0.01 |
| FN1, LAMB1, COL5A1 | GO:0016477/cell migration | 3 | <0.01 |
| RFC4, DTL, TYMS | GO:0006260/DNA replication | 3 | <0.01 |
| CNTNAP2, NTRK2 | GO:0021987/cerebral cortex development | 2 | <0.01 |
| GJA1, OLFM1 | GO:0051259/protein oligomerization | 2 | <0.01 |
| DMD, CNTNAP2 | GO:0034613/cellular protein localization | 2 | <0.01 |
| NTRK2 | GO:0048935/peripheral nervous system neuron development | 1 | 0.04 |
| NTRK2 | GO:0050773/regulation of dendrite development | 1 | 0.04 |
| DMD | GO:0060314/regulation of ryanodine-sensitive calcium-release channel activity | 1 | 0.04 |
| RIF1, DTL | GO:0006974/response to DNA damage stimulus | 2 | 0.04 |
| NTRK2, AURKA | GO:0046777/protein autophosphorylation | 2 | 0.04 |
| SRSF10 | GO:0006376/mRNA splice site selection | 1 | 0.04 |
| FZD7 | GO:0010812/negative regulation of cell-substrate adhesion | 1 | 0.04 |
| TFRC | GO:0045780/positive regulation of bone resorption | 1 | 0.04 |
| GJA1 | GO:0060174/limb bud formation | 1 | 0.04 |
| LHX2 | GO:2000678/negative regulation of transcription regulatory region DNA binding | 1 | 0.04 |
| NUP107, NDC80 | GO:0000090/mitotic anaphase | 2 | 0.05 |
| HELLS | GO:0001655/urogenital system development | 1 | 0.05 |
| GNLY | GO:0031640/killing of cells of other organism | 1 | 0.05 |
| CXCL10 | GO:0033280/response to vitamin D | 1 | 0.05 |
| SRSF10 | GO:0048025/negative regulation of mRNA splicing, via spliceosome | 1 | 0.05 |
| DSG2 | GO:0086005/regulation of ventricular cardiac muscle cell action potential | 1 | 0.05 |
| DNAAF1, DNAAF3, DRC1, CCDC39 | GO:0070286/axonemal dynein complex assembly | 4 | <0.01 |
| DNAH12, DNAH5, DNAH9, DYNLRB2, DYNC2H1, DNAH10, KIF9 | GO:0007018/microtubule-based movement | 7 | <0.01 |
| RSPH4A, RSPH9, DNAAF1 | GO:0003341/cilium movement | 3 | <0.01 |
| AK7, RSPH4A, RSPH9 | GO:0035083/cilium axoneme assembly | 3 | <0.01 |
| AKR1C2, AKR1C3, DHRS9 | GO:0042448/progesterone metabolic process | 3 | <0.01 |
| MUC4, MUC16, MUC5AC, MUC1, MUC20 | GO:0016266/O-glycan processing | 5 | <0.01 |
| ELF3, DHRS9, EZR, UPK1B | GO:0030855/epithelial cell differentiation | 4 | <0.01 |
| AKR1C3, AKR1C2 | GO:0034694/response to prostaglandin stimulus | 2 | <0.01 |
| ANKRD45, CFAP53, SORBS2, SCGB2A1, TMEM125, DNAH5, MUC4, MSMB, RSPH14, LRRC34, VNN3 | GO:0008150/biological_process | 11 | <0.01 |
| DNAAF1, DNAAF3 | GO:0044458/motile cilium assembly | 2 | <0.01 |
| DYNC2H1, ROPN1L, DNAH5 | GO:0001539/ciliary or flagellar motility | 3 | <0.01 |
| RDH10, DHRS9 | GO:0002138/retinoic acid biosynthetic process | 2 | <0.01 |
| DNAAF1, CCDC114 | GO:0036158/outer dynein arm assembly | 2 | <0.01 |
| DRC1, CCDC39 | GO:0060286/flagellar cell motility | 2 | <0.01 |
| AKR1C2, AKR1C3 | GO:0071395/cellular response to jasmonic acid stimulus | 2 | <0.01 |
| GPRC5A, CDS1, CALM1, RIIAD1, CCL15, EPAS1, CHL1, RRAD, ROPN1L, CEACAM6, GNAL, SCGB1A1, CAPN5 | GO:0007165/signal transduction | 13 | <0.01 |
| SERPINB4, WFDC2, SLPI, SERPINB3 | GO:0010951/negative regulation of endopeptidase activity | 4 | <0.01 |
| CHST6, CKB, ADH1C, CALM1, AKR1C3, SGMS2, ASS1, NQO1, SLC44A4, CHST9, CDS1, AK1, DHCR24, CH25H, GSTA1 | GO:0044281/small molecule metabolic process | 15 | <0.01 |
| SPAG6, DNAH9, PIFO | GO:0030030/cell projection organization | 3 | <0.01 |
| DYNC2H1, DNAI2, B9D1, CC2D2A | GO:0042384/cilium assembly | 4 | <0.01 |
| CCDC39, DNAAF1 | GO:0035469/determination of pancreatic left/right asymmetry | 2 | <0.01 |
| DRC1, CCDC39 | GO:0060285/ciliary cell motility | 2 | <0.01 |
| CCDC39, DNAAF1 | GO:0071907/determination of digestive tract left/right asymmetry | 2 | <0.01 |
| CCDC39, DNAAF1 | GO:0071910/determination of liver left/right asymmetry | 2 | <0.01 |
DEGs, differentially expressed genes.
Figure 3.
Enriched GO functions of DEGs. (A) Upregulated genes GO analysis. (B) Downregulated genes GO analysis. GO, gene ontology; DEGs, differentially expressed genes.
KEGG pathway analysis
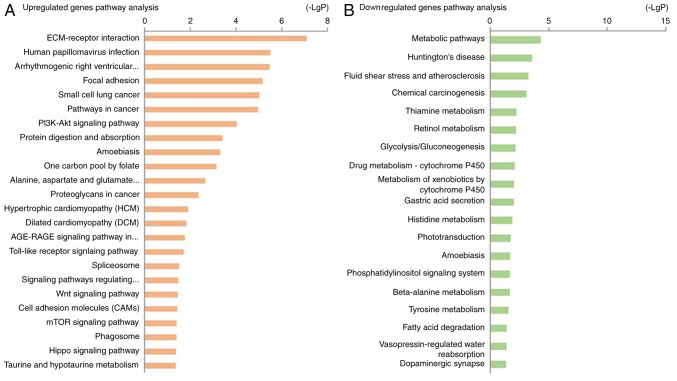
KEGG pathway analysis revealed that the upregulated DEGs were highly associated with pathways including ‘ECM-receptor interaction’, ‘human papillomavirus infection’, ‘arrhythmogenic right ventricular cardiomyopathy’ and ‘focal adhesion’ (Table II; Fig. 4A). The downregulated DEGs were enriched in ‘metabolic pathways’, ‘Huntington's disease’, ‘fluid shear stress’, ‘atherosclerosis’ and ‘chemical carcinogenesis’ (Table II; Fig. 4B).
Table II.
Kyoto Encyclopedia Analysis of Genes and Genomes pathway analysis of DEGs associated with nasopharyngeal carcinoma.
| Pathway ID | Name | Gene count | P-value | Genes |
|---|---|---|---|---|
| 04512 | ECM-receptor interaction | 5 | <0.01 | ITGAV, COL4A1, FN1, HMMR, LAMB1 |
| 05165 | Human papillomavirus infection | 6 | <0.01 | FZD7, ITGAV, LAMB1, CCND2, COL4A1, FN1 |
| 05412 | Arrhythmogenic right ventricular cardiomyopathy | 4 | <0.01 | DMD, GJA1, ITGAV, DSG2 |
| 04510 | Focal adhesion | 5 | <0.01 | LAMB1, FN1, ITGAV, CCND2, COL4A1 |
| 05222 | Small cell lung cancer | 4 | <0.01 | ITGAV, FN1, COL4A1, LAMB1 |
| 05200 | Pathways in cancer | 6 | <0.01 | ARNT2, FN1, LAMB1, FZD7, COL4A1, ITGAV |
| 04151 | PI3K-Akt signaling pathway | 5 | <0.01 | FN1, COL4A1, CCND2, ITGAV, LAMB1 |
| 04974 | Protein digestion and absorption | 3 | <0.01 | COL22A1, COL4A1, COL5A1 |
| 05146 | Amoebiasis | 3 | <0.01 | LAMB1, COL4A1, FN1 |
| 00670 | One carbon pool by folate | 2 | <0.01 | MTHFD2, TYMS |
| 00250 | Alanine, aspartate and glutamate metabolism | 2 | <0.01 | GAD1, ASNS |
| 05205 | Proteoglycans in cancer | 3 | <0.01 | FZD7, FN1, ITGAV |
| 05410 | Hypertrophic cardiomyopathy | 2 | 0.01 | ITGAV, DMD |
| 05414 | Dilated cardiomyopathy | 2 | 0.01 | DMD, ITGAV |
| 04933 | AGE-RAGE signaling pathway in diabetic complications | 2 | 0.02 | FN1, COL4A1 |
| 04620 | Toll-like receptor signaling pathway | 2 | 0.02 | CXCL11, CXCL10 |
| 03040 | Spliceosome | 2 | 0.03 | U2SURP, SRSF10 |
| 04550 | Signaling pathways regulating pluripotency of stem cells | 2 | 0.03 | FZD7, RIF1 |
| 04310 | Wnt signaling pathway | 2 | 0.04 | FZD7, CCND2 |
| 04514 | Cell adhesion molecules (CAMs) | 2 | 0.04 | ITGAV, CNTNAP2 |
| 04150 | mTOR signaling pathway | 2 | 0.04 | GRB10, FZD7 |
| 04145 | Phagosome | 2 | 0.04 | ITGAV, TFRC |
| 04390 | Hippo signaling pathway | 2 | 0.04 | FZD7, CCND2 |
| 00430 | Taurine and hypotaurine metabolism | 1 | 0.04 | GAD1 |
| 01100 | Metabolic pathways | 16 | <0.01 | DHRS9, CDS1, CKB, AK7, ADH1C, RDH10, SGMS2, DHCR24, AK1, ALDH3A1, AK9, ALDH3A2, ASS1, ST6GALNAC1, CHST9, AKR1C3 |
| 05016 | Huntington's disease | 6 | <0.01 | DNALI1, DNAI2, DNAH10, DNAH12, DNAH9, DNAH5 |
| 05418 | Fluid shear stress and atherosclerosis | 5 | <0.01 | CALM1, NQO1, CALML4, ASS1, GSTA1 |
| 05204 | Chemical carcinogenesis | 4 | <0.01 | ALDH3A1, AKR1C2, ADH1C, GSTA1 |
| 00730 | Thiamine metabolism | 2 | 0.01 | AK7, AK1 |
| 00830 | Retinol metabolism | 3 | 0.01 | DHRS9, RDH10, ADH1C |
| 00010 | Glycolysis/Gluconeogenesis | 3 | 0.01 | ALDH3A1, ALDH3A2, ADH1C |
| 00982 | Drug metabolism-cytochrome P450 | 3 | 0.01 | GSTA1, ALDH3A1, ADH1C |
| 00980 | Metabolism of xenobiotics by cytochrome P450 | 3 | 0.01 | ALDH3A1, ADH1C, GSTA1 |
| 04971 | Gastric acid secretion | 3 | 0.01 | CALML4, EZR, CALM1 |
| 00340 | Histidine metabolism | 2 | 0.01 | ALDH3A1, ALDH3A2 |
| 04744 | Phototransduction | 2 | 0.02 | CALML4, CALM1 |
| 05146 | Amoebiasis | 3 | 0.02 | SERPINB4, GNAL, SERPINB3 |
| 04070 | Phosphatidylinositol signaling system | 3 | 0.02 | CDS1, CALM1, CALML4 |
| 00410 | β-alanine metabolism | 2 | 0.02 | ALDH3A1, ALDH3A2 |
| 00350 | Tyrosine metabolism | 2 | 0.03 | ALDH3A1, ADH1C |
| 00071 | Fatty acid degradation | 2 | 0.04 | ADH1C, ALDH3A2 |
| 04962 | Vasopressin-regulated water reabsorption | 2 | 0.04 | AQP3, DYNC2H1 |
| 04728 | Dopaminergic synapse | 3 | 0.04 | CALM1, GNAL, CALML4 |
DEGs, differentially expressed genes.
Figure 4.
KEGG pathway analysis of differentially expressed genes. (A) Upregulated genes KEGG pathway analysis. (B) Downregulated genes KEGG pathway analysis. KEGG, Kyoto Encyclopedia of Genes and Genomes.
PPI network
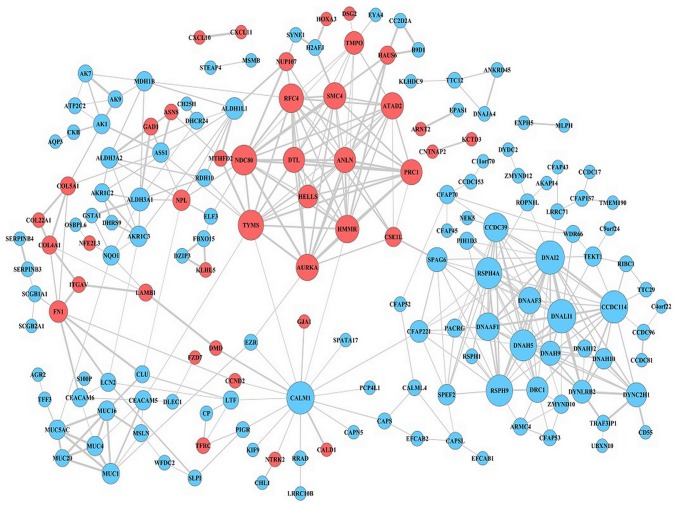
The DEG expression profiles in NPC were constructed according to the information in the STRING database. Following the elimination of isolated and partially connected nodes, a network of DEGs was constructed (Fig. 5). The top 10 hub genes, which were the genes exhibiting the most significant interaction, included dynein axonemal light intermediate chain 1 (DNALI1), dynein axonemal intermediate chain 2 (DNAI2), calmodulin 1 (CALM1), coiled-coil domain containing 114 (CCDC114), dynein axonemal heavy chain 5 (DNAH5), radial spoke head 9 homolog (RSPH9), radial spoke head component 4A (RSPH4A), NDC80 kinetochore complex component (NDC80), thymidylate synthetase (TYMS) and coiled-coil domain containing 39 (CCDC39). DNALI1 demonstrated the highest node degree of 18.
Figure 5.
Protein-protein interaction network of differentially expressed genes. Red nodes represent upregulated genes, light blue nodes represent downregulated genes.
Discussion
NPC is one of the most common squamous cell tumors in the head and neck (1). The 5-year survival rate among patients with stage I disease is 95% (3). However, the 5-year survival rate among patients with stage IV disease is just over 60% (27). Therefore, understanding the etiological factors and molecular mechanisms of NPC progression is essential for diagnosis and treatment. Microarray technology has been widely applied to predict the potential therapeutic targets for carcinoma, including colorectal cancer (12–14). Previously, Wang et al (15) analyzed the GSE12452 dataset and revealed that cyclin B1, mitotic arrest deficient 2 like 1, proliferating cell nuclear antigen, mucin 1, cell surface associated and aldehyde dehydrogenase 1 family member A1 may be involved in EBV-associated NPC (15). A study analyzing the GSE12452 dataset suggested that C-X-C motif chemokine ligand (CXCL) 9, ZIC family member 2, prostaglandin-endoperoxide synthase 2, fibronectin 1, CXCL10 and ovo like transcriptional repressor 1 may serve roles in NPC (16). However, the number of samples from individual datasets was relatively small (15,16). In the current study, 3 datasets were analyzed and 53 upregulated and 209 downregulated DEGs were screened by bioinformatics analysis.
The results of the KEGG pathway enrichment analysis and GO function annotation revealed that upregulated DEGs were mainly enriched in ‘cell adhesion’, ‘cell division’, ‘mitosis,’ ‘mitotic cell cycle’, ‘ECM-receptor interaction’ and ‘human papillomavirus infection’, whereas downregulated DEGs were mainly involved in ‘axonemal dynein complex assembly’, ‘microtubule-based movement’, ‘metabolic pathways’, ‘Huntington's disease’, ‘fluid shear stress’ and ‘atherosclerosis’ and ‘chemical carcinogenesis’. Previous studies have demonstrated that upregulation or downregulation of specific genes may affect NPC cell invasion, metastasis, proliferation and apoptosis (28–30). This result is consistent with the fact that carcinoma cell invasion and metastasis are closely associated with abnormal cell adhesion and cell division (28–30). Furthermore, cancer cell proliferation and apoptosis are closely associated with abnormalities in the mitotic cell cycle (28–30). A previous study indicated that colorectal cancer cells interact with stromal cells by producing ECM components, mediating direct cell-cell contact and secreting growth factors (31). Furthermore, existing evidence has demonstrated that the modification of cellular DNA and histones is caused by intermediates of cellular metabolic pathways (32). Therefore, analysis of the signaling pathways involved may provide new insights for understanding cancer cell proliferation.
In the present study, a PPI network was constructed to identify the 10 most significant hub genes. These were as follows: DNALI1, DNAI2, CALM1, CCDC114, DNAH5, RSPH9, RSPH4A, NDC80, TYMS, and CCDC39. DNALI1 was the hub gene exhibiting the highest degree of connectivity. Peng et al (33) revealed that the mRNA levels of DNALI1 were significantly reduced in patients with allergic nasal mucosa compared with controls (P<0.05). Parris et al (34) reported that several malignant tumors with normal gene dosage levels displayed DNALI1 downregulation, suggesting that DNALI1 may be a novel therapeutic target for cancer drug development. The second hub gene identified, DNAI2, which is also protein encoding, is associated with primary ciliary dyskinesia (PCD) (35). DNAI2 and forkhead box J1 are ciliated cell markers (36). The third hub gene, CALM1, is one of genes encoding the calmodulin protein (37). Kim et al (38) conducted large-scale genome analyses for breast cancer, and the results indicated that, as a potential regulator of protein kinase B, CALM1 was highly expressed in phosphatidylinositol-4,5-bisphosphate 3-kinase catalytic subunit α-mutated breast cancer. Furthermore, calcium-binding proteins CALM1, calumenin and reticulocalbin 1, were significantly upregulated in irradiated tumor cells, which were subjected to hypoxia, indicating that these mediators serve important roles in promoting tumor cell survival during hypoxia (39). Similar to DNAI2, CCDC114 is one of the PCD-associated genes, in which loss-of-function mutations result in PCD with laterality malformations involving heart defects (40). The absence or mislocalization of another hub gene, DNAH5, is a characteristic marker for motile ciliary abnormality in nasal polyps (41). The remaining five hub genes in the present study were RSPH9, RSPH4A, NDC80, TYMS and CCDC39. Yoon et al (42) reported that the RSPH9 methylation pattern is a prognostic indicator in patients with nonmuscle invasive bladder cancer. RSPH9 and RSPH4A are radial spoke head protein genes, wherein mutations cause primary ciliary dyskinesia with central-microtubular-pair abnormalities (43). TYMS is a key enzyme in the de novo synthesis of 2′-deoxythymidine-5′-monophosphate from 2′-deoxyuridine-5′-monophosphate (44). CCDC39 and CCDC40 were first identified as causative mutations in patients with primary ciliary dyskinesia and are likely to be involved in the recruitment of tubulin glutamylase(s) to the flagella (45), which has not been identified to be associated with the development of NPC.
In conclusion, the present study conducted a comprehensive bioinformatics analysis of DEGs which may be involved in NPC progression. The results may provide novel insights into targets that can be used for the future investigation of molecular mechanisms underlying NPC. However, the specific functions of the identified genes in NPC should be confirmed by further molecular biological experiments.
Acknowledgements
Not applicable.
Glossary
Abbreviations
- NPC
nasopharyngeal carcinoma
- GO
gene ontology
- KEGG
Kyoto Encyclopedia of Genes and Genomes
- PPI
protein-protein interaction
- DEGs
differentially expressed genes
- EBV
Epstein-Barr virus
- GEO
Gene Expression Omnibus
- DAVID
Database for Annotation, Visualization, and Integrated Discovery
- STRING
Search Tool for the Retrieval of Interacting Genes
- DNALI1
dynein axonemal light intermediate chain 1
- DNAI2
dynein axonemal intermediate chain 2
- CALM1
calmodulin 1
- CCDC114
coiled-coil domain containing 114
- DNAH5
dynein axonemal heavy chain 5
- RSPH9
radial spoke head 9 homolog
- RSPH4A
radial spoke head component 4A
- NDC80
NDC80 kinetochore complex component
- TYMS
thymidylate synthetase
- CCDC39
coiled-coil domain containing 39
- PCD
primary ciliary dyskinesia
Funding
No funding was received.
Availability of data and materials
The datasets used during the present study are available from the corresponding author upon reasonable request.
Authors' contributions
HMZ and QF conceived and designed the study. HMZ, QF, LXQ, BLL, LY and XH performed the bioinformatics analysis. LXQ and BLL analyzed the data. HMZ and QF wrote the manuscript. LY and XH reviewed and checked the manuscript. All authors read and approved the final manuscript.
Ethics approval and consent to participate
Not applicable.
Patient consent for publication
Not applicable.
Competing interests
The authors declare that they have no competing interests.
References
- 1.Chua MLK, Wee JTS, Hui EP, Chan ATC. Nasopharyngeal carcinoma. Lancet. 2016;387:1012–1024. doi: 10.1016/S0140-6736(15)00055-0. [DOI] [PubMed] [Google Scholar]
- 2.Li K, Lin GZ, Shen JC, Zhou Q. Time trends of nasopharyngeal carcinoma in urban Guangzhou over a 12-year period (2000–2011): Declines in both incidence and mortality. Asian Pac J Cancer Prev. 2014;15:9899–9903. doi: 10.7314/APJCP.2014.15.22.9899. [DOI] [PubMed] [Google Scholar]
- 3.Lee AW, Sze WM, Au JS, Leung SF, Leung TW, Chua DT, Zee BC, Law SC, Teo PM, Tung SY, et al. Treatment results for nasopharyngeal carcinoma in the modern era: The Hong Kong experience. Int J Radiat Oncol Biol Phys. 2005;61:1107–1116. doi: 10.1016/j.ijrobp.2004.07.702. [DOI] [PubMed] [Google Scholar]
- 4.Jing L, Zou X, Wu YL, Guo JC, Yun JP, Xu M, Feng QS, Chen LZ, Bei JX, Zeng YX, Chen MY. A comparison between the Sixth and seventh editions of the UICC/AJCC staging system for nasopharyngeal carcinoma in a Chinese cohort. PLoS One. 2014;9:e116261. doi: 10.1371/journal.pone.0116261. [DOI] [PMC free article] [PubMed] [Google Scholar]
- 5.Pan JJ, Ng WT, Zong JF, Lee SW, Choi HC, Chan LL, Lin SJ, Guo QJ, Sze HC, Chen YB, et al. Prognostic nomogram for refining the prognostication of the proposed 8th edition of the AJCC/UICC staging system for nasopharyngeal cancer in the era of intensity-modulated radiotherapy. Cancer. 2016;122:3307–3315. doi: 10.1002/cncr.29795. [DOI] [PMC free article] [PubMed] [Google Scholar]
- 6.Chan KCA, WOO JKS, King A, Zee BCY, Lam WKJ, Chan SL, Chu SWI, Mak C, Tse IOL, Leung SYM, et al. Analysis of plasma Epstein-Barr virus DNA to screen for nasopharyngeal cancer. New Engl J Med. 2017;377:513–522. doi: 10.1056/NEJMoa1701717. [DOI] [PubMed] [Google Scholar]
- 7.Tulalamba W, Janvilisri T. Nasopharyngeal carcinoma signaling pathway: An update on molecular biomarkers. Int J Cell Biol. 2012;2012:594681. doi: 10.1155/2012/594681. [DOI] [PMC free article] [PubMed] [Google Scholar]
- 8.Huang G, Du MY, Zhu H, Zhang N, Lu ZW, Qian LX, Zhang W, Tian X, He X, Yin L. MiRNA-34a reversed TGF-β-induced epithelial-mesenchymal transition via suppression of SMAD4 in NPC cells. Biomed Pharmacother. 2018;106:217–224. doi: 10.1016/j.biopha.2018.06.115. [DOI] [PubMed] [Google Scholar]
- 9.Zhu HM, Jiang XS, Li HZ, Qian LX, Du MY, Lu ZW, Wu J, Tian XK, Fei Q, He X, Yin L. miR-184 inhibits tumor invasion, migration and metastasis in nasopharyngeal carcinoma by targeting Notch2. Cell Physiol Biochem. 2018;49:1564–1576. doi: 10.1159/000493459. [DOI] [PubMed] [Google Scholar]
- 10.Coghill AE, Hsu WL, Pfeiffer RM, Juwana H, Yu KJ, Lou PJ, Wang CP, Chen JY, Chen CJ, Middeldorp JM, Hildesheim A. Epstein-Barr virus serology as a potential screening marker for nasopharyngeal carcinoma among high-risk individuals from multiplex families in Taiwan. Cancer Epidemiol Biomarkers Prev. 2014;23:1213–1219. doi: 10.1158/1055-9965.EPI-13-1262. [DOI] [PMC free article] [PubMed] [Google Scholar]
- 11.Ng WT, Yau TK, Yung RW, Sze WM, Tsang AH, Law AL, Lee AW. Screening for family members of patients with nasopharyngeal carcinoma. Int J Cancer. 2005;113:998–1001. doi: 10.1002/ijc.20672. [DOI] [PubMed] [Google Scholar]
- 12.Kulasingam V, Diamandis EP. Strategies for discovering novel cancer biomarkers through utilization of emerging technologies. Nat Clin Pract Oncol. 2008;5:588–599. doi: 10.1038/ncponc1187. [DOI] [PubMed] [Google Scholar]
- 13.Nannini M, Pantaleo MA, Maleddu A, Astolfi A, Formica S, Biasco G. Gene expression profiling in colorectal cancer using microarray technologies: Results and perspectives. Cancer Treat Rev. 2009;35:201–209. doi: 10.1016/j.ctrv.2008.10.006. [DOI] [PubMed] [Google Scholar]
- 14.Bustin SA, Dorudi S. Gene expression profiling for molecular staging and prognosis prediction in colorectal cancer. Expert Rev Mol Diagn. 2004;4:599–607. doi: 10.1586/14737159.4.5.599. [DOI] [PubMed] [Google Scholar]
- 15.Wang J, Mei F, Gao X, Wang S. Identification of genes involved in Epstein-Barr virus-associated nasopharyngeal carcinoma. Oncol Lett. 2016;12:2375–2380. doi: 10.3892/ol.2016.4940. [DOI] [PMC free article] [PubMed] [Google Scholar]
- 16.Jiang X, Feng L, Dai B, Li L, Lu W. Identification of key genes involved in nasopharyngeal carcinoma. Braz J Otorhinolaryngol. 2017;83:670–676. doi: 10.1016/j.bjorl.2016.09.003. [DOI] [PMC free article] [PubMed] [Google Scholar]
- 17.Sengupta S, den Boon JA, Chen IH, Newton MA, Dahl DB, Chen M, Cheng YJ, Westra WH, Chen CJ, Hildesheim A, et al. Genome-wide expression profiling reveals EBV-associated inhibition of MHC Class I expression in nasopharyngeal carcinoma. Cancer Res. 2006;66:7999–8006. doi: 10.1158/0008-5472.CAN-05-4399. [DOI] [PubMed] [Google Scholar]
- 18.Hu C, Wei W, Chen X, Woodman CB, Yao Y, Nicholls JM, Joab I, Sihota SK, Shao JY, Derkaoui KD, et al. A global view of the oncogenic landscape in nasopharyngeal carcinoma: An integrated analysis at the genetic and expression levels. PLoS One. 2012;7:e41055. doi: 10.1371/journal.pone.0041055. [DOI] [PMC free article] [PubMed] [Google Scholar]
- 19.Bo H, Gong Z, Zhang W, Li X, Zeng Y, Liao Q, Chen P, Shi L, Lian Y, Jing Y, et al. Upregulated long non-coding RNA AFAP1-AS1 expression is associated with progression and poor prognosis of nasopharyngeal carcinoma. Oncotarget. 2015;6:20404–20418. doi: 10.18632/oncotarget.4057. [DOI] [PMC free article] [PubMed] [Google Scholar]
- 20.Tweedie S, Ashburner M, Falls K, Leyland P, McQuilton P, Marygold S, Millburn G, Osumi-Sutherland D, Schroeder A, Seal R, et al. FlyBase: Enhancing Drosophila gene ontology annotations. Nucleic Acids Res. 2009;37:D555–D559. doi: 10.1093/nar/gkn788. (Database Issue) [DOI] [PMC free article] [PubMed] [Google Scholar]
- 21.Kanehisa M, Goto S. KEGG: Kyoto encyclopedia of genes and genomes. Nucleic Acids Res. 2000;28:27–30. doi: 10.1093/nar/28.1.27. [DOI] [PMC free article] [PubMed] [Google Scholar]
- 22.Dennis G, Jr, Sherman BT, Hosack DA, Yang J, Gao W, Lane HC, Lempicki RA. DAVID: Database for annotation, visualization, and integrated discovery. Genome Biol. 2003;4:P3. doi: 10.1186/gb-2003-4-5-p3. [DOI] [PubMed] [Google Scholar]
- 23.Huang da W, Sherman BT, Lempicki RA. Systematic and integrative analysis of large gene lists using DAVID bioinformatics resources. Nat Protoc. 2009;4:44–57. doi: 10.1038/nprot.2008.211. [DOI] [PubMed] [Google Scholar]
- 24.Szklarczyk D, Franceschini A, Wyder S, Forslund K, Heller D, Huerta-Cepas J, Simonovic M, Roth A, Santos A, Tsafou KP, et al. STRING v10: Protein-protein interaction networks, integrated over the tree of life. Nucleic Acids Res. 2015;43:D447–D452. doi: 10.1093/nar/gku1003. (Database Issue) [DOI] [PMC free article] [PubMed] [Google Scholar]
- 25.Franceschini A, Szklarczyk D, Frankild S, Kuhn M, Simonovic M, Roth A, Lin J, Minguez P, Bork P, von Mering C, Jensen LJ. STRING v9. 1: Protein-protein interaction networks, with increased coverage and integration. Nucleic Acids Res. 2013;41:D808–D815. doi: 10.1093/nar/gks1094. (Database Issue) [DOI] [PMC free article] [PubMed] [Google Scholar]
- 26.Shannon P, Markiel A, Ozier O, Baliga NS, Wang JT, Ramage D, Amin N, Schwikowski B, Ideker T. Cytoscape: A software environment for integrated models of biomolecular interaction networks. Genome Res. 2003;13:2498–2504. doi: 10.1101/gr.1239303. [DOI] [PMC free article] [PubMed] [Google Scholar]
- 27.Li J, Zou X, Wu YL, Guo JC, Yun JP, Xu M, Feng QS, Chen LZ, Bei JX, Zeng YX, Chen MY. A Comparison between the Sixth and Seventh Editions of the UICC/AJCC staging System for nasopharyngeal carcinoma in a Chinese cohort. PLoS One. 2014;9:e116261. doi: 10.1371/journal.pone.0116261. [DOI] [PMC free article] [PubMed] [Google Scholar]
- 28.Qi XK, Han HQ, Zhang HJ, Xu M, Li L, Chen L, Xiang T, Feng QS, Kang T, Qian CN, et al. OVOL2 links stemness and metastasis via fine-tuning epithelial-mesenchymal transition in nasopharyngeal carcinoma. Theranostics. 2018;8:2202–2216. doi: 10.7150/thno.24003. [DOI] [PMC free article] [PubMed] [Google Scholar]
- 29.Gao Q, Tang L, Wu L, Li K, Wang H, Li W, Wu J, Li M, Wang S, Zhao L. LASP1 promotes nasopharyngeal carcinoma progression through negatively regulation of the tumor suppressor PTEN. Cell Death Dis. 2018;9:393. doi: 10.1038/s41419-018-0443-y. [DOI] [PMC free article] [PubMed] [Google Scholar]
- 30.Ren X, Yang X, Cheng B, Chen X, Zhang T, He Q, Li B, Li Y, Tang X, Wen X, et al. HOPX hypermethylation promotes metastasis via activating SNAIL transcription in nasopharyngeal carcinoma. Nat Commun. 2017;8:14053. doi: 10.1038/ncomms14053. [DOI] [PMC free article] [PubMed] [Google Scholar]
- 31.Vicente CM, Ricci R, Nader HB, Toma L. Syndecan-2 is upregulated in colorectal cancer cells through interactions with extracellular matrix produced by stromal fibroblasts. BMC Cell Biol. 2013;14:25. doi: 10.1186/1471-2121-14-25. [DOI] [PMC free article] [PubMed] [Google Scholar]
- 32.Schvartzman JM, Thompson CB, Finley LWS. Metabolic regulation of chromatin modifications and gene expression. J Cell Biol. 2018;217:2247–2259. doi: 10.1083/jcb.201803061. [DOI] [PMC free article] [PubMed] [Google Scholar]
- 33.Peng Y, Chen Z, Guan WJ, Zhu Z, Tan KS, Hong H, Zi X, Zeng J, Li Y, Ong YK, et al. Downregulation and aberrant localization of Forkhead Box J1 in allergic nasal mucosa. Int Arch Allergy Immunol. 2018;176:115–123. doi: 10.1159/000488014. [DOI] [PubMed] [Google Scholar]
- 34.Parris TZ, Danielsson A, Nemes S, Kovács A, Delle U, Fallenius G, Möllerström E, Karlsson P, Helou K. Clinical implications of gene dosage and gene expression patterns in diploid breast carcinoma. Clin Cancer Res. 2010;16:3860–3874. doi: 10.1158/1078-0432.CCR-10-0889. [DOI] [PubMed] [Google Scholar]
- 35.Fedick AM, Jalas C, Treff NR, Knowles MR, Zariwala MA. Carrier frequencies of eleven mutations in eight genes associated with primary ciliary dyskinesia in the Ashkenazi Jewish population. Mol Genet Genomic Med. 2015;3:137–142. doi: 10.1002/mgg3.124. [DOI] [PMC free article] [PubMed] [Google Scholar]
- 36.Milara J, Armengot M, Bañuls P, Tenor H, Beume R, Artigues E, Cortijo J. Roflumilast N-oxide, a PDE4 inhibitor, improves cilia motility and ciliated human bronchial epithelial cells compromised by cigarette smoke in vitro. Br J Pharmacol. 2012;166:2243–2262. doi: 10.1111/j.1476-5381.2012.01929.x. [DOI] [PMC free article] [PubMed] [Google Scholar]
- 37.Weile J, Sun S, Cote AG, Knapp J, Verby M, Mellor JC, Wu Y, Pons C, Wong C, van Lieshout N, et al. A framework for exhaustively mapping functional missense variants. Mol Syst Biol. 2017;13:957. doi: 10.15252/msb.20177908. [DOI] [PMC free article] [PubMed] [Google Scholar]
- 38.Kim JY, Lee E, Park K, Park WY, Jung HH, Ahn JS, Im YH, Park YH. Clinical implications of genomic profiles in metastatic breast cancer with a focus on TP53 and PIK3CA, the most frequently mutated genes. Oncotarget. 2017;8:27997–28007. doi: 10.18632/oncotarget.15881. [DOI] [PMC free article] [PubMed] [Google Scholar]
- 39.Ren Y, Yeoh KW, Hao P, Kon OL, Sze SK. Irradiation of epithelial carcinoma cells upregulates calcium-binding proteins that promote survival under hypoxic conditions. J Proteome Res. 2016;15:4258–4264. doi: 10.1021/acs.jproteome.6b00340. [DOI] [PubMed] [Google Scholar]
- 40.Onoufriadis A, Paff T, Antony D, Shoemark A, Micha D, Kuyt B, Schmidts M, Petridi S, Dankert-Roelse JE, Haarman EG, et al. Splice-site mutations in the axonemal outer dynein arm docking complex gene CCDC114 cause primary ciliary dyskinesia. Am J Hum Genet. 2013;92:88–98. doi: 10.1016/j.ajhg.2012.11.002. [DOI] [PMC free article] [PubMed] [Google Scholar]
- 41.Qiu Q, Peng Y, Zhu Z, Chen Z, Zhang C, Ong HH, Tan KS, Hong H, Yan Y, Huang H, et al. Absence or mislocalization of DNAH5 is a characteristic marker for motile ciliary abnormality in nasal polyps. Laryngoscope. 2018;128:E97–E104. doi: 10.1002/lary.26983. [DOI] [PubMed] [Google Scholar]
- 42.Yoon HY, Kim YJ, Kim JS, Kim YW, Kang HW, Kim WT, Yun SJ, Ryu KH, Lee SC, Kim WJ. RSPH9 methylation pattern as a prognostic indicator in patients with non-muscle invasive bladder cancer. Oncol Rep. 2016;35:1195–1203. doi: 10.3892/or.2015.4409. [DOI] [PubMed] [Google Scholar]
- 43.Castleman VH, Romio L, Chodhari R, Hirst RA, de Castro SC, Parker KA, Ybot-Gonzalez P, Emes RD, Wilson SW, Wallis C, et al. Mutations in radial spoke head protein genes RSPH9 and RSPH4A cause primary ciliary dyskinesia with central-microtubular-pair abnormalities. Am J Hum Genet. 2009;84:197–209. doi: 10.1016/j.ajhg.2009.01.011. [DOI] [PMC free article] [PubMed] [Google Scholar]
- 44.Wang X, Guan Z, Dong Y, Zhu Z, Wang J, Niu B. Inhibition of thymidylate synthase affects neural tube development in mice. Reprod Toxicol. 2018;76:17–25. doi: 10.1016/j.reprotox.2017.12.007. [DOI] [PubMed] [Google Scholar]
- 45.Lin H, Zhang Z, Guo S, Chen F, Kessler JM, Wang YM, Dutcher SK. A NIMA-related kinase suppresses the flagellar instability associated with the loss of multiple axonemal structures. PLoS Genet. 2015;11:e1005508. doi: 10.1371/journal.pgen.1005508. [DOI] [PMC free article] [PubMed] [Google Scholar]
Associated Data
This section collects any data citations, data availability statements, or supplementary materials included in this article.
Data Availability Statement
The datasets used during the present study are available from the corresponding author upon reasonable request.


