Abstract
Nasopharyngeal carcinoma (NPC), arising from the nasopharynx epithelium, is prevalent among South and East Asia. The radiotherapy is the primary treatment for NPC patients. However, the acquired radioresistance dramatically diminishes the therapeutic effect of radiotherapy. Meanwhile, recurrence and metastasis always occur in line with the radioresistance, but the underlying mechanisms are still unclear. In this study, we established two radioresistant NPC cell lines, CNE1R and SUNE1R, by sequentially irradiated parental CNE1 and SUNE1 cells up to a clinical treatment dose of 72 Gy. A transcriptome profile analysis of CNE1R and CNE1 reveals that activated oncogenic pathways are highly enriched in CNE1R. As the result, CNE1R showed higher proliferation rate but lower apoptosis rate after irradiation, and enhanced metastasis ability in comparison with CNE1. Significantly, a group of metastasis associated genes were increased in CNE1R while the irradiation proceeded, including several matrix metallopeptidase (MMP) members, especially MMP10 and MMP13. With further analysis, we found both MMP10 and MMP13 are highly upregulated in metastatic head and neck cancer specimens compared to non-metastatic ones. More importantly, patients with lower expression of both MMP10 and MMP13 showed a better five-year survival than the double high group. Our findings unveiled the potential mechanisms of radioresistance related metastasis in NPC patients, and the increase of MMP10 and MMP13 may serve as high risk factors for metastasis during radiotherapy.
Keywords: Nasopharyngeal carcinoma, head and neck squamous cell carcinoma, radioresistance, metastasis, matrix metallopeptidase
Introduction
Nasopharyngeal carcinoma (NPC) is a kind of head and neck cancers arising from the nasopharynx epithelium. With a unique pattern of geographical distribution, about 70% of new diagnosed patients are in east and Southeast Asian regions, especially in southern China, Hong-Kong and Taiwan. There were an estimated 86,700 new cases of NPC and 50,800 deaths in 2012 [1]. Because of advances in the treatment management, including the improvement of the radiotherapy (RT) technology, the broader application of chemotherapy, and more accurate disease staging, overall survival has dramatically improved over the past three decades. Most NPC patients are diagnosed at the stage III or IV, and the five years survival rate is 50%-60% [2].
Although often concurrent with the chemotherapy, the radiotherapy is the primary and only curative treatment for NPC [3]. However, radioresistance remains as a serious obstacle for survival improvement as it leads to local recurrence and distant metastases after radiotherapy [4]. Current researches showed ionizing radiation (IR) can paradoxically promote survival and invasion of cancer cells in different ways, including boosts epithelial-mesenchymal transition (EMT), facilitates cancer stem cells (CSCs) and changes tumor microenvironment (TME) [5]. Therefore, a systematic view of IR induced radioresistance is needed to provide a comprehensive understanding of molecular transformations within the NPC cells upon post radiotherapy.
The extracellular enzymes, Matrix metalloproteinases (MMPs) have been suggested to involve in cancer initiation, progression, and metastasis. MMPs belong to the metzincin superfamily of proteases, which are zinc-dependent endopeptidases with collagenolytic activity involved in extracellular matrix (ECM) proteins degradation [6]. Many MMPs, such as MMP2, MMP7, and MMP9, are found upregulated in various cancer types as cancers progress to later stages or become malignant. Thus, these MMPs are frequently used as biomarkers for cancer diagnosis and prognosis [7]. The expressions of MMPs, including MMP1, MMP8, MMP9, and MMP12, are increased in NPC patients. Mechanistic in vitro studies have shown that some of them can contribute to NPC cell migration and invasion, and they are correlated with poor prognosis [8-10].
In this study, we generated radioresistant NPC cell lines by sequentially irradiated it to a clinical treatment dose of 72 Gy. The systematic transcriptome analysis showed signature alterations in several signaling pathways. Among them, the cellular matrix/cell migration pathway is the most significant one. For instance, the expression levels of metastasis associated genes, including MMP2, MMP10, and MMP13 are increased dramatically in CNE1R and SUNE1R. With further analysis, we found four of them upregulated gradually while the irradiation dosage accumulated. Clinically, higher expression of both MMP10 and MMP13 associated with poorer five-year survival in head and neck cancers. Taken together, MMP10 and MMP13 may serve as potential poor prognosis biomarkers of metastasis during radiotherapy for NPC patients.
Materials and methods
Cell culture and the establishment of radioresistant CNE1R and SUNE1R cells
The highly differentiated NPC cell line CNE1 and SUNE1 were generously provided by Professor Chaonan Qian (Sun Yat-sen University Cancer Center, China). Cell line authentication was performed according to the suggestions from the ATCC cell line authentication [11]. To establish the radioresistant cell lines, 2 × 10⁶ CNE1 or SUNE1 cells were maintained in RPMI-1640 (Sigma, USA) medium supplemented with 10% fetal bovine serum (GenDEPOT, USA), 100 IU/ml penicillin (Sigma, USA) and 100 IU/ml streptomycin (Sigma, USA) at 37°C in a humidified atmosphere with 5% CO2, and then received 6 Gy IR at a time. The irradiation was delivered at room temperature at 300 cGy/min with a linear accelerator (X-RAD 320, Precision X-Ray, USA). After IR, the survived cells were cultured to produce the first passage of the radioresistant subclone. After twelve cycles of 6 Gy IR (total 72 Gy), survived cells were expanded as the radioresistant cell line and named as CNE1R. The selection process is taken over 9 months. The parental CEN1 and SUNE1 cells, used as a control, were maintained for the same period of time without the irradiation. All experiments were performed using the established CNE1R and SUNE1R cells within 3-10 passages. All cell lines were mycoplasma free examined by the PCR Mycoplasma Detection Kit (Applied Biological Materials Inc, USA) according to the manufacturer’s instructions.
Colony-formation assay
Colony-formation assay was performed as described in the literature [12]. Briefly, cells were plated in 6-well culture plates at various densities (1 × 10² - 5 × 10⁴ cells per well) for 12 h, then were exposed to IR with doses 8 or 10 Gy. The cells were cultured for an additional 14 days, and the survived colonies (a colony is defined as ≥ 50 cells) were counted. Plating efficiencies (PE) were calculated as the number of colonies divided by the numbers of cells seeded. The survival fraction was calculated as the PE of the group with irradiation divided by the one without irradiation. Three independent experiments were performed.
Cell proliferation analysis
Cells were plated in 24-well culture plates at 2 × 10⁴ per well. After 24 h, the cells were irradiated with 2 Gy. Cell growth was monitored by counting cell numbers at various time intervals. Three independent experiments were done and each group was performed in triplicates.
Apoptosis analysis
Cells were plated in 6-well plates (5 × 10⁵ per well) and treated with or without 8 Gy IR. At 24 h post-irradiation, the cells were harvested, washed twice with 1 ml PBS, and resuspended in 500 µl Flow cytometry buffer (2% FBS, 0.05% sodium azide (NaN3) and 2 mM EDTA in Ca2+ and Mg2+ free PBS. Cell solutions were incubated with 5 µl PE-conjugated Annexin V and 5 µl 7-AAD at room temperature in the dark for 15 min. Cells were immediately analyzed on BD FACSCanto II flow cytometer (BD Biosciences). Cells with PE Annexin V positive/7-AAD negative or PE Annexin V positive/7-AAD positive were defined as apoptotic cells. Data was analyzed by FlowJo v10.
RNA sample preparation
Both CNE1R and CNE1 cells were seeded in 10-cm dishes at a confluence of 60%, then they were exposed to 8 Gy irradiation, cell pellets were harvested at 6 or 48 hours post irradiation. CNE1R and CNE1 cells without irradiation were also harvested at the same time. Total RNA was extracted using TRIzol Reagent (Invitrogen, Life Technologies, USA) following the manufacturer’s instructions. The RNA samples were tested using a NanoPhotometer spectrophotometer (NanoDrop products IMPLEN, CA, USA), and an Agilent 2100 BioAnalyzer (Agilent RNA 6000 Nano Kit, USA) for the quality and quantity determination.
RNA sequencing and data analyses
The RNAseq were performed on BGISEQ-500 platform and mapped by BGI (Hongkong, China). The log2 ratio of FPKM (Fragments Per Kilobase of transcript per Million) between CNE1 and CNE1R cells was calculated. The genes that showed an absolute value of the log2 ratio ≥ 1 and an adjusted p value ≤ 0.001 were considered to be potential candidates. Volcano plot depicting differential expressed genes in CNE1 and CNE1R was made by ggPlot2 using R language. The clustering results were displayed with java Treeview [13] using cluster [14] software to analyze the expression genes and sample scheme at the same time by using the Euclidean distance matrix as the matrix formula. Time course analysis was performed by Mfuzz [15] analysis software. And Venn Diagram was performed by an online tool (http://bioinformatics.psb.ugent.be/webtools/Venn/).
Gene expression profile analysis
Gene Ontology Analysis and Pathway Analysis were performed by Enrichr and Metascape [16,17]. STRING [18] online database (http://string-db.org) was used for analyzing the protein-protein interaction (PPI) of common DEGs. A GSEA preranked tool was used and performed with the following parameters: 1,000 gene set permutations, weighted enrichment statistics, gene set size between 15 and 500, and signal-to-noise metrics. Regulated pathways were considered statistically significant if the P was ≤ 0.5 and false discovery rate (FDR) was ≤ 0.25. The GSEA-derived normalized enrichment score was used for the visualization of pathway regulation [19,20].
Wound healing assay
8 × 10⁵ CNE1/CNE1R or SUNE1/SUNE1R cells were seeded in one well of a 6-well plate for 12 h to create a confluent monolayer. Culture medium was then replaced by serum-free medium for 24 h. Scratch the cell monolayer in a straight line to create a “wound” with a p1000 pipet tip. Remove the debris and smooth the edge of the scratch by washing the cells once with 2 ml serum-free medium and then replace with 4 ml serum-free medium. Place the dish in a tissue culture incubator at 37°C for 72 h. The images were acquired under a phase-contrast microscope (Leica DMi8, USA) under the reference point at 0 h and 72 h. For the wound healing assay with MMP10 and MMP13 knockdown groups, CNE1R and SUNE1R were infected with lentivirus (containing shCtrl, shMMP10 and shMMP13), 2 ug/mL puromycin was used to select positive cells. 24 h after puromycin selection, 8 × 10⁵ infected CNE1R or SUNE1R cells were seeded in one well of a 6-well plate for 12 h to create a confluent monolayer in the 2% serum containing medium. The following steps were performed as described above. The shRNA targeting sequences are designed as below: shCtrl: CTTACGCTGAGTACTTCGA; shMMP10: GAAGATGAGCCTTGCAGATAT; shMMP13: CTGTCAATGAGAGCATAATTT.
Nude mice lung metastasis model
8-week-old female athymic NU/NU mice were used for lung metastasis assay. Both CNE1 and CNE1R were treated with or without 8 Gy IR. At 24 h post-irradiation, the cells were harvested. 1.0 × 10⁶ CNE1 or CNE1R cells were resuspended in 100 μl ice cold 1 × DPBS and injected though mouse tail vein. All mice were sacrificed 8 weeks after injection and lungs were extracted and fixed in 10% neutral buffered formalin. Tissue embedding and H&E staining were performed by HistoWiz (Brooklyn, NY). All experimental procedures were performed in accordance with protocols approved by The University of Texas Health Science Center at Houston (UTHealth) Animal Welfare Committee.
Quantitative RT-PCR
Reverse Transcription cDNA synthesis reactions were performed by iScript cDNA synthesis kit (Bio-Rad) according to manufacturer’s instruction. Quantitative PCR reactions were performed using SYBR Green PCR Master Mix (Bio-Rad) on a CFX96 machine (Bio-Rad). The reaction was performed as following program: 50°C for 10 min, 95°C for 5 min, 40 cycles of 95°C for 10 s and 60°C for 30 s, and 95°C for 10 min. Samples were analyzed in triplicates and normalized to SDHA expression. The following primers were used for qRT-PCR detection: SDHA: 5’-TGGGAACAAGAGGGCATCTG-3’ (forward), 5’-CCACCACTGCATCAAATTCATG-3’ (reverse); IL1β: 5’-AGCTACGAATCTCCGACCAC-3’ (forward), 5’-CGTTATCCCATGTGTCGAAGAA-3’ (reverse); IL6: 5’-ACTCACCTCTTCAGAACGAATTG-3’ (forward), 5’-CCATCTTTGGAAGGTTCAGGTTG-3’ (reverse); CXCL1: 5’-GCCAGTGCTTGCAGACCCT-3’ (forward), 5’-GGCTATGACTTCGGTTTGGG-3’ (reverse); CCL3: 5’-AGTTCTCTGCATCACTTGCTG-3’ (forward), 5’-CGGCTTCGCTTGGTTAGGAA-3’ (reverse); IGFBP1: 5’-TTTTACCTGCCAAACTGCAACA-3’ (forward), 5’-CCCATTCCAAGGGTAGACGC-3’ (reverse); MMP2: 5’-GATACCCCTTTGACGGTAAGGA-3’ (forward), 5’-CCTTCTCCCAAGGTCCATAGC-3’ (reverse); MMP10: 5’-TGCTCTGCCTATCCTCTGAGT-3’ (forward), 5’-TCACATCCTTTTCGAGGTTGTAG-3’ (reverse); MMP13: 5’-TCCTGATGTGGGTGAATACAATG-3’ (forward), 5’-GCCATCGTGAAGTCTGGTAAAAT-3’ (reverse); LMO1: 5’-AAGGACCGCTATCTGCTGAAG-3’ (forward), 5’-CGAGGTGATACACGTTGTCCC-3’ (reverse); ALOX5: 5’-CTCAAGCAACACCGACGTAAA-3’ (forward), 5’-CCTTGTGGCATTTGGCATCG-3’ (reverse); WNT5A: 5’-ATTCTTGGTGGTCGCTAGGTA-3’ (forward), 5’-CGCCTTCTCCGATGTACTGC-3’ (reverse); ELMO1: 5’-GGAGCAGGTTATGAGAGCACT-3’ (forward), 5’-GGGCGGGACTGGAAATCTTC-3’ (reverse); ROS1: 5’-CCACATAATCTGAGTGAACCGTG-3’ (forward), 5’-CGCTGCTACAGCCAACCTC-3’ (reverse).
Analysis of TCGA and GSEA data sets
The head and neck squamous cell carcinoma (HNSCC) Gene expression data sets were obtained from The Cancer Genome Atlas (TCGA) dataset and NCBI Gene Expression Omnibus (GEO) database (accession numbers: GSE9349). The correlation analyses of MMP10 and MMP13 were performed using these two datasets. The univariate analysis of survival data with the HNSCC dataset of the TCGA was performed using the Kaplan-Meier analysis.
Statistical analysis
All data are presented as mean ± standard error of mean (SEM). The two-tailed Student’s t test was used to assess the differences between different groups. The Spearman correlation test was used to examine the correlation between MMP10 and MMP13 expression. All statistical analyses were performed using SPSS 19.0 (IBM SPSS software, NY, USA) and GraphPad Prism 6 (GraphPad software, CA, USA). Data were considered statistically significant when P ≤ 0.05.
Results
Establish the radioresistant NPC cell lines
To generate a radioresistant cell line obtaining comparable clinical treatment dose of NPC patients, we exposed CNE1 cells in exponential growth phase to 6 Gy at one time for 12 cycles. An interval of 3 to 4 weeks between each IR allowed the surviving cells for proliferation and expansion (Figure 1A). The entire process of IR selection took about 10 months, and the culture survived final irradiation was named as CNE1R. The same procedure was using to generate SUNE1R cell line (data not shown). When checking their growth rates, the resistant line CNE1R grew slightly slower than the parental CNE1. However, after 2 Gy IR challenge, CNE1R proliferated faster than CNE1 (Figure 1B). Even more, the colony formation assay showed when cells were exposed to the lethal dosage IR of 8 or 10 Gy, CNE1R grew substantially more colonies than CNE1 (Figure 1C and 1D). These results indicate that CNE1R is much more resistant to radiation than its parental counterparts. Thus, we have established CNE1R as a stable radioresistant NPC cell line.
Figure 1.
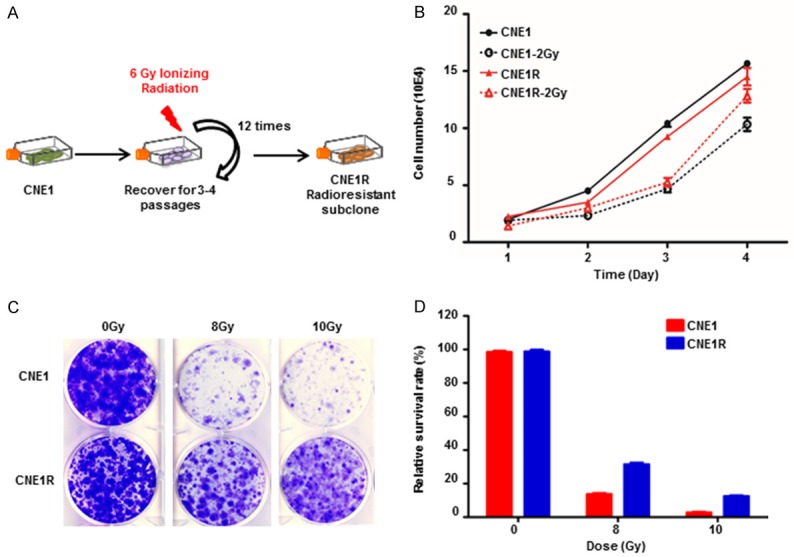
Establish a radioresistant NPC cell line CNE1R. (A) Schematic diagram of the establishment of a radioresistant CNE1R cell line. (B) Growth of CNE1R is sustained after IR. CNE1 and CNE1R plated in 24-well culture plates were exposed to IR at 2 Gy and cell growth was monitored daily by counting cell numbers. (C) CNE1R is resistant to IR in a colony-forming assay. CNE1 and CNE1R plated in 6-well culture plates were exposed to IR at 8 or 10 Gy, or without IR. (D) The survival fraction of the colony-forming assay in (C) was calculated and normalized to no IR group. All data are representative of three independent experiments and values are shown in mean ± SEM (B, D), NS means no significant difference, *P < 0.05, **P < 0.01 (Student’s t test).
CNE1R gene profiling showed oncogenic pathway activation
To assess global transcriptional expression profile differences in CNE1R and CNE1 cell lines, RNAseq was applied. The results revealed distinct mRNA expression patterns between two lines. Volcano plot showed 328 genes are dramatically upregulated while 513 genes are significantly downregulated in CNE1R cells when compared with CNE1 cells (Figure 2A). The upregulated genes in CNE1R showed highly enrichment in oncogenic pathways, including Wnt signaling pathway and Ras signaling pathway, etc (Figure 2B); while, the downregulated genes in CNE1R showed enrichment in inflammation response pathways, such as TNF signaling pathway, cytokine-cytokine receptor interaction pathway and others (Figure 2C). Taken together, the increased oncogenic activities and decreased inflammatory responses could support the growth advantages of CNE1R after irradiation in the proliferation and colony formation assays. Indeed, CNE1R acquired radioresistant ability through the transformation of expression profiles.
Figure 2.
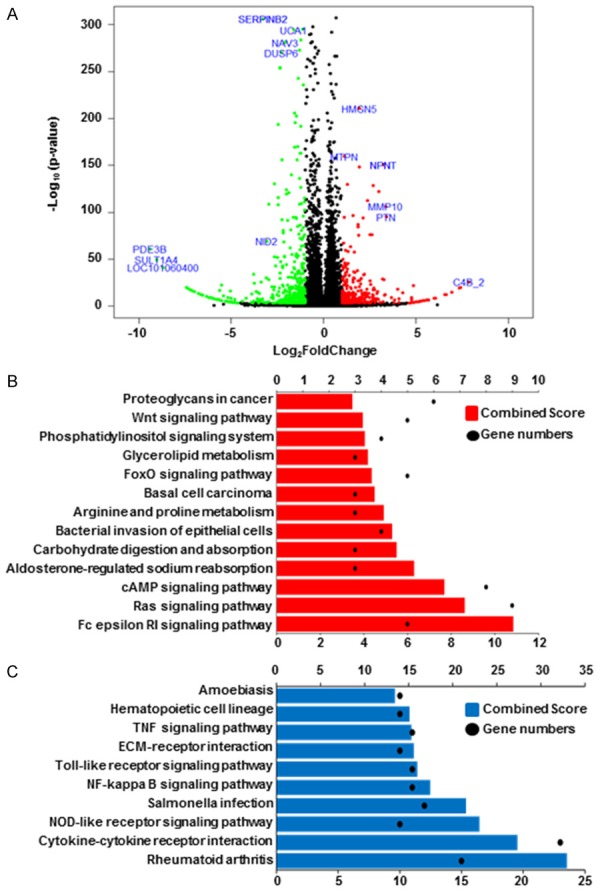
CNE1R expression profile shows oncogenic pathway activations. A. Volcano plot is used to show different expression genes between CNE1 and CNE1R. Red dots indicate upregulated genes in CNE1R, and green dots indicate downregulated genes in CNE1R. Fold change ≥ 2 or ≤ -2 and q-value < 0.001 were significant. B. 328 upregulated genes in CNE1R was analyzed by KEGG pathway. Gene numbers involved in each pathway was showed as black dots, combined score was showed as histogram in red. C. 513 downregulated genes in CNE1R was analyzed by KEGG pathway. Gene numbers involved in each pathway was showed as black dots, combined score was showed as histogram in blue.
Both CNE1R and CNE1 expression profiles changed in a dynamic manner after irradiation
To better understand the different responses between radioresistant and parental cells after irradiation, we collected CNE1R and CNE1 cells at 6 h and 48 h after 8 Gy irradiation for RNA-seq. Although diverse gene expression profiles are present among different time point and cell lines, in general they could be assorted to three categories: “the first responders, the mediators and the finalizers”.
First, the early respond group, genes started changing immediately after IR treatment and saturated after 6 h (Figure 3A and 3B). At this time, in response to the stimuli, both cells have upregulated N-glycan biosynthesis associated pathways and DNA polymerase. As the irradiation induces DNA damage, endoplasmic reticulum (ER) stress, and the absence of N-glycans induced apoptosis. So it is essential for these cell survival genes upregulation under irradiation [21] (Figure 3A). While at the same time, the cell cycle is retained to allow the DNA damage repair (DDR) to proceed. Therefore, the cell cycle pathways were inhibited in both lines (Figure 3B). For the second group, all genes continued changing, either incline or decline, over 48 hours post irradiation (Figure 3C and 3D). This means these gene products may be required for a long period of time when the cells are recovery from the IR stimulation. For example, ABC transporters are upregulating as they were required in protecting brain tumor cells from radiation induced cell death [22]. And the inhibition of ribosome, RNA polymerase will lead to transcriptional arrest to prevent DNA damage being made permanent by replication [23]. We classified genes remained unchanged but began to active or deactivate after 6 h post-IR to be as the late response groups. The most notably upregulated group of pathways in this category are immune responses and ECM receptor interactions (Figure 3E). Some other genes involved in cell cycle, ribosome, RNA polymerase, ubiquitin mediated proteolysis, and metabolism activity remained to be repressed while DNA damages were still present (Figure 3F).
Figure 3.
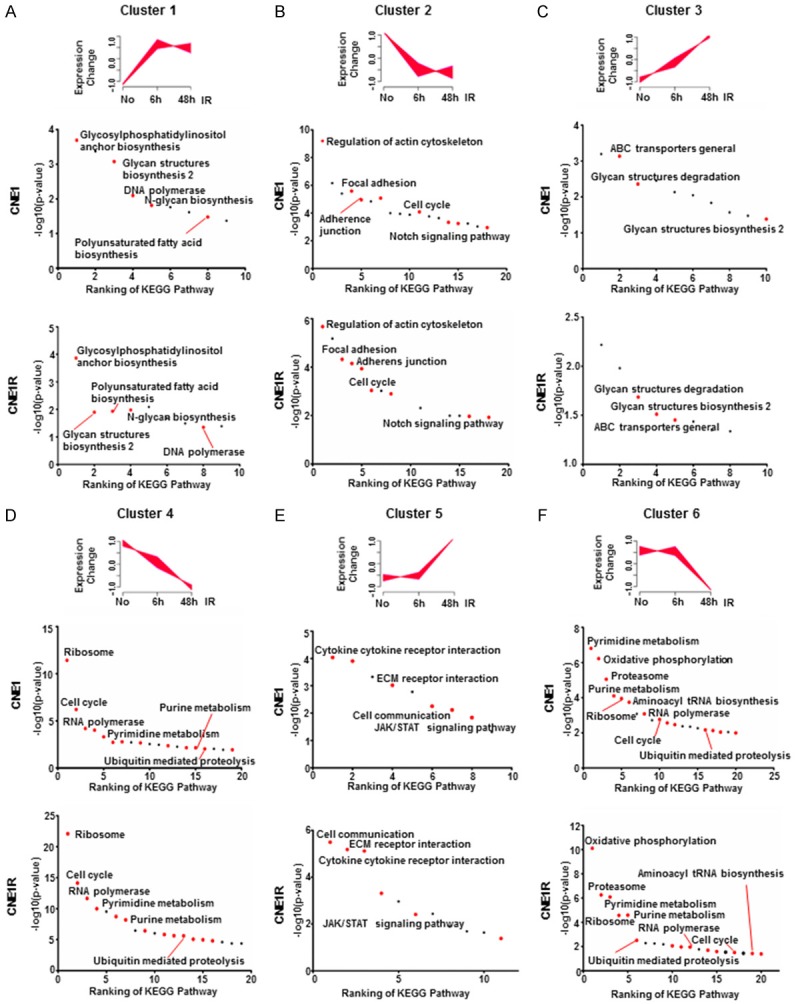
Both CNE1R and CNE1 expression profiles changed in a dynamic manner after irradiation. A-F. Gene expression time course analysis was performed by Mfuzz, and clustered into six groups. Top ranking KEGG pathways in CNE1 and CNE1R were ranked by p-value (-log10). Red dots indicate overlapped pathways in CNE1 and CNE1R. Black dots indicate unique pathways in each cell line.
It is reasonable to see similar yet different signaling pathways were found in both CNE1R and CNE1 cells at every stage, since they were exposed to the same radiation. To elucidate the distinct character of resistant cells, we then focused on analyzing the different expression genes (DEGs).
The irradiation activates signature oncogenic signaling in resistant CNE1R cells
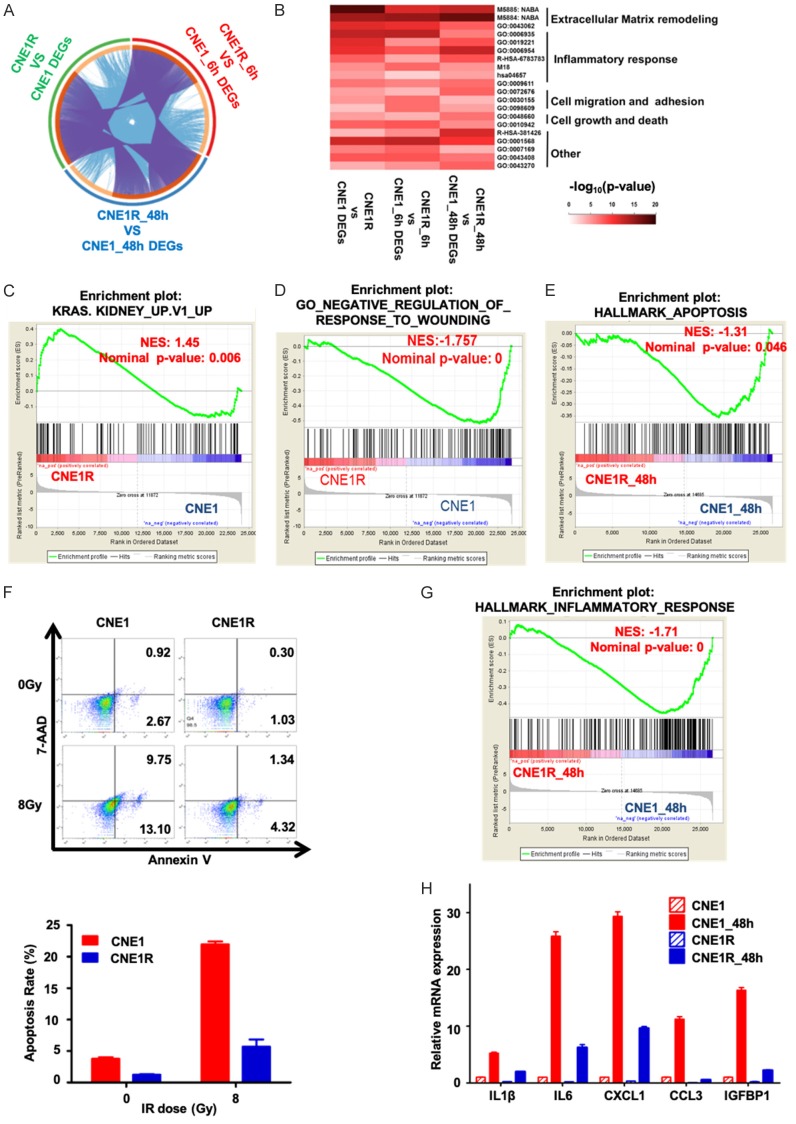
Three groups of DEGs (no IR, 6 h or 48 h post-irradiation) between CNE1R and CNE1 were analyzed to find the common regulated targets among them (Figure 4A). The top ranked pathways stood out including four major cellular functions: the cell matrix and adhesion regulation, the inflammatory response, the cell growth and death, and the oncogenic signaling (Figure 4B). The Gene set enrichment analysis (GSEA) was used to reexam these selected pathways. Compared to CNE1, DEGs in CNE1R are enriched in K-RAS up regulated gene set (Figure 4C) and positive responders to wounding (Figure 4D). In contrast, DEGs in CNE1 are enriched in apoptosis hallmarks (Figure 4E) and inflammatory responses (Figure 4G).
Figure 4.
The irradiation activates signature oncogenic signaling in resistant CNE1R cells. (A) Circos visualization of overlapping different expression genes (DEGs) between CNE1 and CNE1R during different time points after irradiation, extended by informative enriched terms. Gene pairs (from different lists) overlap are linked by purple curves, while genes fall into the same enriched term are linked by blue curves. (B) Heatmap visualization of pathway enrichments. A subset of representative enriched terms based on the GO clusters and ranked by -log10 (p-value). Five different clusters were annotated base on GO items. (C) Hallmark of KRAS activation was enriched in CNE1R compared to CNE1 by gene set enrichment analysis (GSEA). (D) GSEA analysis showed CNE1 transcriptome enriched in negative regulation of response to wounding when compared to CNE1R. (E) Hallmark of apoptosis was enriched in CNE1 compared to CNE1R 48 post-irradiation in gene set enrichment analysis (GSEA). (F) CNE1R is resistant to IR-induced cell death. CNE1 and CNE1R cells were treated with or without 8 Gy IR, and apoptosis was detected by flow cytometer with Annexin V and 7-AAD staining. Cells with PE Annexin V positive/7-AAD negative or PE Annexin V positive/7-AAD positive were defined as apoptosis cells, shown as mean ± SEM. (G) Inflammatory response was enriched in CNE1 compared to CNE1R 48 post-irradiation in gene set enrichment analysis (GSEA). (H) qRT-PCR was used to determine the expression of representative inflammatory response associated genes enriched in (G). All gene expressions were normalized to CNE1. All data are representative of three independent experiments and values are shown in mean ± SEM (F and H). **P < 0.01 (F, Student’s t test; H, ANOVA).
To verify the in-silico analysis results, we checked the death rate of CNE1 and CNE1R cells upon 8 Gy IR by FACS. The Annexin V staining positive CNE1 population was dramatically higher than the CNE1R group (9.75% vs. 1.34%) in response to this lethal dose IR (Figure 4F). We further checked the levels of several cellular inflammatory factors by the quantitative RT-PCR (qRT-PCR), and found the irradiation can induce IL1β, IL6, CXCL1, CCL3 and IGFBP1 mRNA levels more significant in CNE1 cells than in CNE1R (Figure 4H). These results indicate that apoptosis and inflammatory responses are impeded, but the pathways involved in K-RAS and positive responders to wounding are upregulated in radioresistant cells.
Radioresistant cells show enrichments in the metastasis associated gene sets and gain metastatic ability
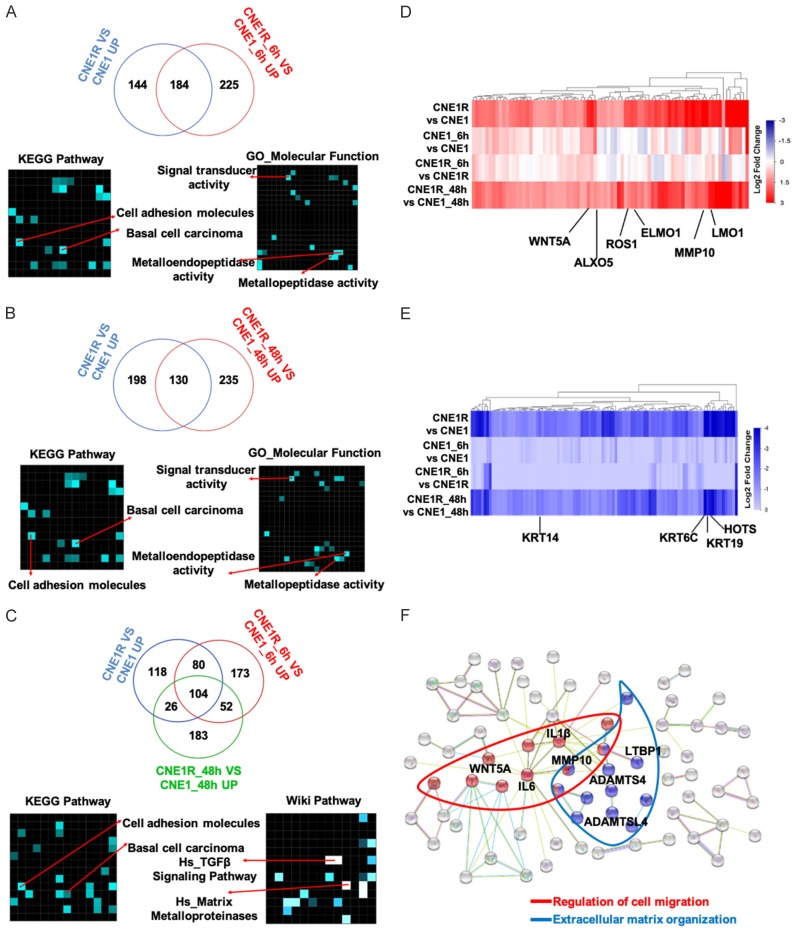
Next, we took one step further to study the activated DEGs in the radioresistant cells and aimed to find potential resistant signatures. We set up three groups of comparison of upregulated genes only. There were 184 genes consistently upregulated in CNE1R without or at 6 h post-irradiation (Figure 5A). The top ranked pathways in both KEGG pathway and GO/Wiki pathway analyses included cell adhesion molecules and metallopeptidase activity. Moreover, 130 overlapped upregulated genes in CNE1R before or at 48 h post-irradiation (Figure 5B), and 104 activated genes in CNE1R with or without IR exposure (Figure 5C) all indicated same gene population as the first group of comparison in the KEGG and Wiki pathway analyses. The enriched expression of these cell adhesion regulators, such as matrix metallopeptidase (MMP) would affect cells in many aspects of biology, ranging from cell proliferation, differentiation and remodeling of the ECM to vascularization and cell migration.
Figure 5.
Radioresistant CNE1R cells show enrichments in the metastasis associated gene sets. A. Venn diagram showed overlapped upregulated genes in CNE1 and CNE1R without IR or 6 h post-IR, KEGG pathway and GO analysis were used for analyzing all overlapped genes. B. Venn diagram showed overlapped upregulated genes in CNE1 and CNE1R without IR or 48 h post-irradiation, KEGG pathway and GO analysis were used for analyzing all overlapped genes. C. Venn diagram showed overlapped upregulated genes in CNE1 and CNE1R without IR or 6 h and 48 h post-irradiation, KEGG pathway and Wiki pathway analysis were used for analyzing all overlapped genes. D. Heatmap showed pro-resistance genes in CNE1R: upregulated in CNE1R; no significant change at 6 h post-irradiation; upregulated at 48 h after IR. E. Heatmap showed anti-resistance genes in CNE1R: downregulated in CNE1R; no significant change at 6 h post-irradiation; downregulated at 48 h after IR. F. String 10 was used to analysis interaction proteins of radioresistance associated genes. Two main groups of genes involved in metastasis associated pathways: Regulation of migration (in Red), and extracellular matrix organization (in Blue).
To narrow down the number of candidates, we defined several criterial for selecting essential radioresistance associated genes based on previous study [24]. The gene expressions have to be increased or decreased in CNE1R regardless of IR challenge. And they also must be late response genes which kept changing even at 48 h after IR. According to these rules, the activated and inhibited genes were found and presented as heatmaps in Figure 5D (activated) and 5E (inhibited). Several candidates with significant fold changes are indicated. For instance, WNT5A, ALXO5, ROS1, ELMO1, MMP10 and LMO1 are enriched in CNE1R at 48 h post-irradiation (Figure 5D); in contrast, HOTS and keratin family members KRT14, KRT6C and KRT19 are downregulated in CNE1R at 48 h post-irradiation (Figure 5E). Interestingly, keratins are the intermediate filament proteins that form a dense meshwork of filaments throughout the cytoplasm of epithelial cells. Expression of these particular epithelial genes varied across malignant cells and may reflect the degree of epithelial differentiation. Downregulation of these keratin proteins may represent a dedifferentiated stage of NPC cells.
Above studies all pointed to the augment of cell migration associated genes in the resistant line CNE1R. Analysis of protein interactions among these cellular matrix associated genes by String 10 revealed that there are two main groups of genes involved in metastasis associated pathways [18]. One is the regulation of migration, another one is the extracellular matrix organization (Figure 5F). Again, several previously identified candidates (IL6, MMP10) showed up in this analysis as well.
The migration related genes MMP2, MMP10, MMP13, etc. selected from these various analyses were further examined by qRT-PCR and showed even IR is able to induce these gene expressions in both parental and radioresistant cells, but upregulation of these genes is much higher in CNE1R and SUNE1R cells (Figure 6A). Especially, the basal levels of MMP10 and MMP13 are equal or higher in CNE1R and SUNE1R than their parental cells, which implied a higher mobility of the radioresistant cells. To find the initiation point of MMPs elevation, we checked their expressions at different stages during the establishment of the resistant CNE1R line. As shown in Figure 6B, the expression levels of MMP10, MMP13, LMO1 and ELMO1 were gradually upregulated while the IR cycles increased. At the end of 12 times of irradiation, levels of these genes reached to maxima as the results of a dynamic accumulation. Consistent with upregulation of cell mobility-associated genes, wound healing assay showed CNE1R cells migrated faster than CNE1 cells did (Figure 6C). The similar results also observed in the SUNE1 pair that SUNE1R obtained higher wound healing ability (Figure 6D). To determine whether MMP10 and MMP13 are required for promoting the cell migration, we knockdown MMP10 or MMP13 respectively in CNE1R and SUNE1R. The loss of MMP10 and MMP13 by their shRNA is able to impede the wound closure in both CNE1R (Figure 6E) and SUNE1R cells (Figure 6F), which confirmed the notion that increased mobility-associated genes, such as MMP10 and MMP13, are the key factors for advanced cell movement ability in the radioresistant lines. More importantly, in vivo xenographs showed CNE1R has higher incidence (3/5 vs. 1/5) than CNE1 cells to form metastatic NPC tumor nodules in the mouse lungs (Figure 6G). Especially, the IR challenged CNE1R cells have 100% metastatic tumor incidence, which strengthens the relationship between the radioresistance and the acquired cell nobility.
Figure 6.
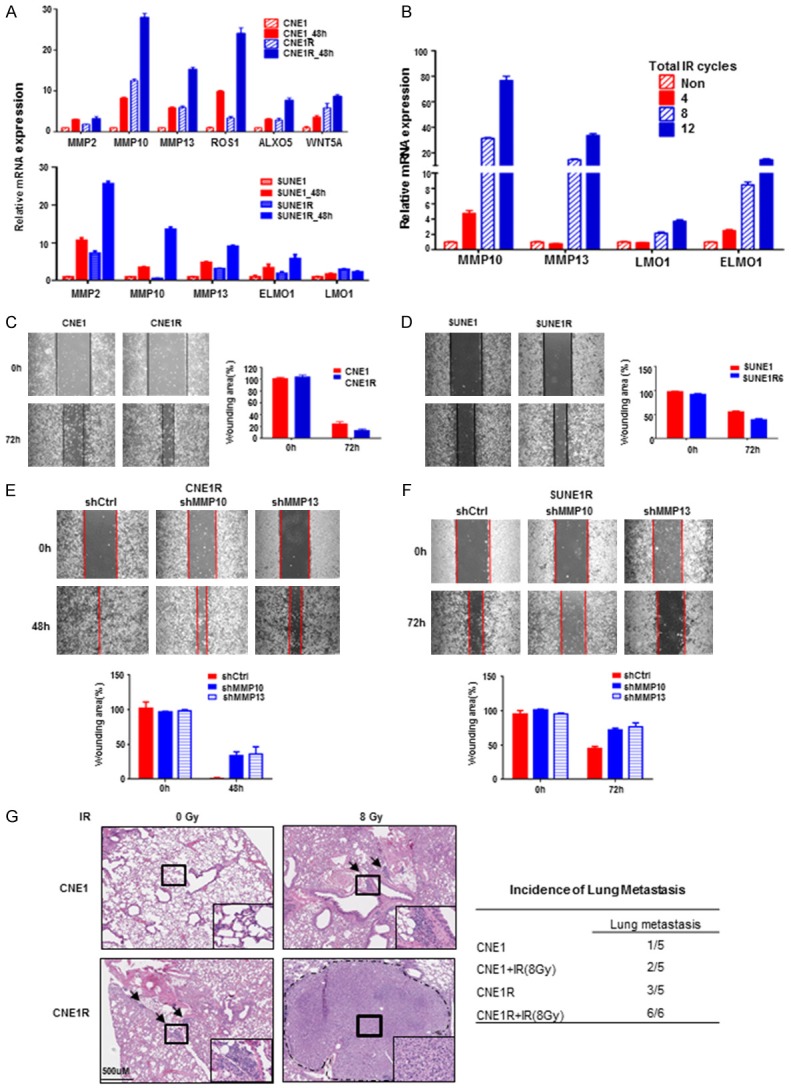
Radioresistant CNE1R cells gain metastasis ability. (A) CNE1R and SUNE1R cells show higher wound healing associated genes expression. qRT-PCR was used for detecting gene expression, all gene expressions were normalized to which of CNE1 or SUNE1. (B) Metastasis associated genes MMP10, MMP13, LMO1 and ELMO1 increased gradually during the process of sequential irradiation in CNE1R cells. (C) CNE1R cells have increased migration ability in the wound healing assay. Wounding area was calculated and normalized to day 0. (D) SUNE1R cells have increased migration ability in the wound healing assay. Wounding area was calculated and normalized to day 0. (E) The loss of MMP10 and MMP13 attenuates CNE1R wound healing ability. Wounding area was calculated and normalized to day 0. (F) The loss of MMP10 and MMP13 attenuates SUNE1R wound healing ability. Wounding area was calculated and normalized to day 0. (G) CNE1R cells gain metastatic ability in the nude mice lung metastasis model, IR enhances the metastatic tumor incidence. H&E staining of mouse lungs are shown. Metastatic node is shown by rectangle frame and magnification is shown in the right corner. Scale bar, 500 um. The lung metastatic tumor incidence of different group is shown in the table. All data are representative of three independent experiments and values are shown in mean ± SEM (A-F). **P < 0.01 (A, B, E and F, ANOVA; C and D, Student’s t test; G, Chi-square test).
Taken together, all these evidences indicate that during the process of radioresistance, NPCs have elevated levels of ECM associated genes (e.g., MMPs) which allows NPCs to achieve higher cell migration and metastasis abilities. These findings suggested these MMPs could serve as IR induced radioresistant signature genes.
Gene signatures indicated gain of metastasis ability after the irradiation
Radiotherapy is the first choice in NPC patients’ treatments. However, the paradoxical effect of RT could trigger radioresistance and even promote metastasis and invasion of cancer cells. Though we have proved this concept in our radioresistant cell line, it will be more meaningful to exam it in patients.
To explore the metastatic role of MMPs in broader cancer types, we studied the expression of MMP10 and MMP13 in Head and Neck squamous cell carcinoma (HNSCC) from TCGA database. MMP10 and MMP13 but not ELMO1 and LMO1 showed significant correlation with overall survivals in HNSCC patients (Figure 7A). We found the expression of MMP10 was highly positively correlated with MMP13 (R = 0.341, P < 0.0001, Figure 7B). Furthermore, MMP10 and MMP13 were upregulated in metastatic HNSCC tumors compared to non-metastatic ones from another data set (GSE9349 in GEO database) (Figure 7C and 7D). MMP10 levels showed highly positive correlation with MMP13 (R = 0.3308, P = 0.0051, Figure 7E), which was consistent with data from the TCGA database (Figure 7B). Given all the findings above, we query that whether the combination of MMP10 and MMP13 could sever as a prognostic marker for HNSCC patients. We found patients with lower expression of both MMP10 and MMP13 showed a better five-year survival than the double high (MMP10highMMP13high) group (Figure 7F). Taken together, our findings suggested MMP10, MMP13, LMO1 and ELMO1 may serve as gene signatures during sequential irradiation in NPC treatments and MMP10 and MMP13 can be metastatic and unfavorable prognostic markers for NPC as well as HNSCC patients.
Figure 7.
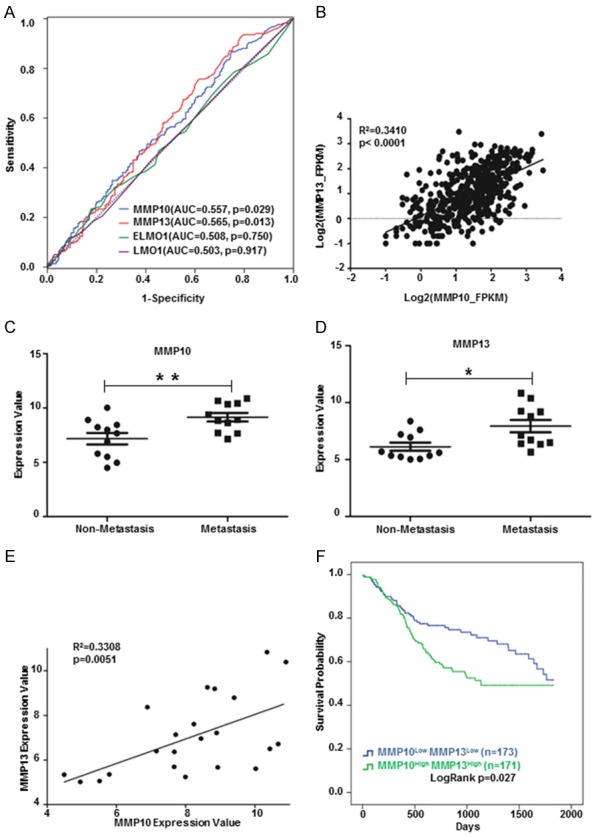
Gene signatures indicated gain of metastasis ability after the irradiation. (A) MMP10 and MMP13 showed significant predication ability of overall survivals in HNSCC patients by ROC analysis. (B) MMP10 expression was positively correlated with MMP13 in HNSCC patients (TCGA, n = 499). (C) MMP10 were upregulated in metastatic (n = 11) compared to non-metastatic (n = 11) HNSCC tumors (GSE9349). (D) MMP13 were upregulated in metastatic (n = 11) compared to non-metastatic (n = 11) HNSCC tumors (GSE9349). (E) MMP10 expression was positively correlated with MMP13 in HNSCC tumors (GSE9349). (F) Kaplan Meier-plotter showed MMP10LowMMP13Low group patients had a better five-year survival than MMP10highMMP13high group. *P < 0.05, **P < 0.01 (C and D, Student’s t test). Correlation analysis was calculated by Pearson correlation coefficient (B and E).
Discussion
Radiotherapy is a major therapeutic application for treating a variety of malignant tumors, especially in NPC and other HNSCC patients. However, radiotherapy could potentially induce tumor recurrence and even metastasis, which draws more attention on research to overcome this obstacle. Irradiation induced radioresistant cell lines have been widely employed for radioresistance research [12,25-27], so does this current study. Not only we have used the clinical treatment dose of irradiation to establish a radioresistant CNE1 cell line, but also examined the cells at different stages to elucidate the dynamic process during the acquirement of radioresistance. Finally, we cited a defined resistant gene criteria [24] and used various computational approaches to reveal a series of resistance related signatures. In our platform, we found inflammation responses as well as the apoptotic function have been impeded, while K-RAS and other oncogenic signaling are augmented. Particularly, the molecules involved in the regulation of cell migration and ECM organization are widely changed in the resistant cells. The decreased epithelia markers like keratins and increased expression of metalloproteinase (MMP10 and MMP13) all led to a poorly differentiation and easier metastatic phenotype, as it showed the CNE1R cells formed metastasis nodules in the nude mice lungs.
During radiotherapy, the tumor microenvironment alterations, including stromal, vascular, immunological and ECM remodeling, increase the chances of tumor recurrence and metastasis. Inflammatory responses play decisive roles at different stages of tumor development, also affect immune surveillance and responses to therapy. In the case of more conventional chemotherapy, therapy-induced inflammation has been found to stimulate antigen presentation by tumor-infiltrating dendritic cells and to induce production of cytokines that stimulate adaptive antitumor immunity [28]. However, when the cytokine release is largely restrained in the resistant situation, tumor cells evade the immune surveillance to survive or even migrate to distant loci.
Invasion and metastasis have been schematized as a sequence of distinct steps. Initial local invasion generally includes: cell adhesion to ECM, degradation of the ECM by cellular proteases and, migration/invasion through the ECM. Subsequently, the intravasation of tumor cells to the lymphatic capillary system or blood flow and the extravasation to the parenchyma of distant tissues led to the formation of micro metastases. Clinical studies leveraging circulating tumor cells (CTCs) sorting technology have shown that radiotherapy results in an increased number of viable CTCs in non-small cell lung cancer and bladder cancer, thus contributing to a higher risk of distant metastases [29].
Metastatic disease is associated with MMP modifications. MMPs were initially thought to facilitate tumor cell metastasis by destroying the basement membrane and other components of the ECM, along with normal tissue remodeling, wound healing and angiogenesis [30,31]. Expression profiles of MMPs changed after radiation were summarized by Coralie and colleagues [32]. MMP13 has been shown overexpressed in NPC cells as well as NPC patients’ plasma. MMP13-containing exosomes from NPC could regulate the tumor microenvironment, such as facilitating tumor cell migration and invasion by interaction with stromal fibroblast cells [33,34]. Also, it has been reported that overexpression of MMP7, MMP10 and MMP12 in colon cancer patients’ sera correlates with a dismal prognosis and may help to stratify patients into different risk groups [35].
Studies have shown that though MMP10 lacks collagenase activity itself, it could super activate other pro-collagenases, including pro-MMP13 [36,37]. Consistently, we observed that MMP10 and MMP13 were elevating during the sequential IR, and ultimately sustained at extreme high levels. Both MMP10 and MMP13 are required for maintaining the cell migration ability as shown that loss of MMP10 or MMP13 could attenuate wound healing in both CNE1R and SUNE1R lines. Moreover, MMP10 level was positively correlated with MMP13 in HNSCC patients, and their levels enhanced in metastatic tumors in HNSCC. We also found patients with lower MMP10 and MMP13 expressions showed a better five-year survival in HNSCC. Therefore, a cooperation role between MMP10 and MMP13 is suggested. We even detected higher MMP10 mRNA levels in metastatic NPC tumor samples than their corresponding primary ones. Even though, the p value didn’t reach the statistical significance due to the limited sample numbers (Supplementary Figure 1), it strongly supports the clinical importance of our study. Here for the first time, we propose a concept to detect the expression of MMP10 and MMP13 in serum of NPC patients during the radiotherapy may provide a risk factor for metastasis.
In summary, our work provides important insights into IR induced radioresistance in NPC, especially the dynamic cellular responses during this process has never been reported before (Figure 8). Our computational approach identified radioresistance associated genes and pathways, emphasized the significant function of MMP members. Further study is required to validate whether MMP10, MMP13 and other identified proteins could serve as diagnostic markers or even treatment algorithms.
Figure 8.
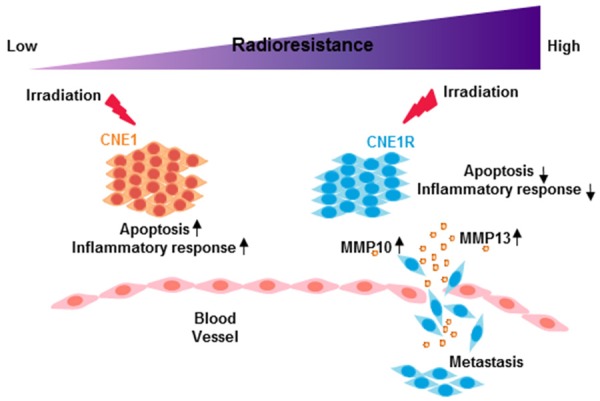
The model of radioresistance related functional alterations after irradiation. After irradiation, radioresistant cells have altered gene expression profiles and acquire higher metastasis ability.
Acknowledgements
This research was financially supported by the following: D. Wang is supported by the State-sponsored Joint Ph.D. Program from China Scholarship Council (201606380093); H. Yang is supported by grants from the National Natural Science Foundation of China (81874127 and 81372410), and the Scientific and Technological Project of Guangdong, China (2013B031800002 and 2015A020211006). R. Zhao is supported by UTHealth/IBP P37516-11999.
Disclosure of conflict of interest
None.
Supporting Information
References
- 1.Torre LA, Bray F, Siegel RL, Ferlay J, Lortet-Tieulent J, Jemal A. Global cancer statistics, 2012. CA Cancer J Clin. 2015;65:87–108. doi: 10.3322/caac.21262. [DOI] [PubMed] [Google Scholar]
- 2.Petersson F. Nasopharyngeal carcinoma: a review. Semin Diagn Pathol. 2015;32:54–73. doi: 10.1053/j.semdp.2015.02.021. [DOI] [PubMed] [Google Scholar]
- 3.Chua MLK, Wee JTS, Hui EP, Chan ATC. Nasopharyngeal carcinoma. Lancet. 2016;387:1012–1024. doi: 10.1016/S0140-6736(15)00055-0. [DOI] [PubMed] [Google Scholar]
- 4.Lee AW, Ma BB, Ng WT, Chan AT. Management of nasopharyngeal carcinoma: current practice and future perspective. J. Clin. Oncol. 2015;33:3356–3364. doi: 10.1200/JCO.2015.60.9347. [DOI] [PubMed] [Google Scholar]
- 5.Lee SY, Jeong EK, Ju MK, Jeon HM, Kim MY, Kim CH, Park HG, Han SI, Kang HS. Induction of metastasis, cancer stem cell phenotype, and oncogenic metabolism in cancer cells by ionizing radiation. Mol Cancer. 2017;16:10. doi: 10.1186/s12943-016-0577-4. [DOI] [PMC free article] [PubMed] [Google Scholar]
- 6.Vandenbroucke RE, Libert C. Is there new hope for therapeutic matrix metalloproteinase inhibition? Nat Rev Drug Discov. 2014;13:904–927. doi: 10.1038/nrd4390. [DOI] [PubMed] [Google Scholar]
- 7.Yao Q, Kou L, Tu Y, Zhu L. MMP-responsive ‘smart’ drug delivery and tumor targeting. Trends Pharmacol Sci. 2018;39:766–781. doi: 10.1016/j.tips.2018.06.003. [DOI] [PubMed] [Google Scholar]
- 8.Sun W, Liu DB, Li WW, Zhang LL, Long GX, Wang JF, Mei Q, Hu GQ. Interleukin-6 promotes the migration and invasion of nasopharyngeal carcinoma cell lines and upregulates the expression of MMP-2 and MMP-9. Int J Oncol. 2014;44:1551–1560. doi: 10.3892/ijo.2014.2323. [DOI] [PubMed] [Google Scholar]
- 9.Cheng D, Kong H, Li Y. Prognostic value of interleukin-8 and MMP-9 in nasopharyngeal carcinoma. Eur Arch Otorhinolaryngol. 2014;271:503–509. doi: 10.1007/s00405-013-2580-3. [DOI] [PubMed] [Google Scholar]
- 10.Chung IC, Chen LC, Chung AK, Chao M, Huang HY, Hsueh C, Tsang NM, Chang KP, Liang Y, Li HP, Chang YS. Matrix metalloproteinase 12 is induced by heterogeneous nuclear ribonucleoprotein K and promotes migration and invasion in nasopharyngeal carcinoma. BMC Cancer. 2014;14:348. doi: 10.1186/1471-2407-14-348. [DOI] [PMC free article] [PubMed] [Google Scholar]
- 11.Zhu Y, Zou C, Zhang Z, Qian CN, Yang X, Shi J, Xia Y, Zhang J, Lu Y. MEK inhibitor diminishes nasopharyngeal carcinoma (NPC) cell growth and NPC-induced osteoclastogenesis via modulating CCL2 and CXCL16 expressions. Tumour Biol. 2015;36:8811–8818. doi: 10.1007/s13277-015-3595-8. [DOI] [PubMed] [Google Scholar]
- 12.Qu C, Liang Z, Huang J, Zhao R, Su C, Wang S, Wang X, Zhang R, Lee MH, Yang H. MiR-205 determines the radioresistance of human nasopharyngeal carcinoma by directly targeting PTEN. Cell Cycle. 2012;11:785–796. doi: 10.4161/cc.11.4.19228. [DOI] [PMC free article] [PubMed] [Google Scholar]
- 13.Saldanha AJ. Java Treeview--extensible visualization of microarray data. Bioinformatics. 2004;20:3246–3248. doi: 10.1093/bioinformatics/bth349. [DOI] [PubMed] [Google Scholar]
- 14.de Hoon MJ, Imoto S, Nolan J, Miyano S. Open source clustering software. Bioinformatics. 2004;20:1453–1454. doi: 10.1093/bioinformatics/bth078. [DOI] [PubMed] [Google Scholar]
- 15.Kumar L, E Futschik M. Mfuzz: a software package for soft clustering of microarray data. Bioinformation. 2007;2:5–7. doi: 10.6026/97320630002005. [DOI] [PMC free article] [PubMed] [Google Scholar]
- 16.Kuleshov MV, Jones MR, Rouillard AD, Fernandez NF, Duan Q, Wang Z, Koplev S, Jenkins SL, Jagodnik KM, Lachmann A, McDermott MG, Monteiro CD, Gundersen GW, Ma’ayan A. Enrichr: a comprehensive gene set enrichment analysis web server 2016 update. Nucleic Acids Res. 2016;44:W90–97. doi: 10.1093/nar/gkw377. [DOI] [PMC free article] [PubMed] [Google Scholar]
- 17.Tripathi S, Pohl MO, Zhou Y, Rodriguez-Frandsen A, Wang G, Stein DA, Moulton HM, DeJesus P, Che J, Mulder LC, Yanguez E, Andenmatten D, Pache L, Manicassamy B, Albrecht RA, Gonzalez MG, Nguyen Q, Brass A, Elledge S, White M, Shapira S, Hacohen N, Karlas A, Meyer TF, Shales M, Gatorano A, Johnson JR, Jang G, Johnson T, Verschueren E, Sanders D, Krogan N, Shaw M, Konig R, Stertz S, Garcia-Sastre A, Chanda SK. Meta- and orthogonal integration of influenza “OMICs” data defines a role for UBR4 in virus budding. Cell Host Microbe. 2015;18:723–35. doi: 10.1016/j.chom.2015.11.002. [DOI] [PMC free article] [PubMed] [Google Scholar]
- 18.Szklarczyk D, Morris JH, Cook H, Kuhn M, Wyder S, Simonovic M, Santos A, Doncheva NT, Roth A, Bork P, Jensen LJ, von Mering C. The STRING database in 2017: quality-controlled protein-protein association networks, made broadly accessible. Nucleic Acids Res. 2017;45:D362–D368. doi: 10.1093/nar/gkw937. [DOI] [PMC free article] [PubMed] [Google Scholar]
- 19.Subramanian A, Tamayo P, Mootha VK, Mukherjee S, Ebert BL, Gillette MA, Paulovich A, Pomeroy SL, Golub TR, Lander ES, Mesirov JP. Gene set enrichment analysis: a knowledge-based approach for interpreting genome-wide expression profiles. Proc Natl Acad Sci U S A. 2005;102:15545–15550. doi: 10.1073/pnas.0506580102. [DOI] [PMC free article] [PubMed] [Google Scholar]
- 20.Weidner C, Steinfath M, Opitz E, Oelgeschlager M, Schonfelder G. Defining the optimal animal model for translational research using gene set enrichment analysis. EMBO Mol Med. 2016;8:831–838. doi: 10.15252/emmm.201506025. [DOI] [PMC free article] [PubMed] [Google Scholar]
- 21.Banerjee DK. N-glycans in cell survival and death: cross-talk between glycosyltransferases. Biochim Biophys Acta. 2012;1820:1338–46. doi: 10.1016/j.bbagen.2012.01.013. [DOI] [PMC free article] [PubMed] [Google Scholar]
- 22.Ingram WJ, Crowther LM, Little EB, Freeman R, Harliwong I, Veleva D, Hassall TE, Remke M, Taylor MD, Hallahan AR. ABC transporter activity linked to radiation resistance and molecular subtype in pediatric medulloblastoma. Exp Hematol Oncol. 2013;2:26. doi: 10.1186/2162-3619-2-26. [DOI] [PMC free article] [PubMed] [Google Scholar]
- 23.Curtin NJ. DNA repair dysregulation from cancer driver to therapeutic target. Nat Rev Cancer. 2012;12:801–17. doi: 10.1038/nrc3399. [DOI] [PubMed] [Google Scholar]
- 24.Shaffer SM, Dunagin MC, Torborg SR, Torre EA, Emert B, Krepler C, Beqiri M, Sproesser K, Brafford PA, Xiao M, Eggan E, Anastopoulos IN, Vargas-Garcia CA, Singh A, Nathanson KL, Herlyn M, Raj A. Rare cell variability and drug-induced reprogramming as a mode of cancer drug resistance. Nature. 2017;546:431–435. doi: 10.1038/nature22794. [DOI] [PMC free article] [PubMed] [Google Scholar]
- 25.Feng XP, Yi H, Li MY, Li XH, Yi B, Zhang PF, Li C, Peng F, Tang CE, Li JL, Chen ZC, Xiao ZQ. Identification of biomarkers for predicting nasopharyngeal carcinoma response to radiotherapy by proteomics. Cancer Res. 2010;70:3450–3462. doi: 10.1158/0008-5472.CAN-09-4099. [DOI] [PubMed] [Google Scholar]
- 26.Guo Y, Zhu XD, Qu S, Li L, Su F, Li Y, Huang ST, Li DR. Identification of genes involved in radioresistance of nasopharyngeal carcinoma by integrating gene ontology and protein-protein interaction networks. Int J Oncol. 2012;40:85–92. doi: 10.3892/ijo.2011.1172. [DOI] [PubMed] [Google Scholar]
- 27.Zhang B, Qu JQ, Xiao L, Yi H, Zhang PF, Li MY, Hu R, Wan XX, He QY, Li JH, Ye X, Xiao ZQ, Feng XP. Identification of heat shock protein 27 as a radioresistance-related protein in nasopharyngeal carcinoma cells. J Cancer Res Clin Oncol. 2012;138:2117–2125. doi: 10.1007/s00432-012-1293-0. [DOI] [PubMed] [Google Scholar]
- 28.Grivennikov SI, Greten FR, Karin M. Immunity, inflammation, and cancer. Cell. 2010;140:883–899. doi: 10.1016/j.cell.2010.01.025. [DOI] [PMC free article] [PubMed] [Google Scholar]
- 29.Vilalta M, Rafat M, Graves EE. Effects of radiation on metastasis and tumor cell migration. Cell Mol Life Sci. 2016;73:2999–3007. doi: 10.1007/s00018-016-2210-5. [DOI] [PMC free article] [PubMed] [Google Scholar]
- 30.Chang C, Werb Z. The many faces of metalloproteases: cell growth, invasion, angiogenesis and metastasis. Trends Cell Biol. 2001;11:S37–S43. doi: 10.1016/s0962-8924(01)02122-5. [DOI] [PMC free article] [PubMed] [Google Scholar]
- 31.Cox TR, Erler JT. Remodeling and homeostasis of the extracellular matrix: implications for fibrotic diseases and cancer. Dis Model Mech. 2011;4:165–78. doi: 10.1242/dmm.004077. [DOI] [PMC free article] [PubMed] [Google Scholar]
- 32.Moncharmont C, Levy A, Guy JB, Falk AT, Guilbert M, Trone JC, Alphonse G, Gilormini M, Ardail D, Toillon RA, Rodriguez-Lafrasse C, Magné N. Radiation-enhanced cell migration/invasion process: a review. Crit Rev Oncol Hematol. 2014;92:133–42. doi: 10.1016/j.critrevonc.2014.05.006. [DOI] [PubMed] [Google Scholar]
- 33.You Y, Shan Y, Chen J, Yue H, You B, Shi S, Li X, Cao X. Matrix metalloproteinase 13-containing exosomes promote nasopharyngeal carcinoma metastasis. Cancer Sci. 2015;106:1669–77. doi: 10.1111/cas.12818. [DOI] [PMC free article] [PubMed] [Google Scholar]
- 34.Shan Y, You B, Shi S, Shi W, Zhang Z, Zhang Q, Gu M, Chen J, Bao L, Liu D, You Y. Hypoxia-induced matrix metalloproteinase-13 expression in exosomes from nasopharyngeal carcinoma enhances metastases. Cell Death Dis. 2018;9:382. doi: 10.1038/s41419-018-0425-0. [DOI] [PMC free article] [PubMed] [Google Scholar]
- 35.Klupp F, Neumann L, Kahlert C, Diers J, Halama N, Franz C, Schmidt T, Koch M, Weitz J, Schneider M, Ulrich A. Serum MMP7, MMP10 and MMP12 level as negative prognostic markers in colon cancer patients. BMC Cancer. 2016;16:494. doi: 10.1186/s12885-016-2515-7. [DOI] [PMC free article] [PubMed] [Google Scholar]
- 36.Barksby HE, Milner JM, Patterson AM, Peake NJ, Hui W, Robson T, Lakey R, Middleton J, Cawston TE, Richards CD, Rowan AD. Matrix metalloproteinase 10 promotion of collagenolysis via procollagenase activation: implications for cartilage degradation in arthritis. Arthritis Rheum. 2006;54:3244–3253. doi: 10.1002/art.22167. [DOI] [PubMed] [Google Scholar]
- 37.Rohani MG, McMahan RS, Razumova MV, Hertz AL, Cieslewicz M, Pun SH, Regnier M, Wang Y, Birkland TP, Parks WC. MMP-10 regulates collagenolytic activity of alternatively activated resident macrophages. J Invest Dermatol. 2015;135:2377–2384. doi: 10.1038/jid.2015.167. [DOI] [PMC free article] [PubMed] [Google Scholar]
Associated Data
This section collects any data citations, data availability statements, or supplementary materials included in this article.


