Abstract
The circadian system influences virtually all biological functions. Understanding the impact of circadian variation on metabolism may provide insight into mechanisms of circadian-associated disorders and guide the implementation of chrono-therapy. Previous research has reported circadian variation in 7-20% of metabolites in human blood. In this study, untargeted metabolomics profiles were measured using blood of two healthy men and one healthy woman, collected every two hours for up to 48 hours under carefully controlled conditions. The pattern of variation of each metabolite over time was examined on each participant separately, using both one- and two-order harmonic models. One hundred of 663 metabolites, representing all metabolite categories, showed diurnal rhythmic concentrations that exceeded the Bonferroni threshold (P<2.5×10⁻⁵). Overall, peak times of many metabolites were clustered during the afternoon-midnight, including the majority of amino acids, all peptides, all lysolipids and all phospholipids, whereas the majority of steroids peaked in the morning. We observed substantial inter-individual variation for both peak times and amplitudes in these three subjects. In conclusion, at least 15% of blood metabolites, representing a broad group of biological pathways, exhibit diurnal variation in three participants. The average peak times of most of these metabolites are clustered in morning or afternoon-midnight. Further work is needed to validate and extend this work in more individuals.
Keywords: circadian rhythm, diurnal, metabolomics, metabolites
Introduction
In parallel with the day-night and associated (e.g., activity, temperature, feeding) changes driven by the earth’s axial rotation, organisms have evolved an internal biological timer, the “circadian clock,” that exerts control over daily rhythms of physiology and behavior (Partch, Green et al., 2014; Czeisler, 2017). The circadian system regulates virtually all biological functions including the sleep-wake cycle, neurobehavioral performance, immune regulation, and metabolism of internal and external components (e.g., food, medications, xenobiotics) (Brzezinski, 1997; Partch, Green et al., 2014). Consistent with such broad involvement of circadian control, disrupted circadian rhythms have been linked to many diseases including psychiatric conditions (Lockley, Dijk et al., 2008), cardiovascular diseases (Vyas, Garg et al., 2012; Gu, Han et al., 2015), diabetes (Pan, Schernhammer et al., 2011) and cancer (Straif, Baan et al., 2007; Gu, Han et al., 2015). In the clinical setting, a potential application is “chrono-therapy” in which treatments are administered at times based on circadian variation in treatment sensitivity in order to improve treatment efficiency and reduce toxicity (Levi & Schibler, 2007). Understanding the impact of circadian variation on metabolism can provide insight into mechanisms of circadian-associated diseases and guide the implementation of chrono-therapy.
Circadian variation has been observed in 7-20% of metabolites in human blood in previous reports (Ang, Revell et al., 2012; Dallmann, Viola et al., 2012; Kasukawa, Sugimoto et al., 2012; Chua, Shui et al., 2013). These studies used early and diverse metabolomics platforms: one focused on lipids (Chua, Shui et al., 2013) and another included smaller numbers of known metabolites (Kasukawa, Sugimoto et al., 2012). An important limitation for a majority of these studies (Ang, Revell et al., 2012; Dallmann, Viola et al., 2012; Kasukawa, Sugimoto et al., 2012) was that they focused on average metabolite concentrations at the group level, and therefore missed the opportunity to explore inter-individual variability, a critical aspect for implementation of personalized chrono-therapy.
We examined the diurnal variation of metabolomics at the individual level in 3 healthy individuals, using untargeted metabolomics profiles that included 663 known metabolites across different classes (i.e., lipids, amino acids, carbohydrate, vitamins and cofactors, nucleotides, peptides, and xenobiotics). We studied two men and one woman participating in an inpatient protocol under carefully controlled conditions during waking episodes: dim light, controlled diet, no caffeine, tobacco, or alcohol, and limited physical activities. Sleep was scheduled for 10 hours at each individual’s habitual time. Blood samples were collected every 2 hours through an indwelling catheter for 48 hours (2 individuals) and 26 hours (one individual).
Materials and Methods
Study population
Three participants (two men and one woman) were recruited for this study, a value-added project on a 32-day inpatient study at the Brigham and Women Hospital (BWH) that was designed to examine the effects of chronic sleep restriction on human vigilance performance (McHill, Hull et al., 2018). The age of participants were: 23, 20 and 31 years old. Their ethnicities were: a non-Hispanic white, non-Hispanic black and a Hispanic. (Table 1) All were healthy by history, physical exam, and laboratory analyses of blood and urine. Exclusion criteria included an average self-reported habitual sleep duration <7 or >9 hours, history of night-shift work or transmeridian travel < 3 months prior to study, BMI <18 or >29.9, or pregnancy. None were taking any prescription or non-prescription medications, over-the-counter medications or supplements, caffeine, alcohol, or tobacco for 2 weeks prior to entry into the study. All kept a regular schedule of 10 hours time in bed with their choice of hours for at least 2 weeks prior to entering the inpatient portion of the protocol. All events in the inpatient portion of the protocol were timed relative to the individual’s habitual sleep and wake times. During each day, participants were provided a nutritionist-designed, isocaloric diet consisting of 55-60% carbohydrate, 15-30% fat, 15-20% protein, 150 mEq Na+ (+/− 20%), 100 mEq K+ (+/−20%), adjusted for sex, weight and age using the Harris-Benedict equation with an activity factor of 1.3 (Harris & Benedict, 1918). During each wake episode, participants were provided a breakfast, lunch, and dinner and were instructed to consume all food provided.
Table 1.
Characteristics of study participants
| Participant ID | Sex | Age | Ethnicity | DLMO time |
Scheduled Sleep Onset time |
|---|---|---|---|---|---|
| Participant 1 (P1) | Female | 23 | Non-Hispanic African American | 21:32 | 22:05 |
| Participant 2 (P2) | Male | 20 | Non-Hispanic White | 20:46 | 21:30 |
| Participant 3 (P3) | Male | 31 | Hispanic | 20:17 | 19:17 |
DLMO: Dim Light Melatonin Onset
The protocol was approved by the Partners Healthcare IRB. All participants gave informed consent. The study was registered as clinical trial #NCT01581125.
Sample collection
During the inpatient portion of the study, participants lived within the BWH Center for Clinical Investigation, and blood samples were collected through an intravenous catheter every hour. Our project used blood samples collected every 2 hours from inpatient days 5-7, which was during the baseline condition before the intervention section of a 32-day inpatient study (details published previously (McHill, Hull et al., 2018)). Blood was mixed well immediately after being injected into EDTA tubes and placed on ice within 5 minutes of blood collection. Samples were then centrifuged for 10 minutes on a 4°C centrifuge, immediately aliquoted and snap frozen on ethanol and dry ice (95% ethyl alcohol). Samples were shipped to the National Cancer Institute on dry ice via overnight delivery, to be stored in a −80°C refrigerator.
Blood was analyzed for melatonin concentration. The Dim Light Melatonin Onset (DLMO) was calculated for each individual and used to determine each individual’s internal biological circadian time (Benloucif, Burgess et al., 2008). DLMO was the interpolated time of crossing of 10 pg/ml for participants 1 and 3 and of 5 pg/ml for participant 2.
Metabolomics assay
Metabolomics assays were performed by Metabolon Inc.; the platform and process have been described elsewhere (Evans, DeHaven et al., 2009; Suhre, Shin et al., 2011). Study samples were transported to Metabolon on dry ice and immediately stored at −80°C. At the time of analysis, samples were extracted and prepared for analysis using Metabolon’s standard solvent extraction method. The extracted samples were analyzed using ultra high-performance liquid-phase chromatography and gas chromatography coupled with mass spectrometry and tandem mass spectrometry. The mass spectra peaks were compared with a chemical reference library generated from over 2500 standards, to identify individual metabolites. The Metabolon Inc. detected 663 metabolites with known identity in plasma; all were included for our analyses.
Statistical analyses
Normalization was performed on the metabolite measures by dividing the raw data for each metabolite by the median of all measurements for that metabolite from the three subjects across time. Therefore, plots across time and individual show subject differences as well as circadian changes on a similar scale across metabolites. All the analyses were based on the normalized values. Values below the detection limit were replaced by the lowest observed value from that individual.
We examined the pattern of variation of each metabolite over time on each participant separately, using harmonic regression models. We fit both one- and two-order harmonic models for each metabolite on each subject. The mathematical formulation for the first and second harmonic models are: and , respectively, where t reflects time in hours and the error is assumed normal with constant variability. We tested for diurnal patterns in a two-step procedure: (i) test for a one-harmonic 24-hour curve (simple cosine curve) versus a constant mean structure and (ii) test for a two-harmonic curve versus a one-harmonic curve.
If the first test was not significant at the 0.01 level, we considered this as no evidence of a diurnal pattern and we present a constant value of the mean (flat line). If the first test was significant and the second test was not, we present the fit for the one-harmonic model. Lastly, if both tests were significant, we present the fit for the two-harmonic model. All statistical tests are subject- and metabolite- specific in that they test whether there is evidence for a circadian rhythm on a particular metabolite on a particular participant. The analyses make no attempt to make population-based inference with only three subjects. Bonferroni corrections were applied to adjust for the multiple comparisons made for the large number of metabolites considered.
Peak time was defined as the time for the maximum value of the fit metabolite-specific harmonic curve. Amplitude was defined as the difference between the fit highest value and the fit lowest value over a 24-hour period using either the one- or two-harmonic model chosen as defined above.
We analyzed data based on (i) local clock time in the Eastern Time Zone, where the samples were collected, (ii) each participant’s internal biological circadian time, as defined by DLMO, and (iii) each participant’s habitual bedtime.
Results
DLMO was 21:32 for participant 1, 20:46 for participant 2, and 20:17 for participant 3. Sleep onset time was 22:05, 21:30, and 19:17, respectively for participants1-3. Therefore, the relationship between DLMO and Sleep Onset time was +0:33, +0:44, and −1:00 hr, respectively, which is within the range observed for normally entrained individuals (Wright, Gronfier et al., 2005). We present timing values relative to clock time, DLMO, and sleep onset time; clock time is the least physiological reference marker.
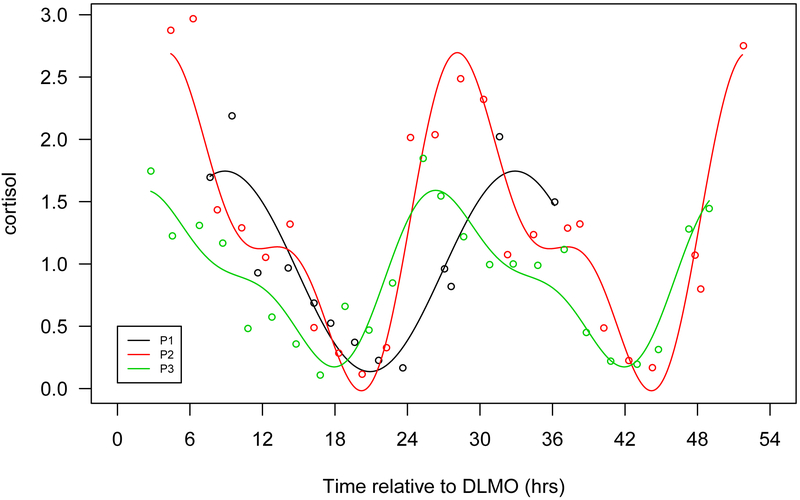
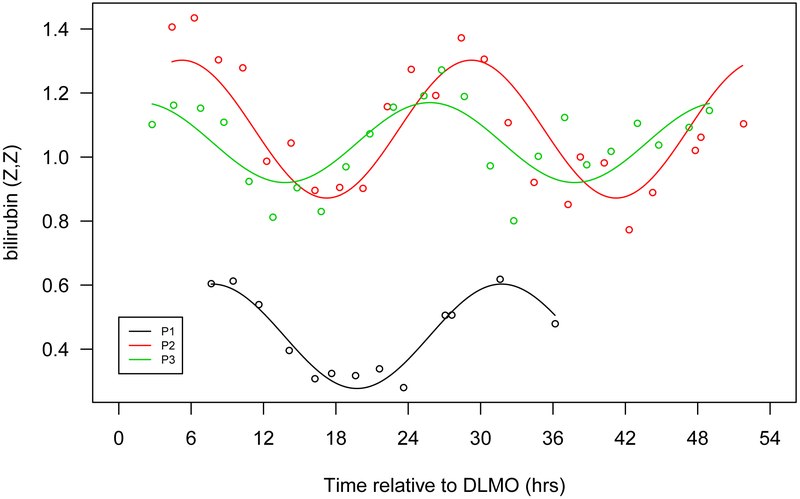
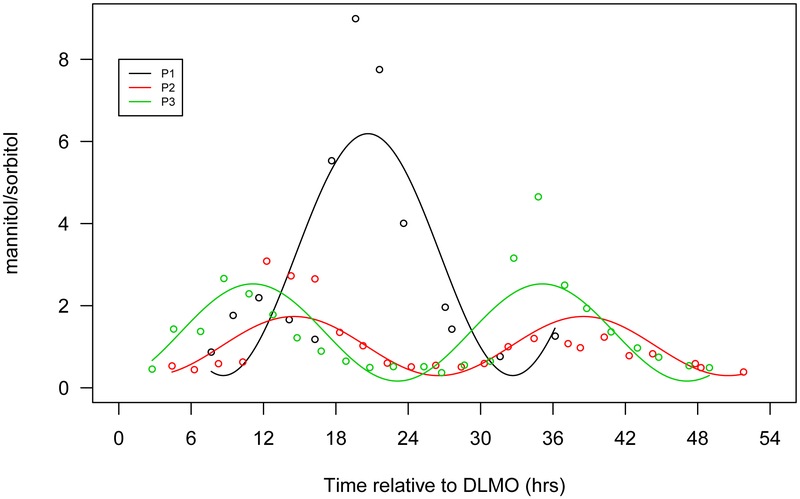
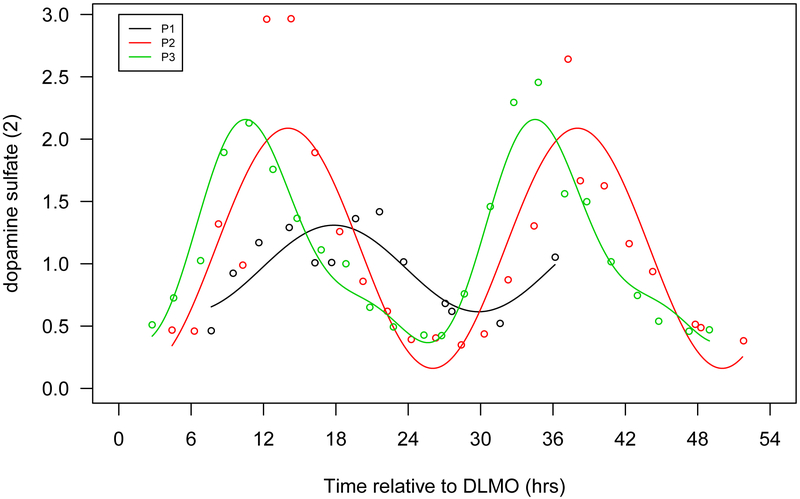
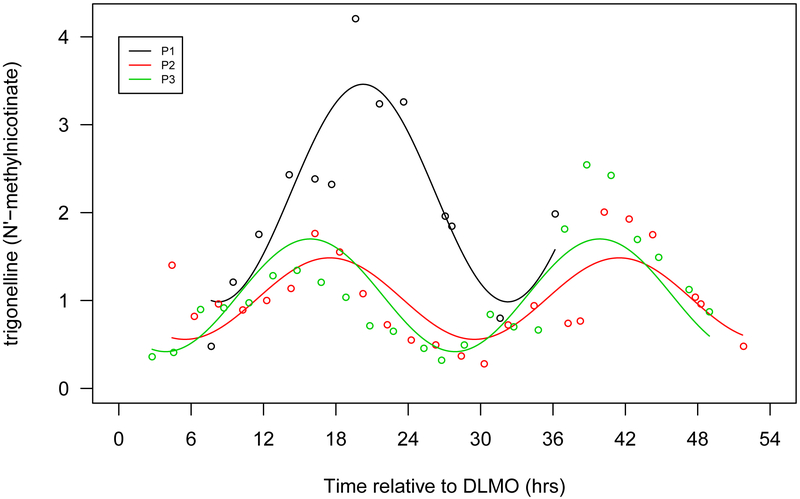
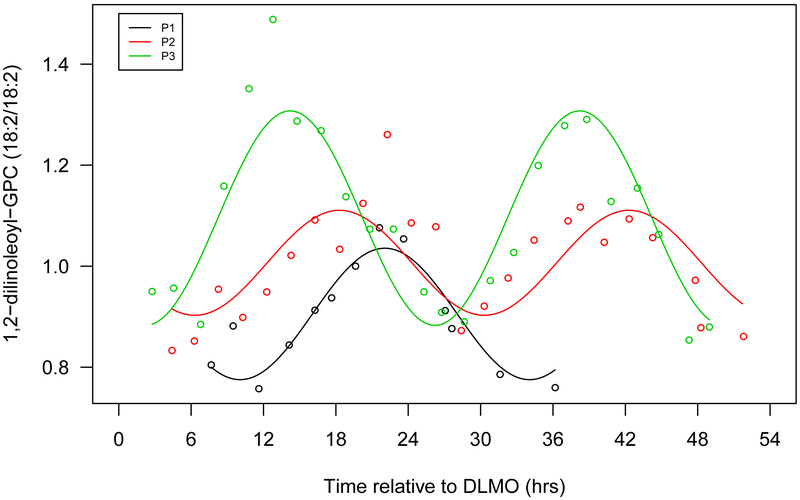
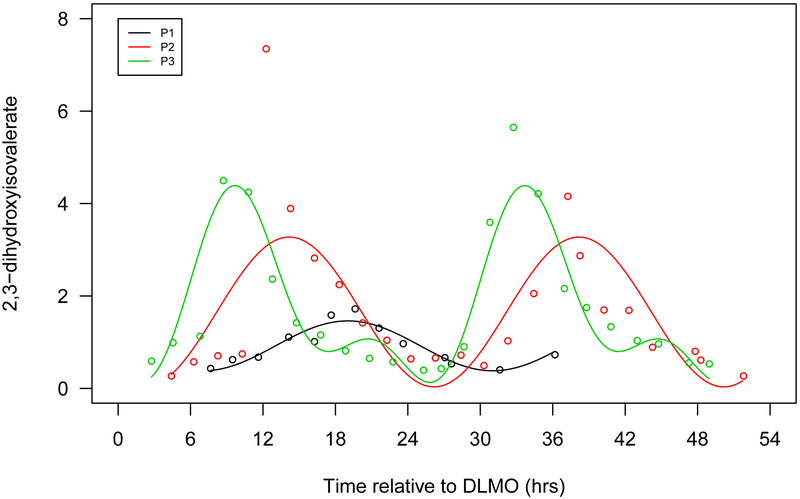
The metabolomics platform included 663 metabolites with known identities in plasma. Among these metabolites, 401 showed diurnal rhythmic concentration at the 0.01 significance criteria for at least one participant, 100 of which (15% of total metabolites) survived Bonferroni correction (P<2.5×10⁻⁵) (Table 2, Supplementary Table 1). Fifty-two metabolites showed significant diurnal rhythmic concentrations in all three participants (P<0.01) (Table 2) and importantly, 40 of these 52 metabolites passed Bonferroni correction criteria for at least one participant. (Supplementary Table 2) We present some examples of rhythmic metabolites in Figure 1a-g.
Table 2.
Number and percentage of metabolites with statistically significant rhythms based on different p value thresholds
| P<0.01 | P<0.001 | P<0.0001 | P<2.5×10⁻⁵ (0.05/663/3) (Bonferroni corrected) |
|||||
|---|---|---|---|---|---|---|---|---|
| No. | % | No. | % | No. | % | No. | % | |
| All metabolites (N=663) | 401 | 60.5 | 241 | 36.4 | 137 | 20.7 | 100 | 15.1 |
| Significant in: 1 participant | 224 | 33.8 | 166 | 25.0 | 106 | 16.0 | 74 | 11.2 |
| in 2 participants | 125 | 18.9 | 59 | 8.9 | 30 | 4.5 | 25 | 3.8 |
| in 3 participants | 52 | 7.8 | 16 | 2.4 | 1 | 0.2 | 1 | 0.2 |
Figure 1.
Seven selected metabolites that showed diurnal rhythms in normalized concentration in all 3 participants. a. Cortisol, b. bilirubin (Z,Z), c. mannitol/sorbitol, d. dopamine sulphate (2), e. trigonelline (N'-methylnicotinate), f. 1,2-dilinoleoyl-GPC (18:2/18:2), g. 2,3-dihydroxyisovalerate. The x-axis is based on the scale of the DLMO time. The y-axis presents the normalized value of metabolite concentration.
Metabolites that exhibited a diurnal rhythm were found in all metabolic categories (i.e., amino acid, carbohydrate, cofactors and vitamins, energy, lipid, nucleotide, peptide and xenobiotics) in a manner that was proportional to their overall distribution in this metabolomics platform; lipids and amino acids represented the majority (25.6% and 48.4%, respectively). (Table 3)
Table 3.
Number of metabolites with statistically significant rhythms based on different thresholds in each category
| Significant for at least 1 participant |
||||||||||||
|---|---|---|---|---|---|---|---|---|---|---|---|---|
| P<0.01 | P<0.001 | P<0.0001 | P<2.5×10⁻⁵ (Bonferroni corrected) |
P<0.01 for all 3 participants |
All known metabolites in the platform |
|||||||
| No. | % | No. | % | No. | % | No. | % | No. | % | No. | % | |
| Amino Acid | 103 | 25.7 | 61 | 25.3 | 36 | 26.3 | 27 | 27.0 | 13 | 25.0 | 170 | 25.6 |
| Carbohydrate | 15 | 3.7 | 11 | 4.6 | 6 | 4.4 | 4 | 4.0 | 3 | 5.8 | 23 | 3.5 |
| Cofactors and Vitamins | 11 | 2.7 | 8 | 3.3 | 5 | 3.7 | 3 | 3.0 | 3 | 5.8 | 23 | 3.5 |
| Energy | 5 | 1.3 | 2 | 0.8 | 0 | 0 | 0 | 0 | 1 | 1.9 | 8 | 1.2 |
| Lipid | 198 | 49.4 | 116 | 48.1 | 65 | 47.5 | 50 | 50.0 | 24 | 46.2 | 321 | 48.4 |
| Nucleotide | 9 | 2.2 | 6 | 2.5 | 3 | 2.2 | 1 | 1.0 | 0 | 0 | 31 | 4.7 |
| Peptide | 13 | 3.2 | 9 | 3.7 | 7 | 5.1 | 5 | 5.0 | 5 | 9.6 | 23 | 3.5 |
| Xenobiotics | 47 | 11.7 | 28 | 11.6 | 15 | 11.0 | 10 | 10.0 | 3 | 5.8 | 64 | 9.7 |
| Total | 401 | 100 | 241 | 100 | 137 | 100 | 100 | 100 | 52 | 100 | 663 | 100 |
52 metabolites showed rhythmic concentration in all 3 participants. (Supplementary Table 2) A majority (10 of 13) of the amino acids and all five peptides had a peak time between late afternoon (~3:00 pm) and midnight; the remaining three amino acids had a peak time midnight to mid-morning (midnight till 10:00 am). Among 24 rhythmic lipid metabolites, 14 had a peak time from afternoon until midnight, including all 5 lysolipids, all 7 lipids involved in phospholipid metabolism, and 1 of each involved in the secondary bile acid metabolism and sphingolipid metabolism. For the remaining 10 lipids, 6 steroids peaked in the morning (5:30-11:30 am), 1 steroid peaked in the early afternoon (noon-3:30 pm), and 3 xenobiotics showed peak times between noon and ~9:00 pm. Carbohydrate, cofactors and vitamins showed variable peak times.
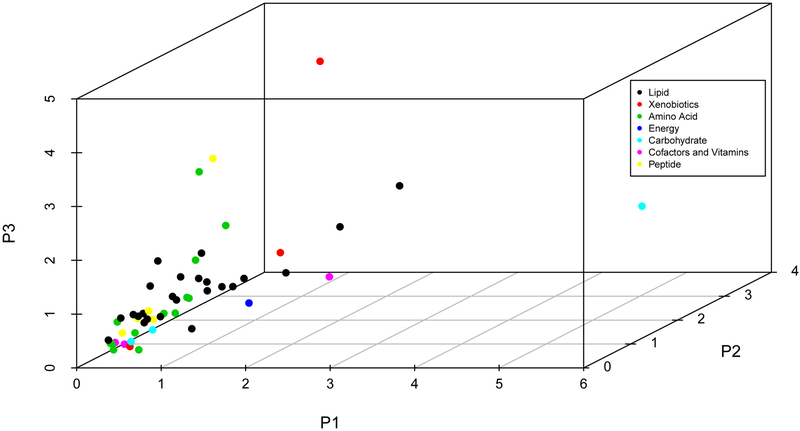
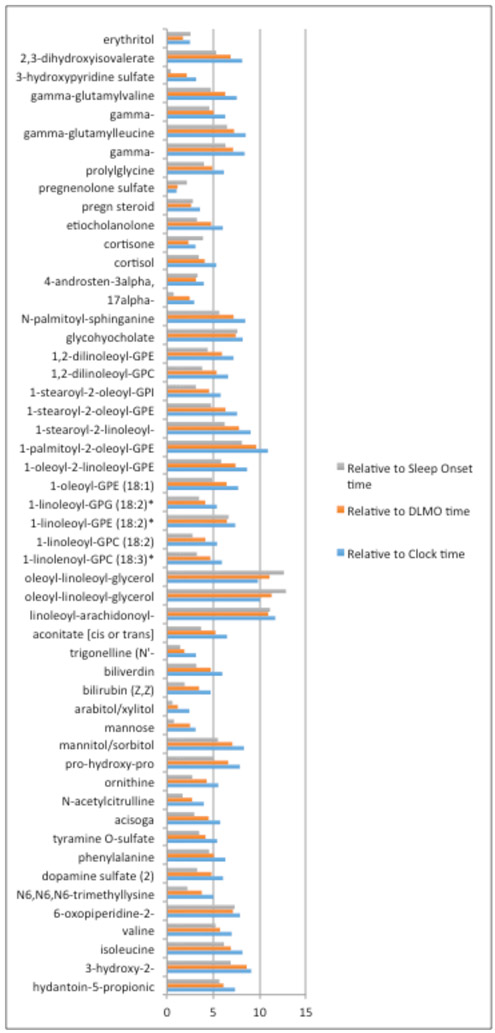
There was inter-individual variability for both the peak time and amplitude for all three reference times: clock time, DLMO time, or sleep onset time. (Figure 2a-2b, Supplementary Table 2) The minimum inter-individual range of peak times was for DLMO of about 1 hour (pregnenolone sulfate), while the maximum range was about 12 hours (oleoyl-linoleoyl-glycerol (18:1/18:2) [1]). (Supplementary Table 2) Such individual variations were largely due to participant 1, whose metabolite peak times were delayed substantially and consistently compared to the other two participants. (Table 4, Supplementary Table 2) This is consistent with the fact that DLMO and sleep time of participant 1 were slightly later than the other two, respectively. When we compared the peak times based on different time scales, we found the range of the peak times was the largest when using clock time, and smallest when using the sleep time for most of metabolites; The average (across all metabolites) inter-person ranges were 6.4 hours, 5.4 hours and 4.5 hours based on clock time, DLMO time and sleep onset time, respectively. (Figure 3)
Figure 2.
Peak time (a) and amplitude (b) for 53 known metabolites that showed diurnal variation in all 3 participants, by chemical classification
Table 4.
Peak time and amplitude of 52 metabolites that showed significant (P<0.01) circadian rhythm in all 3 participants*
| Peak time-DLMO** | Amplitude¶ | Participants with P- value<2.5×10⁻⁵♯ |
|||||
|---|---|---|---|---|---|---|---|
| Metabolite | P1 | P2 | P3 | P1 | P2 | P3 | |
| Amino Acid | |||||||
| hydantoin-5-propionic acid | 1.45 | −4.02 | −4.64 | 0.77 | 1.15 | 1.49 | P1, P2 |
| 3-hydroxy-2-ethylpropionate | 8.2 | 9.53 | 0.44 | 0.50 | 0.43 | 0.15 | |
| isoleucine | 3.95 | −2.01 | −2.94 | 0.53 | 0.30 | 0.52 | P3 |
| valine | 4.7 | −0.36 | −1.03 | 0.24 | 0.32 | 0.31 | |
| 6-oxopiperidine-2-carboxylate | 0.63 | −6.48 | −4.57 | 0.85 | 0.83 | 0.94 | P2 |
| N6,N6,N6-trimethyllysine | 3.52 | 3.31 | −0.24 | 0.32 | 0.28 | 0.73 | P3 |
| dopamine sulfate (2) | −1.24 | −3.51 | −6.04 | 0.69 | 1.93 | 1.79 | P2, P3 |
| phenylalanine | 1.25 | −3.11 | −3.8 | 0.31 | 0.22 | 0.24 | P3 |
| tyramine O-sulfate | 1.64 | −1.66 | −2.52 | 0.68 | 1.39 | 3.03 | P2 |
| acisoga | 12.26 | 10.11 | 7.77 | 0.68 | 0.87 | 0.63 | P2 |
| N-acetylcitrulline | −0.36 | −1.86 | −3.08 | 1.18 | 0.28 | 1.17 | P3 |
| ornithine | 0.55 | −1.7 | −3.74 | 0.26 | 0.24 | 0.35 | |
| pro-hydroxy-pro | 10.91 | 7.6 | 4.3 | 0.41 | 1.11 | 0.52 | P2 |
| Carbohydrate | |||||||
| mannitol/sorbitol | 1.6 | −3.01 | −5.45 | 5.89 | 1.44 | 2.37 | |
| mannose | 6.52 | 7.17 | 4.68 | 0.71 | 0.33 | 0.56 | |
| arabitol/xylitol | −3.45 | −3.48 | −4.62 | 0.46 | 0.34 | 0.34 | P3 |
| Cofactor and Vitamins | |||||||
| bilirubin (Z,Z) | 12.68 | 10.94 | 7.97 | 0.33 | 0.43 | 0.25 | P1, P2 |
| biliverdin | −11.08 | −11.87 | −15.8 | 0.24 | 0.39 | 0.30 | P2 |
| trigonelline (N'-methylnicotinate) | 1.2 | −0.05 | −0.68 | 2.48 | 0.93 | 1.28 | |
| Energy | |||||||
| aconitate [cis or trans] | −3.15 | −5.86 | −8.38 | 1.59 | 0.81 | 0.85 | |
| Lipid | |||||||
| Diacylglycerol | |||||||
| linoleoyl-arachidonoyl-glycerol (18:2/20:4) [2]* | 1.97 | −8.95 | −6.69 | 0.61 | 0.64 | 1.70 | |
| oleoyl-linoleoyl-glycerol (18:1/18:2) [1] | −20.04 | −13.37 | −8.76 | 0.56 | 0.49 | 0.69 | P2, P3 |
| oleoyl-linoleoyl-glycerol (18:1/18:2) [2] | 3.86 | 11.25 | 14.92 | 0.72 | 0.49 | 0.73 | |
| Lysolipid | |||||||
| 1-linolenoyl-GPC (18:3)* | 1.84 | −1.21 | −2.84 | 0.37 | 0.27 | 0.80 | P3 |
| 1-linoleoyl-GPC (18:2) | 1.27 | −1.31 | −2.88 | 0.48 | 0.45 | 0.76 | P2, P3 |
| 1-linoleoyl-GPE (18:2)* | 1.11 | −5.36 | −5.01 | 0.82 | 0.73 | 1.37 | P3 |
| 1-linoleoyl-GPG (18:2)* | −1.07 | −4.35 | −5.2 | 0.85 | 0.59 | 1.00 | P3 |
| 1-oleoyl-GPE (18:1) | 1.64 | −2.91 | −4.79 | 0.80 | 1.22 | 1.59 | P2, P3 |
| Phospholipid | |||||||
| 1-oleoyl-2-linoleoyl-GPE (18:1/18:2)* | 1.25 | −3.27 | −6.14 | 1.19 | 0.63 | 1.15 | P1, P3 |
| 1-palmitoyl-2-oleoyl-GPE (16:0/18:1) | 2.5 | −4.71 | −7.13 | 0.49 | 0.32 | 0.85 | P3 |
| 1-stearoyl-2-linoleoyl-GPE (18:0/18:2)* | 1.12 | −4.1 | −6.65 | 0.78 | 0.64 | 1.04 | P2, P3 |
| 1-stearoyl-2-oleoyl-GPE (18:0/18:1) | 1.54 | −3 | −4.77 | 0.89 | 1.00 | 1.22 | P2, P3 |
| 1-stearoyl-2-oleoyl-GPI (18:0/18:1)* | 1.61 | −1.32 | −2.93 | 0.45 | 0.62 | 0.56 | P3 |
| 1,2-dilinoleoyl-GPC (18:2/18:2) | 3 | 0.77 | −2.35 | 0.26 | 0.21 | 0.42 | P3 |
| 1,2-dilinoleoyl-GPE (18:2/18:2)* | 0.1 | −2.21 | −5.83 | 3.13 | 1.25 | 2.83 | P2, P3 |
| Steroid | |||||||
| 17alpha-hydroxypregnenolone sulfate | 12.37 | 12.42 | 9.48 | 0.85 | 2.04 | 0.76 | P2 |
| 4-androsten-3alpha,17alpha-diol monosulfate (2) | 13.78 | 9.9 | 9.81 | 0.79 | 1.90 | 0.67 | P2 |
| cortisol | 13.84 | 9.83 | 8.52 | 1.61 | 2.71 | 1.42 | P2, P3 |
| cortisone | 12.86 | 9.78 | 11.45 | 1.46 | 1.83 | 0.96 | P2, P3 |
| etiocholanolone glucuronide | 14.1 | 10.72 | 8.07 | 0.89 | 0.85 | 0.35 | P2 |
| pregn steroid monosulfate* | 17.94 | 14.57 | 14.38 | 0.38 | 0.73 | 0.69 | P2 |
| pregnenolone sulfate | 13.46 | 13.85 | 12.81 | 0.88 | 1.51 | 0.84 | P2 |
| Other lipids | |||||||
| glycohyocholate | 0.95 | −6.46 | −1.41 | 0.38 | 0.89 | 1.13 | |
| N-palmitoyl-sphinganine (d18:0/16:0) | 2.02 | −2.18 | −5.17 | 1.12 | 0.76 | 1.26 | P2, P3 |
| Peptide | |||||||
| prolylglycine | 0.82 | −3 | −4.07 | 0.89 | 1.29 | 3.32 | P2, P3 |
| gamma-glutamylisoleucine* | 5.33 | −0.8 | −1.8 | 0.58 | 0.48 | 0.85 | P2, P3 |
| gamma-glutamylleucine | 4.81 | −1.49 | −2.43 | 0.47 | 0.45 | 0.72 | P3 |
| gamma-glutamylphenylalanine | 2.25 | −2.14 | −2.78 | 0.55 | 0.64 | 0.62 | P3 |
| gamma-glutamylvaline | 5.05 | 0.5 | −1.23 | 0.37 | 0.31 | 0.51 | P3 |
| Xenobiotics | |||||||
| 3-hydroxypyridine sulfate | −5.65 | −5.41 | −7.55 | 1.65 | 1.37 | 1.54 | |
| 2,3-dihydroxyisovalerate | −0.03 | −3.37 | −6.89 | 1.08 | 3.24 | 4.26 | P3 |
| erythritol | −2.7 | −4.43 | −3.62 | 0.41 | 0.40 | 0.22 | |
Results were from one- and two-order harmonic models. Amplitude was defined as the difference between the fit highest value and the fit lowest value over a 24-hour period using either the one- or two-harmonic model.
Peak time was defined as the time for the maximum value of the fit metabolite-specific harmonic curve. Peak time-DLMO was defined as the difference between the eastern time zone clock time (Supplementary Table 2) minus the Dim Light Melatonin Onset (DLMO) time of each participant (P1=21:32, P2=20:46 and P3=20:17). Some values additionally added 24, for convenience of comparison.
The amplitude was based on the median normalized concentration of each metabolite
Participants whose p-value for circadian rhythm <2.5×10⁻⁵ (0.05/663/3) met the Bonferroni corrected significance level.
Figure 3.
Ranges of peak time among 3 participants based on scales of Clock time, DLMO time and Sleep onset time for the 53 known metabolites (Supplementary Table 2).
Blue color represents the peak time range based on the clock time; orange color represents the peak time range based on the peak times relative to the DLMO time for each participant; the grey color represents the peak time range based on the peak times relative to the habitual sleep time for each participant.
Discussion
Using an untargeted metabolomics profile, we found 15% of identified blood metabolites exhibited diurnal rhythms. This is consistent with previous publications that reported 7-19% of metabolites with circadian rhythmicity (Ang et al. 2012; Chua et al. 2013; Dallmann et al. 2012; Kasukawa et al. 2012). Consistent with Ang et al (Ang, Revell et al., 2012), these metabolites are distributed across all classes and therefore suggest the involvement of circadian processes in diverse biological pathways.
Peak times of many metabolites are clustered during late afternoon-midnight, including a majority of amino acids, all peptides, all lysolipids and all phospholipids. These evening peak amino acids include all three involved in phenylalanine and tyrosine metabolism (Table 4), suggesting that evening might be the most active time for dopamine biosynthesis and dopamine related physiology. Dopamine plays important roles in both central nervous systems and peripheral tissues, including, but not restricted to, regulating addiction and learning, cognition, mood, reward-motivation systems, pain perception, sexual behavior, respiration, gastrointestinal motility, and blood pressure (Rubi & Maechler, 2010). Our results are consistent with diurnal rhythms for these processes. Another evening peak amino acid, N-a-Acetylcitrulline, is an N-acetylated metabolite of citrulline that is part of the arginine biosynthetic pathway; arginine has been considered an essential substrate for wound healing processes (Alexander & Supp, 2014).
Phospholipids and lysolipids also peak during the evening. Phospholipids are the major components of cell membranes, and are a source of energy. They can also be split into smaller molecules called chemokines, to regulate a variety of cell activities such as production of certain proteins and cell migration. Lysolipids incorporate into lipid membranes and influence their permeability.
In contrast, steroids peak in the morning. These molecules include cortisol, pregnenolone sulfate, and bilirubin. Cortisol is a hormone that increases in response to diverse physiologic stimuli, such as stress and low blood-glucose concentration. The morning rise in cortisol serves to increase blood sugar, elevate blood pressure, suppress the immune system, and to aid in macronutrient metabolism of fat, protein, and carbohydrates (Martin PA, 2003). Our results are consistent with previous reports in humans that blood cortisol has diurnal variation and peaks in the morning (Ang, Revell et al., 2012),(Martin PA, 2003). Pregnenolone sulfate has cognitive, memory enhancing and antidepressant effects (Reddy, 2010). Bilirubin, a product of heme catabolism, which has been suggested as a potent cellular antioxidant (Sedlak, Saleh et al., 2009).
The peak time of many metabolites in our data are in accord with Ang et al (Ang, Revell et al., 2012) who reported that the majority of amino acids, lysolipids and phospholipids peak in the evening and cortisol and bilirubin peak at morning. However, our findings contrast with Dallman et al(Dallmann, Viola et al., 2012), in which fatty acids were the major rhythmic metabolites in blood and the peak times were mainly in the late morning. The major difference in design is that our report and the Ang study allowed people to sleep, while Dallman’s study kept participants awake. The sleep deprivation induced in that study design might explain some differences, such as for cortisol, a hormone that was reported to be increased by sleep deprivation in one human study (Leproult, Copinschi et al., 1997). The peak time of cortisol reported by Dallman is about 4:00 am, about 4 hours earlier than our study and other reports(Martin PA, 2003),(Ang, Revell et al., 2012). The peak times of biomarkers estimated under ‘constant routine’ conditions, when participants are kept awake and therefore had some sleep deprivation, may not represent the peak times of these markers when participants are in their usual sleep/wake schedule with associated changes in eating, posture, light exposure, and activity. Our data suggest that differences of sleep time or the associated changes in eating, posture, light exposure and activity, may partially explain the cross-subject variation in peak times of many metabolites to a larger extent than the circadian time (as measured by DLMO), but larger studies with diverse design will be needed to precisely address these questions.
The smaller range of inter-individual peak values when timing was referenced to sleep and the DLMO timing in comparison to clock time suggests that the timing of individual’s sleep-wake cycle and/or circadian cycle is relevant for the rhythms observed in these metabolites. Therefore, sleep time or circadian time would be expected be a better predictor of the timing of any treatment (“chronotherapy”) than clock time. Further studies are required to translate this to clinical practice.
Limitations
Our study scheduled participants to sleep at their usual time. Therefore, our study could not quantify the amount to which the observed diurnal rhythms of metabolomics are due to endogenous circadian rhythms, and/or sleep/wake and associated changes (e.g., posture, feeding/fasting). As a pilot study, we only included three participants with similar circadian phases (1.5-hour difference), therefore these results do not capture the full range of population heterogeneity in circadian phases of these metabolites. Also, with only three participants, we can make very limited inferences regarding inter-person heterogeneity, but rather, descriptively report differences that we found in these three participants.
Strengths
For each individual, we obtained 13 (for one person) or 24 (for two persons) time points, allowing us to evaluate diurnal variation of metabolomics at the individual level with reasonable power. The strict inpatient protocol allowed us to reduce the confounding effect of inter-individual differences due to food/caffeine/alcohol/tobacco/drug intake, activity, and light exposure. In this study, participants were allowed to sleep at habitual times, which avoided the confounding effect of sleep deprivation that could be induced by “constant routine” conditions and thus our results are more applicable to real populations.
Implementations
The broad influence of diurnal rhythm in different metabolite pathways suggest that diurnal/circadian rhythms may be an important source of variation for metabolites. Such diurnal variations of metabolites could contribute to variable drug efficacy and toxicity by time of day (chronotherapy). Although we only had three participants, the large inter-person variation for peak times observed among these three participants suggests that the optimum timing of therapy may differ by individuals. For metabolites with circadian variation, especially those with large amplitude, the time of sample collection should be considered for designing and interpreting of metabolomics research.
Conclusion
At least 15% of known blood metabolites involved in broad range of biological pathways exhibit diurnal variation. The average peak times of these metabolites are mainly clustered at early morning or evening. Further work is needed to validate and extend this work in more individuals both healthy and with pathologies.
Supplementary Material
Acknowledgments
Funding
This work was supported by the Intramural Research Program of the Division of Cancer Epidemiology and Genetics of the National Cancer Institute. EBK was supported by K24HL105664, R01HL114088, R01GM105018, R01HL128538, P01AG00997. FG was also supported by Roswell Park Cancer Institute Cancer Center Support Grant P30CA016056. In addition, the experimental work was conducted with support from Harvard Catalyst ∣ The Harvard Clinical and Translational Science Center (National Center for Advancing Translational Sciences, National Institutes of Health Award UL 1TR002541) and financial contributions from Harvard University and its affiliated academic healthcare centers. The content is solely the responsibility of the authors and does not necessarily represent the official views of Harvard Catalyst, Harvard University and its affiliated academic healthcare centers, or the National Institutes of Health.
Footnotes
Declaration of Interest Statement
The authors declare no conflicts of interest
References:
- Alexander JW, Supp DM. (2014). Role of Arginine and Omega-3 Fatty Acids in Wound Healing and Infection. Advances in wound care. 3:682–690. [DOI] [PMC free article] [PubMed] [Google Scholar]
- Ang JE, Revell V, Mann A, Mantele S, Otway DT, Johnston JD, Thumser AE, Skene DJ, Raynaud F. (2012). Identification of human plasma metabolites exhibiting time-of-day variation using an untargeted liquid chromatography-mass spectrometry metabolomic approach. Chronobiology international. 29:868–881. [DOI] [PMC free article] [PubMed] [Google Scholar]
- Benloucif S, Burgess HJ, Klerman EB, Lewy AJ, Middleton B, Murphy PJ, Parry BL, Revell VL. (2008). Measuring melatonin in humans. Journal of clinical sleep medicine : JCSM : official publication of the American Academy of Sleep Medicine. 4:66–69. [PMC free article] [PubMed] [Google Scholar]
- Brzezinski A (1997). Melatonin in humans. The New England journal of medicine. 336:186–195. [DOI] [PubMed] [Google Scholar]
- Chua EC, Shui G, Lee IT, Lau P, Tan LC, Yeo SC, Lam BD, Bulchand S, Summers SA, Puvanendran K, Rozen SG, Wenk MR, Gooley JJ. (2013). Extensive diversity in circadian regulation of plasma lipids and evidence for different circadian metabolic phenotypes in humans. Proc Natl Acad Sci U S A. 110:14468–14473. [DOI] [PMC free article] [PubMed] [Google Scholar]
- Czeisler CA, Buxton OM (2017). Human Circadian System and Sleep-Wake Regulation In Kryger MH, Roth T, Dement WC (eds). Principles and Practice of Sleep Medicine. 6th edition, Philadelphia: WB Saunders: p. 362–376. [Google Scholar]
- Dallmann R, Viola AU, Tarokh L, Cajochen C, Brown SA. (2012). The human circadian metabolome. Proc Natl Acad Sci U S A. 109:2625–2629. [DOI] [PMC free article] [PubMed] [Google Scholar]
- Evans AM, DeHaven CD, Barrett T, Mitchell M, Milgram E. (2009). Integrated, nontargeted ultrahigh performance liquid chromatography/electrospray ionization tandem mass spectrometry platform for the identification and relative quantification of the small-molecule complement of biological systems. Analytical chemistry. 81:6656–6667. [DOI] [PubMed] [Google Scholar]
- Gu F, Han J, Laden F, Pan A, Caporaso NE, Stampfer MJ, Kawachi I, Rexrode KM, Willett WC, Hankinson SE, Speizer FE, Schernhammer ES. (2015). Total and cause-specific mortality of U.S. nurses working rotating night shifts. American journal of preventive medicine. 48:241–252. [DOI] [PMC free article] [PubMed] [Google Scholar]
- Harris JA, Benedict FG. (1918). A Biometric Study of Human Basal Metabolism. Proc Natl Acad Sci U S A. 4:370–373. [DOI] [PMC free article] [PubMed] [Google Scholar]
- Kasukawa T, Sugimoto M, Hida A, Minami Y, Mori M, Honma S, Honma K, Mishima K, Soga T, Ueda HR. (2012). Human blood metabolite timetable indicates internal body time. Proc Natl Acad Sci U S A. 109:15036–15041. [DOI] [PMC free article] [PubMed] [Google Scholar]
- Leproult R, Copinschi G, Buxton O, Van Cauter E. (1997). Sleep loss results in an elevation of cortisol levels the next evening. Sleep. 20:865–870. [PubMed] [Google Scholar]
- Levi F, Schibler U. (2007). Circadian rhythms: mechanisms and therapeutic implications. Annual review of pharmacology and toxicology. 47:593–628. [DOI] [PubMed] [Google Scholar]
- Lockley SW, Dijk DJ, Kosti O, Skene DJ, Arendt J. (2008). Alertness, mood and performance rhythm disturbances associated with circadian sleep disorders in the blind. Journal of sleep research. 17:207–216. [DOI] [PMC free article] [PubMed] [Google Scholar]
- Martin PACM. (2003). The adrenal gland In Mauricio Pineda DM (Eds). McDonald’s veterinary endocrinology and reproduction. Iowa: Iowa State University Press. [Google Scholar]
- McHill AW, Hull JT, Wang W, Czeisler CA, Klerman EB. (2018). Chronic sleep curtailment, even without extended (>16-h) wakefulness, degrades human vigilance performance. Proc Natl Acad Sci U S A. [DOI] [PMC free article] [PubMed] [Google Scholar]
- Pan A, Schernhammer ES, Sun Q, Hu FB. (2011). Rotating night shift work and risk of type 2 diabetes: two prospective cohort studies in women. PLoS medicine. 8:e1001141. [DOI] [PMC free article] [PubMed] [Google Scholar]
- Partch CL, Green CB, Takahashi JS. (2014). Molecular architecture of the mammalian circadian clock. Trends in cell biology. 24:90–99. [DOI] [PMC free article] [PubMed] [Google Scholar]
- Reddy DS. (2010). Neurosteroids: endogenous role in the human brain and therapeutic potentials. Progress in brain research. 186:113–137. [DOI] [PMC free article] [PubMed] [Google Scholar]
- Rubi B, Maechler P. (2010). Minireview: new roles for peripheral dopamine on metabolic control and tumor growth: let’s seek the balance. Endocrinology. 151:5570–5581. [DOI] [PubMed] [Google Scholar]
- Sedlak TW, Saleh M, Higginson DS, Paul BD, Juluri KR, Snyder SH. (2009). Bilirubin and glutathione have complementary antioxidant and cytoprotective roles. Proc Natl Acad Sci U S A. 106:5171–5176. [DOI] [PMC free article] [PubMed] [Google Scholar]
- Straif K, Baan R, Grosse Y, Secretan B, Ghissassi FE, Bouvard V, Altieri A, Benbrahim-Tallaa L, Cogliano V. (2007). Carcinogenicity of shift-work, painting, and fire-fighting. The Lancet Oncology. 8:1065–1066. [DOI] [PubMed] [Google Scholar]
- Suhre K, Shin SY, Petersen AK, Mohney RP, Meredith D, Wagele B, Altmaier E, Deloukas P, Erdmann J, Grundberg E, Hammond CJ, de Angelis MH, Kastenmuller G, Kottgen A, Kronenberg F, Mangino M, Meisinger C, Meitinger T, Mewes HW, Milburn MV, Prehn C, Raffler J, Ried JS, Romisch-Margl W, Samani NJ, Small KS, Wichmann HE, Zhai G, Illig T, Spector TD, Adamski J, Soranzo N, Gieger C. (2011). Human metabolic individuality in biomedical and pharmaceutical research. Nature. 477:54–60. [DOI] [PMC free article] [PubMed] [Google Scholar]
- Vyas MV, Garg AX, Iansavichus AV, Costella J, Donner A, Laugsand LE, Janszky I, Mrkobrada M, Parraga G, Hackam DG. (2012). Shift work and vascular events: systematic review and meta-analysis. BMJ (Clinical research ed). 345:e4800. [DOI] [PMC free article] [PubMed] [Google Scholar]
- Wright KP Jr., Gronfier C, Duffy JF, Czeisler CA (2005). Intrinsic period and light intensity determine the phase relationship between melatonin and sleep in humans. Journal of biological rhythms. 20:168–177. [DOI] [PMC free article] [PubMed] [Google Scholar]
Associated Data
This section collects any data citations, data availability statements, or supplementary materials included in this article.


