

Abstract
BACKGROUND & AIMS:
A 6-food elimination diet induces remission in most children and adults with eosinophilic esophagitis (EoE). The effectiveness of empiric elimination of only 4 foods has not been studied in children. We performed a prospective observational outcome study in children with EoE treated with dietary exclusion of cow’s milk, wheat, egg, and soy. The objective was to assess the clinical, endoscopic, and histologic efficacy of this treatment in EoE.
METHODS:
We recruited children (1–18 years old, diagnosed per consensus guidelines) from 4 medical centers. Study participants (n = 78) were given a proton pump inhibitor twice daily and underwent a baseline esophagogastroduodenoscopy. Subjects were instructed on dietary exclusion of cow’s milk, wheat, egg, and soy. Clinical, endoscopic, and histologic assessments were made after 8 weeks. Responders had single foods reintroduced for 8 weeks, with repeat endoscopy to assess for recurrence of active disease. The primary endpoint was histologic remission (fewer than 15 eosinophils per high-powered field). Secondary endpoints included symptom and endoscopic improvements and identification of foods associated with active histologic disease.
RESULTS:
After 8 weeks on 4-food elimination diet, 50 subjects were in histologic remission (64%). The subjects’ mean baseline clinical symptoms score was 4.5, which decreased to 2.3 after 8 weeks of 4-food elimination diet (P < .001). The mean endoscopic baseline score was 2.1, which decreased to 1.3 (P < .001). After food reintroduction, the most common food triggers that induced histologic inflammation were cow’s milk (85%), egg (35%), wheat (33%), and soy (19%). One food trigger that induced recurrence of esophageal inflammation was identified in 62% of patients and cow’s milk–induced EoE was present in 88% of these patients.
CONCLUSIONS:
In a prospective study of children with EoE, 8 weeks of 4-food elimination diet induced clinical, endoscopic, and histologic remission in more than 60% of children with EoE. Although less restrictive than 6-food elimination diet, 4-food elimination diet was nearly as effective, and can be recommended as a treatment for children with EoE.
Keywords: SFED, Esophagus, Inflammation, Trial
Eosinophilic esophagitis (EoE) is a chronic, immune-mediated inflammatory disease of the esophagus characterized clinically by symptoms of esophageal dysfunction and histologically by eosinophil-predominant inflammation.1,2 Kelly et al3 demonstrated clinical and histologic remission in children with isolated esophageal eosinophilia when treated with an exclusive amino-acid-based formulation. Reintroduction of incriminating foods resulted in recurrence, thereby establishing that EoE is triggered by food antigen. Six-food elimination diet (SFED) excluding cow’s milk, wheat, egg, soy, peanut/tree nut, and fish/shell-fish demonstrated clinical and histologic remission in 74% of children.4 Other retrospective pediatric and prospective and retrospective adult studies showed remission in 58%–81% of children and adults treated with SFED.5–10 Cow’s milk, wheat, egg, and soy were identified as the 4 foods most likely causing inflammation in EoE.5,6,11 A recently published 4 food group elimination diet study in Spanish subjects demonstrated remission in 54% adults.12
We investigated whether excluding fewer foods is effective in inducing clinical, endoscopic, and histologic remission. We also wanted to identify the frequency of specific EoE trigger foods.
Materials and Methods
The institutional review board approved this study at each of the following participating institutions: Lurie Children’s Hospital of Chicago, Chicago, Illinois; Mount Sinai Medical Center, New York, New York; Texas Children’s Hospital, Houston, Texas; and GI Care for Kids, Atlanta, Georgia. Parents or legal guardians provided written informed consent for participation. All investigators followed the same protocol detailing the study’s design, inclusion criteria, endoscopic grading, allergy testing, and treatment endpoints. A manual of operations and 4-food elimination diet (FFED) patient handouts were developed and shared by all the centers. Subjects were recruited from outpatient gastroenterology clinics at the participating institutions. EoE cases, aged 1–18 years, were diagnosed per consensus guidelines,1 which included symptoms of esophageal dysfunction, and the presence of 15 eosinophils per high power field (eos/hpf) in esophageal biopsies. Subjects were treated with twice-daily proton pump inhibitor for 8 weeks followed by baseline diagnostic esophagogastroduodenoscopy (EGD), and only those who demonstrated persistent esophageal eosinophilia were included in the study. Subjects previously treated with topical steroids underwent a baseline EGD off steroids for 3 months and were included on demonstrating esophageal eosinophilia. After diagnostic EGD, all subjects continued proton pump inhibitor once daily for the remainder of the study to treat comorbid gastroesophageal reflux disease and limit proton pump inhibitor as a confounder between patients throughout the study. All EGD were performed under general anesthesia. Other medications for the treatment of asthma and allergic rhinitis including nasal steroids were continued unchanged throughout the study. Patients on systemic or topical steroids or those with eosinophilic gastroenteritis and eosinophilic colitis were excluded from the study, as were patients with celiac disease, and inflammatory bowel disease.
Study Endpoints
The primary study treatment endpoint was histologic remission with eosinophil count <15 eos/hpf. Secondary endpoints included symptomatic and endoscopic improvement and identification of specific food triggers.
Allergy Testing
Food-specific serum-specific IgE (sIgE) ImmunoCAP testing and skin prick testing (SPT) to cow’s milk, wheat, egg, and soy was performed. Positive tests were defined as sIgE >0.35 KU/L and SPT >3 mm maximal wheal diameter.
Study Design
A dietitian instructed both parents and patients on proper food elimination, food label reading, appropriate food substitution, and avoiding cross contact with eliminated foods per protocol as shown in Supplementary Tables 1 and 2. The dietitian’s contact information was provided to address concerns about implementing the elimination diet. The dietitian also reviewed a 3-day pretreatment diet log to assess the pretreatment diet to provide guidance about food substitutions when the 4 foods were excluded. Identification of contamination resulted in removing the contamination and delaying the posttreatment EGD by an additional 4 weeks.
Four foods were eliminated and endoscopic biopsies were performed 8 weeks after the elimination diet to assess histologic response. In responders defined as those who achieved <15 eos/hpf, eliminated foods were reintroduced. Single foods were introduced sequentially in the same order starting with soy, then egg, followed by wheat, and finally milk, with EGD performed at least 8 weeks after every new food reintroduction. Immediate hypersensitivity-inducing food was not introduced, moving instead to the next food in the protocol. If the reintroduced food did not result in the recurrence of eosinophilia (<15 eos/hpf) it was kept in the diet and the next food was reintroduced. A trigger food was identified by the recurrence of inflammation ( 15 eos/ hpf) with food reintroduction. The identified trigger food was again removed from the diet. Eight weeks after eliminating the trigger food repeat normal (<15 eos/hpf) baseline EGD (defined as washout period) was performed. The next food was introduced after the washout EGD, and this study design is illustrated in Figure 1.
Figure 1.

Diagram outlining the order of food reintroduction in responders. Single foods reintroduced every 8 weeks in 4-FED responders starting with soy, egg, wheat, and milk. Inflammation-inducing trigger foods removed followed by a normal baseline EGD demonstrating remission of inflammation before the next food reintroduction. 4-FED, 4-food elimination diet.
Demographics and atopic medical history was collected at the time of recruitment. The presence of IgE-mediated food allergy was determined from history of immediate reaction to specific foods confirmed with food-specific allergy testing (IgE or SPT).
Symptom Data Collection
Parents and subjects completed nonvalidated 17-question symptom instrument at the time of study entry (baseline) and at the time of each subsequent EGD. The 17 symptoms in the instrument are listed in Table 1. Each symptom was scored absent (0) or present (þ1). The total symptom score was determined by adding the individual patient symptom scores.
Table 1.
Baseline Demographic, Clinical, and Histologic Characteristics of All Subjects Who Underwent FFED
| Variable | N (%) |
P value | ||
|---|---|---|---|---|
| Patients completing the FFED n = 78 |
Responders n = 50 (64%) |
Nonresponders n = 28 (36%) |
||
| Age, y, mean SD | 9.01 ± 4.88 | 9.21 ± 4.9 | 8.66 ± 4.92 | .6376 |
| Gender, n (%) | ||||
| Male | 52 (66.67) | 29 (58) | 23 (82.14) | .0300a |
| Female | 26 (33.33) | 21 (42) | 5 (17.86) | |
| White, n (%) | 65 (83.33) | 39 (78) | 26 (92.86) | .1194 |
| Presenting symptoms, n (%) | ||||
| Abdominal pain | 39 (50) | 25 (50) | 14 (50) | .9999 |
| Slow eating | 33 (42.31) | 21 (42) | 12 (42.86) | .9414 |
| Early satiety | 32 (41.03) | 21 (42) | 11 (39.29) | .8152 |
| Dysphagia | 27 (34.62) | 15 (30) | 12 (42.86) | .2522 |
| Vomiting | 24 (30.77) | 15 (30) | 9 (32.14) | .8441 |
| Poor appetite | 25 (32.05) | 16 (32) | 9 (32.14) | .9897 |
| Feeding difficulties | 21 (26.92) | 12 (24) | 9 (32.14) | .4367 |
| Regurgitation | 20 (25.64) | 12 (24) | 8 (28.57) | .6574 |
| Poor weight gain | 18 (23.08) | 12 (24) | 6 (21.43) | .7960 |
| Food impaction | 19 (24.36) | 14 (28) | 5 (17.86) | .3168 |
| Nausea | 18 (23.08) | 9 (18) | 9 (32.14) | .1550 |
| Pocketing food/spitting after chewing | 18 (23.08) | 12 (24) | 6 (21.43) | .7960 |
| Gagging/choking | 18 (23.08) | 13 (26) | 5 (17.86) | .4129 |
| Heartburn | 10 (12.82) | 5 (10) | 5 (17.86) | .4814 |
| Chest pain | 12 (15.38) | 6 (12) | 6 (21.43) | .3319 |
| Odynophagia | 8 (10.26) | 4 (8) | 4 (14.29) | .4478 |
| Nocturnal awakening caused by symptoms | 8 (10.26) | 5 (10) | 3 (10.71) | .9999 |
| Atopy, n (%) | ||||
| Eczema | 32 (41.03) | 20 (40) | 12 (42.86) | .8056 |
| IgE-mediated food allergy (n = 77) | 24 (31.17) | 12 (24.49) | 12 (42.86) | .0942a |
| Asthma | 22 (28.21) | 18 (36) | 4 (14.29) | .0409 |
| Allergic conjunctivitis | 14 (17.95) | 10 (20) | 4 (14.29) | .5281 |
| Allergic rhinitis | 46 (58.97) | 29 (58) | 17 (60.71) | .8152 |
| Family history (n = 77) , n (%) | ||||
| Rhinitis | 55 (71.43) | 32 (65.31) | 23 (82.14) | .1157 |
| Asthma | 40 (51.95) | 22 (44.9) | 18 (64.29) | .1014 |
| GERD | 41 (53.25) | 26 (53.06) | 15 (53.57) | .9656 |
| Food allergy | 34 (44.16) | 15 (30.61) | 19 (67.86) | .0015a |
| Eczema | 31 (40.26) | 18 (36.73) | 13 (46.43) | .4041 |
| Hiatal hernia | 17 (22.08) | 9 (18.37) | 8 (28.57) | .2990 |
| EoE | 11 (14.29) | 6 (12.24) | 5 (17.86) | .5157 |
| Stricture | 9 (11.69) | 6 (12.24) | 3 (10.71) | .9999 |
| Celiac | 4 (5.19) | 4 (8.16) | 0 (0) | .2903 |
| Recurrent vomiting | 4 (5.19) | 1 (2.04) | 3 (10.71) | .1337 |
| Common food allergens on skin prick test, n (%) | ||||
| Egg (n = 54) | 18 (33.33) | 10 (27.03) | 8 (47.06) | .1470 |
| Milk (n = 55) | 13 (23.64) | 9 (24.32) | 4 (22.22) | .9999 |
| Soy (n = 54) | 21 (38.89) | 12 (33.33) | 9 (50) | .2363 |
| Wheat (n = 53) | 11 (20.75) | 8 (22.22) | 3 (17.65) | .9999 |
| Food sensitization on serum-specific IgE test, n (%) | ||||
| Egg (n = 53) | 24 (45.28) | 11 (29.73) | 13 (81.25) | .0005a |
| Milk (n = 56) | 31 (55.36) | 18 (47.37) | 13 (72.22) | .0806a |
| Soy (n = 55) | 21 (38.18) | 10 (26.32) | 11 (64.71) | .0068a |
| Wheat (n = 53) | 24 (45.28) | 13 (34.21) | 11 (73.33) | .0100 |
| Endoscopy visual findings, n (%) | ||||
| Furrows (n = 76) | 56 (73.68) | 34 (70.83) | 22 (78.57) | .4599 |
| Edema (n = 75) | 53 (70.67) | 32 (66.67) | 21 (77.78) | .3104 |
| Exudates (n = 76) | 41 (53.95) | 24 (50) | 17 (60.71) | .3660 |
| Rings (n = 76) | 9 (11.84) | 5 (10.42) | 4 (14.29) | .7178 |
| Strictures (n = 76) | 1 (1.32) | 0 (0) | 1 (3.57) | .3684 |
| Baseline peak eosinophil count, median (IQR) | 60 (40–100) | 52.5 (40–85) | 80 (48–100) | .1211 |
| Posttreatment peak eosinophil count, median (IQR) | 8 (3–40) | 5 (1–8) | 51 (35.5–90) | <.0001a |
NOTE. Chi-square and Fisher exact tests were used to assess differences in response groups for categorical variables. A 2-sample t-test was used to compare age between groups, and the nonparametric Wilcoxon rank sum test was used to compare baseline peak EOS and posttreatment EOS. EoE, eosinophilic esophagitis; FFED, 4-food elimination diet; GERD, gastroesophageal reflux disease; IQR, interquartile range.
P values < .05 were considered statistically significant.
Endoscopic Findings
Endoscopic features including edema, rings, white plaques, linear furrows, and strictures were scored absent (0) or present (þ1). The total (composite) endoscopic score was derived by adding the component scores for individual findings. The total scores ranged from 0 to 5.
Histologic Analysis
Four biopsy samples for histologic assessment were obtained from 2 different levels of the esophagus. Eosinophils were reported as peak eosinophil counts/hpf from the densest areas of the esophagus. Presence of basal cell hyperplasia was also described. Gastric and duodenal biopsies were also obtained. Pathologists reviewed the biopsies at each of the participating institutions, and their assessment was used to define remission or identify trigger foods. The study’s central pathologist (MHC) provided oversight by reviewing random biopsies from participating institutions. There was no interobserver variability, and interobserver consistency was identified between the participating pathologists and the central pathologist. Eosinophil count was assessed at high power magnification 400 hpf (0.23 mm2). The cutoff value of 15 eos/hpf was used to evaluate remission.
Anthropometric Measurements
The z scores for weight, height, and body mass index (BMI) at baseline and each subsequent EGD were determined using the SAS program for CDC 2000 growth charts (SAS Institute, Cary, NC) (2 to <20 years).
Statistical Analysis
Changes in peak eos/hpf before and after FFED were evaluated using a 2-sided paired t-test. Differences in baseline characteristics between treatment responders and nonresponders were assessed using a 2-sample Student t test, the Wilcoxon rank sum test, or the chi-square/Fisher exact tests. Association between demographic and clinical characteristics of interest and treatment response was tested with logistic regression. The area under the curve of the receiver operating characteristic curve was calculated to assess the predictive value for the final model. Pairwise comparisons for each pair of geographic regions explored for significant omnibus test using 2-sample Student t tests, Wilcoxon rank sum tests, chi-square, or Fisher exact tests as appropriate using Bonferroni corrections. Sensitivity, specificity, negative predictive value, and positive predictive value were calculated for each food to evaluate the validity of SPT and serum sIgE allergy test compared with FFED-identified trigger foods. Changes in standardized height, weight, and BMI z scores was assessed between responders and nonresponders using 2-sample Student t tests. All statistical analyses were performed using SAS version 9.4 (SAS Institute). Unless otherwise specified, alpha = 0.05 was used to determine statistical significance.
Results
Patients
Between 2011 and 2016, a total of 96 children consented to participate and of these 18 were excluded: 5 left prior to starting the diet, 8 found the diet too difficult, 1 dropped out for insurance reasons, 1 was lost to follow up and 3 did not meet the inclusion criteria (Figure 2). All 78 subjects (67% male, mean age 9.01, 83% white, 90% atopic) who met inclusion criteria were incident cases, except for 3 who had been previously treated with topical steroids, and are the basis of this study Table 1.
Figure 2.
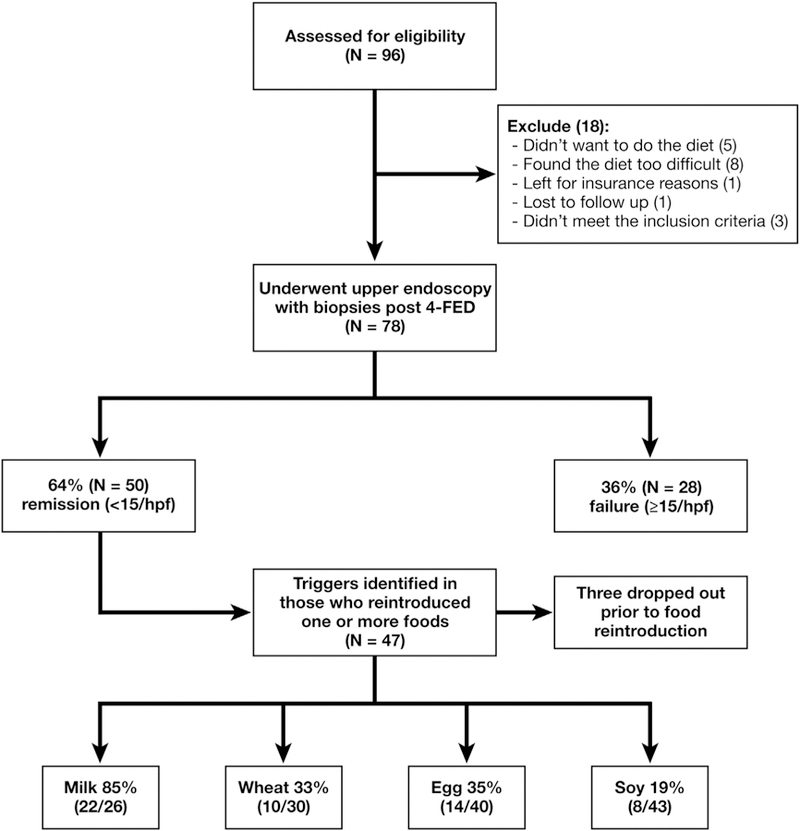
Diagram of patient flow. Ninety-six patients were screened for the study; 18 were excluded and 78 underwent upper endoscopy with biopsies after 4-FED. Fifty demonstrated histologic remission. 4-FED, 4-food elimination diet.
Histologic, Clinical, and Endoscopic Responses
Histologic remission was achieved in 50 of 78 (64%) subjects. The peak eosinophil count in the proximal esophagus decreased from 43 ± 32 and 3 ± 3 per hpf and in the distal esophagus decreased from 55 ± 34 to 4 ± 4 per hpf with FFED treatment. Basal cell hyperplasia resolved in 36% of the responders (P < .001) and persisted in all the nonresponders. Food contamination was not identified in any patients before the scheduled post-4-food elimination EGD.
All symptoms resolved in 36% of respondents and symptom score decreased in 91%. The mean baseline symptom score decreased from 4.5 to 2.3 in responders (P < .001). Table 2 shows specific symptoms that resolved in a significant number of FFED treatment responders: abdominal pain (P < .05), poor appetite (P = .01), vomiting (P = .01), food impaction (P < .05), choking/gagging (P = .01), regurgitation (P = .01), pocket/spit out food (P = .01). Interestingly non-responders had resolution of chest pain (P < .05) and atypical symptoms, such as early satiety (P < .05), and nausea (P = .5).
Table 2.
Histologic, Endoscopic, and Symptomatic Response to FFED in Responders and Nonresponders
| Responders (n = 50) |
Nonresponders (n = 28) |
||||||
|---|---|---|---|---|---|---|---|
| Pre Mean (SD) |
Post Mean (SD) |
P value | Pre Mean (SD) |
Post Mean (SD) |
P value | ||
| Histology | |||||||
| Peak eos/hpf | 62.0 (33.7) | 5.0 (4.1) | < .001a | 74.4 (36.4) | 62.1 (31.6) | .15 | |
| Distal eos/hpf | 55.9 (33.9) | 4.1 (3.9) | < .001a | 58.3 (37.6) | 51.5 (30.1) | .48 | |
| Proximal eos/hpf | 43.9 (32.4) | 2.6 (3.3) | < .001a | 63.7 (36.7) | 44.8 (33.1) | .03a | |
| Visual findings | Count (%) | Count (%) | P value | Count (%) | Count (%) | P value | |
| Furrow | 34 (71) | 17 (35) | < .001a | 22 (79) | 23 (82) | 1.00 | |
| Edema | 32 (67) | 12 (25) | < .001a | 21 (75) | 20 (74) | 1.00 | |
| Exudate | 24 (50) | 1 (2) | < .001a | 17 (61) | 17 (61) | 1.00 | |
| Rings | 5 (10) | 6 (12) | 1.00 | 4 (14) | 4 (14) | 1.00 | |
| Stricture | 0 (0) | 0 (0) | — | 1 (4) | 0 (0) | — | |
| Symptoms | Count (%) | Count (%) | P value | Count (%) | Count (%) | P value | |
| Abdominal pain | 25 (50) | 15 (30) | .03a | 14 (50) | 11 (39) | .58 | |
| Slow eating | 21 (42) | 18 (36) | .55 | 12 (43) | 6 (21) | .08 | |
| Early satiety | 21 (42) | 13 (26) | .06 | 11 (39) | 5 (18) | .04a | |
| Poor appetite | 16 (32) | 5 (10) | .01a | 9 (32) | 5 (18) | .34 | |
| Dysphagia | 15 (30) | 11 (22) | .45 | 12 (43) | 9 (32) | .58 | |
| Vomiting | 15 (30) | 4 (8) | .01a | 9 (32) | 6 (21) | .55 | |
| Food impaction | 14 (28) | 5 (10) | .04a | 5 (18) | 3 (11) | .68 | |
| Gagging/choking | 13 (26) | 3 (6) | .01a | 5 (18) | 4 (14) | 1.00 | |
| Regurgitation | 12 (24) | 2 (4) | .01a | 8 (29) | 2 (7) | .08 | |
| Poor weight gain | 12 (24) | 5 (10) | .07 | 6 (21) | 2 (7) | .13 | |
| Pockets/spits after chewing | 12 (24) | 1 (2) | .01a | 6 (21) | 2 (7) | .13 | |
| Feeding difficulties | 12 (24) | 5 (10) | .12 | 9 (32) | 5 (18) | .29 | |
| Nausea | 9 (18) | 7 (14) | .77 | 9 (32) | 2 (7) | .05a | |
| Chest pain | 6 (12) | 4 (8) | .68 | 6 (21) | 0 (0) | .04a | |
| Heartburn | 5 (10) | 5 (10) | 1.00 | 5 (18) | 3 (11) | .68 | |
| Nocturnal awakening | 5 (10) | 1 (2) | .13 | 3 (11) | 1 (4) | .48 | |
| Odynophagia | 4 (8) | 5 (10) | 1.00 | 4 (14) | 1 (4) | .37 | |
FFED, 4-food elimination diet.
P < .05.
The mean endoscopic baseline score decreased from 2.1 to 1.3 (P < .001) in the responders. The changes in specific endoscopic findings are shown in Table 2. Exudates resolved in 96% respondents (P < .001). Edema resolved in 66% (P < .001) and furrows in 62% (P < .001). Rings persisted in all subjects who had them at baseline.
Mean weight and BMI z scores in responders decreased 0.2 0.43 and 0.31 0.56, respectively, from baseline values. On completion of food reintroduction process weight and BMI z scores showed increase from baseline scores.
Baseline characteristics of patients showed no differences between responders and nonresponders regarding demographics, symptoms, endoscopic findings, and eosinophilic density in biopsies but there were more female responders (P = .003); more responders with asthma (P = .041); higher proportion with family history of allergy in nonresponders (P = .002); and higher proportion of nonresponders with food-specific IgE sensitization to wheat (P = .010), egg (P = .001), and soy (P = .007). At baseline all included subjects consumed all 4 foods except 5 subjects with anaphylactic food allergies who avoided milk (1), egg (3), and/or soy (1). These foods were not reintroduced during the reintroduction phase.
Forty-seven subjects reintroduced between 1 and 4 foods, and the distribution of the trigger foods in these subjects is shown in Figure 3A. Twenty-five of the 47 subjects were challenged with all foods except foods avoided at baseline (2 egg, 1 soy). Distribution of specific food triggers in these 25 subjects is shown in Figure 3B. In this group of 25 the distribution of the number of identified food triggers is shown in Figure 3C. From responders who introduced all foods single food trigger was identified in 16 patients and included 14 (88%) to cow’s milk, and 1 each to soy (6%) and wheat (6%). Two patients reintroduced all 4 foods without reactivity.
Figure 3.
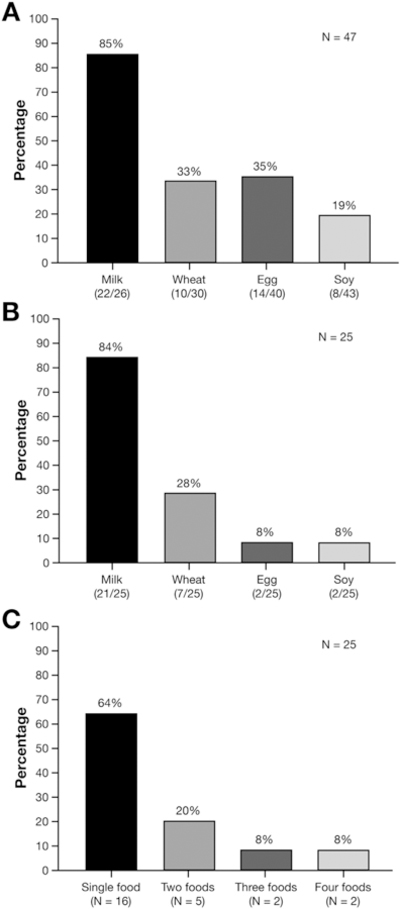
Food triggers identified in subjects reintroducing between 1 and 4 foods in the diet and in those who reintroduced all foods back. (A) Food triggers in patients who reintroduced 1–4 foods. (B) Food triggers in 25 patients who completed reintroduction of all foods. This included 3 subjects with anaphylaxis to egg (2) and soy (1) who did not reintroduce these foods in their diet. (C) Distribution by number of food triggers in 25 who reintroduced all foods.
Because histologic, symptom, and endoscopic scores decreased after treatment the correlation between histology, symptoms, and endoscopic and weight z scores was analyzed at multiple time points that included baseline, after FFED, and after each food reintroduction as shown in Figure 4.
Figure 4.

Comparison of histology with symptom response, endoscopic findings, and weight z scores. (A) Eosinophil counts at 6 different time points: baseline; post-4-FED; and after introduction of soy, wheat, egg, and milk. (B) Symptom scores at 6 different time points: baseline; post-4-FED; and after introduction of soy, wheat, egg, and milk. (C) Endoscopic scores at 6 different time points: baseline; post-4-FED; and after soy, wheat, egg, and milk. (D) Weight z scores at 6 different time points: baseline; post-4-FED; and after soy, wheat, egg, and milk. 4-FED, 4-food elimination diet; EREFS, Edema Rings Exudate Furrowing Stricture.
The utility of specific sIgE and SPT testing to identify EoE food triggers was assessed in treatment responders. Sensitivity, specificity, negative predictive value, and positive predictive value were calculated to cow’s milk, wheat, egg, and soy, and the results suggest that serum sIgE and SPT are not useful in identifying EoE food triggers (Supplementary Table 3). More responders had posttreatment EGD performed during the pollen season than the nonresponders (70% vs 50%; P = .09). Thus, pollen season did not influence the responses.
Family history of food allergy (odds ratio [OR], 0.21; 95% confidence interval [CI], 0.05–0.90) and positive serum sIgE test to any of the 4 foods (OR, 0.15; 95% CI, 0.03–0.90) were significantly associated with treatment nonresponse. Gender (OR, 1.64; 95% CI, 0.31–8.73) and asthma (OR, 4.89; 95% CI, 0.88–27.23) were not statistically associated with treatment response in the multi-variable model. The area under the curve of the final model, which included asthma, family history of food allergy, and positive serum sIgE to any of the 4 foods, was 0.80 (95% CI, 0.67–0.93), shown in Supplementary Figure 1.
Demographic, clinical, allergy testing, endoscopic, and histologic characteristics in the 3 different regions is shown in Supplementary Table 4. A higher proportion of subjects from the East Coast had IgE-mediated food allergy (P = .027), exudates (P = .001), and a strong family history of eczema (P = .014) compared with the Midwest or South.
Discussion
This study demonstrates that exclusion of milk, wheat, egg, and soy for 8 weeks induces clinical, endoscopic, and histologic remission in most children with EoE. This is the largest prospective, multicentered outcome study to date evaluating the efficacy of an empiric elimination diet for the treatment of EoE in children or adults. It is additionally the first prospective elimination diet study conducted in children with EoE.
Cow’s milk was the most common food trigger identified in 85% of patients, followed by egg (in 35% of patients), wheat (in 33% of patients), and soy (in 19% of patients) with the frequency of trigger foods that is identical to the SFED study.11 The number of subjects in whom milk was a food trigger is even higher in our study than previously reported,11 thereby making cow’s milk elimination the most significant component of any elimination diet therapy and providing the basis for milk-only elimination diet approach. Thirty-six percent of responders had more than 1 food trigger, and this finding supports single food reintroduction process to accurately identify food triggers.
Symptom scores decreased in 91% of the histologic responders, with complete symptom resolution in 36% of the histologic remitters. Symptom response, however, is an unreliable marker of mucosal healing, as has been previously documented, and histology remains the only reliable modality to assess treatment response.4,7,8,13 One or more abnormal endoscopic findings persisted in more than 50% of histologic responders, demonstrating as previously reported that endoscopic findings are not a reliable biomarker for histologic disease activity.14
Elimination of multiple foods from the diet increases the risk for malnutrition and nutritional deficiencies.15,16 Nutritional guidance regarding proper food substitution and vitamin and mineral replacement to prevent malnutrition and nutritional deficiencies was provided at the outset. Despite this, responders demonstrated temporary weight loss with subsequent catch up weight gain once reintroduction of foods was completed.
SFED is first-line nonpharmacologic treatment for EoE in children and adults.2 Excluding 6–8 foods simultaneously, the long reintroduction process, and costs associated with lost work/school and of multiple EGD are limitations of this approach. The present study by being less restrictive, requiring less time to complete food reintroduction, and fewer EGD is likely to be accepted by patients and their families.
Female gender was identified as one of the statistically significant predictors of response in our subjects. This observation differs from adults, where a higher likelihood of response was reported in males.7 History of asthma was another positive predictor of response. Family history of food allergies was a predictor of poor response as was the presence of food sensitization to FFED foods based on serum sIgE testing with abnormal serum sIgE levels predicting lower response. This last finding has also been previously reported by Erwin et al,17 and supports the concept that EoE patients with IgE-mediated food allergy represent a unique EoE phenotype, as we have previously reported.18 Food sensitization seems to be a marker for a more broadly food-allergic phenotype that does not respond to FFED.
The large cohort size and the multicenter design with children recruited from 4 large metropolitan areas in 3 different geographic regions of the country is the major strength of this study and reinforce the external validity of our results. Other strengths of this study include single food reintroduction and washout period when the trigger food is identified. This added step removes the likelihood of recurrence of inflammation being ascribed to factors other than true allergy to the trigger food. The identical order of food reintroduction removes bias about the relative incidence of each antigen-triggering inflammation.
Limitations of this study include nonrandomization and the absence of a control group. There is potential selection bias by recruiting nonconsecutive patients and families motivated by elimination diet, although this mirrors clinical practice. A nonvalidated symptom instrument was used because at the time of this study’s inception a validated symptom instrument was not available and this is another potential limitation of the study. Another potential limitation of the study is the applicability of this dietary approach to children in countries with dietary habits that are different and unique from those in United States.
Twenty-four subjects who responded to FFED dropped out before completing the reintroduction process identifying all possible trigger foods. This is emblematic of the difficulties of even temporarily excluding 4 foods and undergoing multiple EGD. It highlights the fact that dietary therapy is not suited for every patient. Careful patient selection, based on detailed and realistic explanation of the constraints of the diet, the number of EGDs required, and the length of time to complete the reintroduction process are essential for the success of this approach.
In summary, this prospective multicenter empiric FFED diet study achieved clinical remission in 9 out of 10 histologic respondents. Histologic remission was achieved in more than 6 out of 10 children, which is nearly identical to remission with SFED but with a diet that is less stringent. Subsequent systematic food reintroduction identified cow’s milk as the most frequently identified trigger followed by wheat, egg, and soy. Thus, 4-food empiric elimination diet has nearly comparable efficacy to SFED but is less restrictive and requires less time to complete the reintroduction. Our results provide evidence that FFED can be offered to children in preference to SFED and as an alternative to topical corticosteroid–refractory patients for the treatment of EoE.
Supplementary Material
Funding
This work was supported by the Buckeye Foundation, American Partnership for Eosinophilic Disorders, and Campaign Urging Research for Eosinophilic Disease.
Abbreviations used in this paper:
- BMI
body mass index
- CI
confidence interval
- EGD
esophagogastroduodenoscopy
- EoE
eosinophilic esophagitis
- eos/hpf
eosinophils per high power field
- FFED
4-food elimination diet
- OR
odds ratio
- SFED
6-food elimination diet
- sIgE
serum-specific IgE
- SPT
skin prick test
Footnotes
Conflicts of interest
The authors disclose no conflicts.
Supplementary Material
Note: To access the supplementary material accompanying this article, visit the online version of Clinical Gastroenterology and Hepatology at www.cghjournal.org, and at http://dx.doi.org/10.1016/j.cgh.2017.05.048.
References
- 1.Furuta GT, Katzka DA. Eosinophilic esophagitis. N Engl J Med 2015;373:1640–1648. [DOI] [PMC free article] [PubMed] [Google Scholar]
- 2.Liacouras CA, Furuta GT, Hirano I, et al. Eosinophilic esophagitis: updated consensus recommendations for children and adults. J Allergy Clin Immunol 2011;128:3–20, quiz 21–22. [DOI] [PubMed] [Google Scholar]
- 3.Kelly KJ, Lazenby AJ, Rowe PC, et al. Eosinophilic esophagitis attributed to gastroesophageal reflux: improvement with an amino acid-based formula. Gastroenterology 1995; 109:1503–1512. [DOI] [PubMed] [Google Scholar]
- 4.Kagalwalla AF, Sentongo TA, Ritz S, et al. Effect of six-food elimination diet on clinical and histologic outcomes in eosinophilic esophagitis. Clin Gastroenterol Hepatol 2006;4:1097–1102. [DOI] [PubMed] [Google Scholar]
- 5.Henderson CJ, Abonia JP, King EC, et al. Comparative dietary therapy effectiveness in remission of pediatric eosinophilic esophagitis. J Allergy Clin Immunol 2012;129:1570–1578. [DOI] [PMC free article] [PubMed] [Google Scholar]
- 6.Spergel JM, Brown-Whitehorn TF, Cianferoni A, et al. Identification of causative foods in children with eosinophilic esophagitis treated with an elimination diet. J Allergy Clin Immunol 2012;130:461–467. [DOI] [PubMed] [Google Scholar]
- 7.Gonsalves N, Yang GY, Doerfler B, et al. Elimination diet effectively treats eosinophilic esophagitis in adults; food reintroduction identifies causative factors. Gastroenterology 2012;142:1451–1459;quiz e14–e15. [DOI] [PubMed] [Google Scholar]
- 8.Lucendo AJ, Arias A, Gonzalez-Cervera J, et al. Empiric 6-food elimination diet induced and maintained prolonged remission in patients with adult eosinophilic esophagitis: a prospective study on the food cause of the disease. J Allergy Clin Immunol 2013; 131:797–804. [DOI] [PubMed] [Google Scholar]
- 9.Wolf WA, Jerath MR, Sperry SL, et al. Dietary elimination therapy is an effective option for adults with eosinophilic esophagitis. Clin Gastroenterol Hepatol 2014;12:1272–1279. [DOI] [PMC free article] [PubMed] [Google Scholar]
- 10.Rodriguez-Sanchez J, Gomez Torrijos E, Lopez Viedma B, et al. Efficacy of IgE-targeted vs empiric six-food elimination diets for adult eosinophilic oesophagitis. Allergy 2014;69:936–942. [DOI] [PubMed] [Google Scholar]
- 11.Kagalwalla AF, Shah A, Li BU, et al. Identification of specific foods responsible for inflammation in children with eosinophilic esophagitis successfully treated with empiric elimination diet. J Pediatr Gastroenterol Nutr 2011;53:145–149. [DOI] [PubMed] [Google Scholar]
- 12.Molina-Infante J, Arias A, Barrio J, et al. Four-food group elimination diet for adult eosinophilic esophagitis: a prospective multicenter study. J Allergy Clin Immunol 2014; 134:1093–1099. [DOI] [PubMed] [Google Scholar]
- 13.Safroneeva E, Straumann A, Coslovsky M, et al. Symptoms have modest accuracy in detecting endoscopic and histologic remission in adults with eosinophilic esophagitis. Gastroenterology 2016;150:581–590. [DOI] [PMC free article] [PubMed] [Google Scholar]
- 14.van Rhijn BD, Verheij J, Smout AJ, et al. The Endoscopic Reference Score shows modest accuracy to predict histologic remission in adult patients with eosinophilic esophagitis. Neurogastroenterol Motil 2016;28:1714–1722. [DOI] [PubMed] [Google Scholar]
- 15.Christie L, Hine RJ, Parker JG, et al. Food allergies in children affect nutrient intake and growth. J Am Diet Assoc 2002; 102:1648–1651. [DOI] [PubMed] [Google Scholar]
- 16.Liu T, Howard RM, Mancini AJ, et al. Kwashiorkor in the United States: fad diets, perceived and true milk allergy, and nutritional ignorance. Arch Dermatol 2001;137:630–636. [PubMed] [Google Scholar]
- 17.Erwin EA, Kruszewski PG, Russo JM, et al. IgE antibodies and response to cow’s milk elimination diet in pediatric eosinophilic esophagitis. J Allergy Clin Immunol 2016;138:625–628. [DOI] [PMC free article] [PubMed] [Google Scholar]
- 18.Pelz BJ, Wechsler JB, Amsden K, et al. IgE-associated food allergy alters the presentation of paediatric eosinophilic esophagitis. Clin Exp Allergy 2016;46:1431–1440. [DOI] [PMC free article] [PubMed] [Google Scholar]
Associated Data
This section collects any data citations, data availability statements, or supplementary materials included in this article.