

Abstract
Background:
Eosinophilic esophagitis (EoE) is characterized by histopathologic modifications of esophageal tissue including eosinophil-rich inflammation, basal zone hyperplasia (BZH) and dilated intercellular spaces (DIS). The underlying molecular processes that drive the histopathologic features of EoE remain largely unexplored.
Objective:
To investigate the involvement of SLC9A3 in esophageal epithelial [pH]i and DIS formation and the histopathological features of EoE.
Methods:
We examined expression of esophageal epithelial gene networks associated with regulation of intracellular pH ([pH]i) in the EoE transcriptome of primary esophageal epithelial cells and an in vitro esophageal epithelial 3D model system (EPC2-ALI). Molecular and cellular analyses and ion transport assays were employed to evaluate expression and function of SLC9A3.
Results:
We identified altered expression of gene networks associated with regulation of intracellular pH ([pH]i) and acid protective mechanisms in esophageal biopsies from pediatric patients with EoE (normal n = 6, EoE n = 10). The most dysregulated gene central to regulating [pH]i was SLC9A3. SLC9A3 expression was increased within the basal layer of esophageal biopsies from patients with EoE and that expression positively correlated with disease severity (eosinophils/HPF) and DIS (normal n = 10, EoE n = 10). Analyses of esophageal epithelial cells revealed IL-13–induced, STAT6-dependent SLC9A3 expression and Na+-dependent proton secretion and that SLC9A3 activity positively correlated with DIS formation. Finally, we showed that IL-13–mediated Na+-dependent proton secretion was the primary intracellular acid protective mechanism within the esophageal epithelium and that blockade of SLC9A3 transport abrogated IL-13–induced DIS formation.
Conclusions:
SLC9A3 plays a functional role in DIS formation and pharmacologic interventions targeting SLC9A3 function may suppress the histopathologic manifestations in EoE.
Keywords: SLC9A3/NHE3, ion transport, Eosinophilic Esophagitis, Dilated intercellular spaces (DIS), IL-13
Graphical Abstract
Short Summary
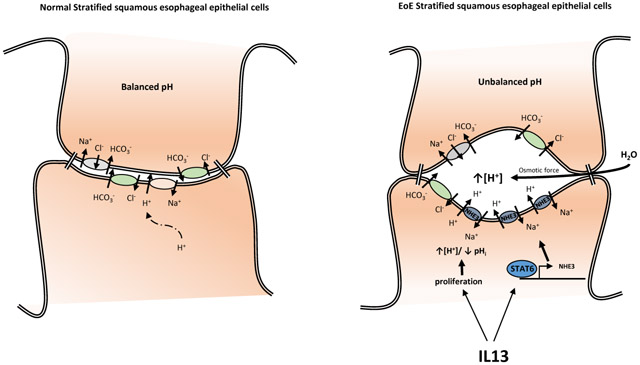
IL13-induced SLC9A3/NHE3 upregulation in Eosinophilic Esophagitis leads to increased intracellular pH, and contributes to the dilated intercellular spaces (DIS) formation.
Introduction
Eosinophilic esophagitis (EoE) is a food allergen–induced inflammatory disease that is increasing in incidence (5 – 10 cases per 100,000) and prevalence (0.5 to 1 case per 1000)1-4. Common symptoms of EoE include vomiting, dysphagia, chest pain, food impaction and upper abdominal pain5 and decrease the health-related quality of life6.
Corroborative clinical and experimental studies indicate that an underlying allergic sensitization to dietary food antigens and development of a CD4+ Th2 and ILC2 inflammatory response in the esophageal mucosa drive the eosinophilic inflammation and esophageal remodeling in EoE, which includes basal zone hyperplasia (BZH) and dilated intercellular spaces (DIS)7-10. Dietary modification (i.e., complete or targeted food antigen avoidance) and swallowed glucocorticoids alleviate much of the disease pathology11, 12, suggesting a food-induced CD4+ Type-2 allergic inflammatory response13-18. Consistent with this, animal-based studies have revealed important roles for CD4+ Th2 cells, pro-allergic cytokines [interleukin 5 (IL-5), IL-13] and eosinophils in the histopathologic manifestations of disease19-21. One cytokine that seems to be central in orchestrating the EoE phenotype is IL-1322-24. IL-13 is highly upregulated in the esophageal tissue of patients with EoE and is sufficient to alter gene expression in esophageal epithelial cells in vitro and in vivo, and the IL-13–induced transcriptome significantly overlaps with the transcriptional changes observed in esophageal biopsies of patients with EoE22-24. Importantly, treating patients with EoE with a humanized antibody against IL-13 led to a significant decrease in esophageal eosinophil count and had a normalizing effect on the dysregulated transcriptome observed in patients with EoE25. IL-13 has been shown to dysregulate the expression of several key epithelial barrier regulatory genes including desmosomal cadherin, desmoglein-1 (DSG-1), leucine-rich repeat–containing protein 31 (LRRC31), kallikrein (KLK) serine proteases and calpain 14 (CAPN14), which have been linked with EoE26-28.
Though there have been significant advances in our understanding of a link between allergic inflammation and EoE, there is a paucity of data revealing the underlying pathways that regulate epithelial BZH and DIS in EoE. DIS, also described as spongiosis, is a morphologic feature that has been identified in multiple forms of esophagitis including lymphocytic esophagitis29, gastroesophageal reflux disease (GERD)30 and EoE8, 31. Histologic comparison between GERD and EoE suggested that DIS is significantly more intense in EoE than GERD32. Steroid therapy or elimination diet significantly decreases DIS in patients with EoE, and this decrease is associated with improvement of patients’ symptoms31, indicating an association between DIS and the etiology of EoE. The underlying molecular pathways that drive DIS formation are currently unknown.
We recently performed RNA sequencing (RNAseq) on esophageal mucosal biopsies from normal healthy control patients (NL) and patients with active, proton pump inhibitor (PPI)–confirmed EoE. We identified a total of 1607 significantly dysregulated transcripts (1096 upregulated, 511 downregulated), with 66% of the gene signature being similar to the EoE transcript signature identified by microarray-based expression profiling24. We have performed gene ontology enrichment network analysis of the 1607 significantly dysregulated transcripts and identified dysregulation of transmembrane transporter activity genes associated with regulation of [pH]i and acid protective mechanisms. The most dysregulated transmembrane transporter activity gene in the EoE transcriptome was the solute carrier family 9, subfamily A, member 3 (SLC9A3), which encodes sodium-hydrogen exchanger member 3 (NHE3)33 (33-fold increase). We demonstrate a significant increase of SLC9A3 in the esophageal epithelium in two independent, confirmatory patient cohorts with PPI-confirmed EoE. We show that the expression level of NHE3 positively correlated with the level of inflammation and the area of DIS. IL-13 treatment of esophageal epithelial primary cells derived from patients with EoE and in a differentiated squamous esophageal epithelium model (EPC2-ALI) increased NHE3 expression and ion transport activity. Pharmacologic inhibition of NHE3 function substantially decreased the area of IL-13–induced DIS. These collective data suggest that increased expression and activity of NHE3 contribute to the formation of DIS in the esophageal epithelium in EoE.
Material and Methods
Human subjects.
NL (healthy control patients) were defined as having no history of EoE diagnosis, 0 esophageal eosinophils per high-power field (HPF) and no evidence of esophagitis within distal esophageal biopsies obtained during the same endoscopy procedure as the analyzed samples. EoE was defined as described in the recent consensus guidelines. Specifically, patients needed to have ≥15 eosinophils in at least 1 high-power field (eos/hpf) in a distal esophageal biopsy with other causes of esophageal eosinophilia excluded, and without a response to acid suppression. Normal control patient cohort consists of patients with a variety of non-specific upper GI complaints including vomiting, loose stools, abdominal pain, nausea who underwent endoscopy were biopsied and demonstrated to have no histological evidence of esophageal disease. RNAseq and validation qRT-PCR analyses and histology (Eos/hpf and DIS quantification) studies were performed on the esophageal biopsies. RNAseq and qRT-PCR analyses and histology (Eos/hpf and DIS) were performed on human esophageal biopsy samples (normal, n = 6; EoE, n = 10) as previously described (NCBI Gene Expression Omnibus (GEO) database under accession GSE58640)24 (Cohort 1). The demographics of the normal control and EoE patients are described in Supplemental Figure S1. The qRT-PCR and histopathology (Eos/hpf) analyses was performed on a second independent cohort (normal, n = 10; EoE, n = 10) (Cohort 2). The demographics of the patients and controls are described in Supplemental Figure S1.
RNA-sequencing of human Biopsy Samples:
Esophageal biopsy RNA was isolated from controls and EoE patients with active disease using the RNeasy kit (QIAGEN Incorporated, Germantown, MD) per the manufacturer's protocol. RNA libraries were prepared using standard Illumina protocols (TrueSeq RNA LS Sample Prep V2) at the CCHMC Genetic Variation and Gene Discovery Core. RNA sequencing acquiring 100bp reads from paired end libraries was performed at the Genetic Variation and Gene Discovery Core Facility at CCHMC using Illumina HiSeq 2500. The paired-end sequencing reads were aligned against the GRCh37 genome model using TopHat 2.04 with Bowtie 2.0334, 35. The separate alignments were then merged using Cuffmerge36 with UCSC gene models as a reference. Raw data were assessed for statistical significance using a Welch t-test with Benjamini-Hochberg false discovery rate and a threshold of P < 0.05 and a 2.0-fold cut-off filter in GeneSpring® GX (Agilent Technologies Incorporated, Clara, CA).
RNA-sequencing of mature EPC2-ALI:
RNA was isolated using the RNeasy kit (QIAgen Incorporated, Germantown, MD, USA) per manufacturer instructions. Assessment of RNA quality was performed using the Agilent 2100 Expert bioanalyzer (Agilent Technologies Incorporated, Clara, CA, USA) and only those samples getting a RNA Integrity Number (RIN) above 8 were chosen for sequencing. Next generation sequencing analyses were performed by the CCHMC Genetic Variation and Gene Discovery Core with Illumina HiSeq 2500. Raw data was uploaded on Biowardrobe37 and RPKM values were calculated. Differentially expressed genes were assessed using DEseq2.
Gene Ontology Analysis:
Gene list enrichment analysis and candidate gene prioritization based on molecular function using ToppGene38 with FDR B&H correction and p-Value cutoff at 0.05. Heatmaps were generated using RStudio.
Pathology analysis.
Biopsy preparation.
Formalin-fixed, paraffin-embedded esophageal biopsies were sectioned into 5-μm slides. After removal of paraffin and serial hydration, sections were stained with hematoxylin and eosin (H&E). H&E-stained slides were then imaged using an Olympus DP-72 microscope (Olympus Corporation, Semrock, New York, NY, USA).
Quantification of intercellular space.
Intercellular space was quantified as the percentage of intercellular area of the total area of the biopsy sample using Image-Pro Plus software (Media Cybernetics, Rockville, MD, USA) automated space measurement function and calculated by the ratio of intercellular area / total tissue area.
qPCR analysis.
RNA samples were extracted from esophageal biopsy, cultured primary cells or EPC2-ALI cultures using the RNeasy kit (QIAGEN Sciences Incorporated, Germantown, MD, USA) according to the manufacturer’s protocol. Purified RNA (300 – 500 ng) was DNAse treated and reverse transcribed to cDNA using Superscript II RNase H Reverse Transcriptase (Thermo Fisher Scientific Incorporated, Rockford, IL, USA) per the manufacturer’s instructions. cDNA for SLC9A3 and 18S were quantified by real-time PCR using Taqman Universal supermix with the CFX96 Real-Time PCR Detection System. qPCR analysis was performed using the Bio-Rad CFX Manager Software version 3.1. Primers for SLC9A3 and 18S were purchased from Taqman (Thermo Fisher Scientific, Waltham, MA).
Immunofluorescence (IF) staining.
For IF staining, formalin- or paraformaldehyde-fixed, paraffin-embedded esophageal biopsies or EPC2-ALI cultures were sectioned, mounted on slides and de-paraffinized using standard histological procedures. Slides were then permeabilized in Tris-EDTA (1 mM, pH 9.0) with 0.1% Tween-20, and antigen exposure was performed at 125°C for 30 s in a decloaking chamber using a pressure cooker. Slides were then blocked by 10% normal donkey serum for 1 h followed by overnight incubation of primary antibodies diluted in 10% normal donkey serum: NHE3 (Novus, Littleton, CO) and CK13 (Invitrogen, Carlsbad, CA). Slides were then washed and incubated with secondary antibody at room temperature for 1 h. Slides were mounted with Fluoromount-G (SouthernBiotech, Birmingham, AL) mounting solution. Fluorescent imaging was performed using the Zeiss Apotome fluorescent microscope using NIKON elements software.
Primary cell preparation.
Distal esophageal biopsy was obtained from NL or EoE patients who underwent routine endoscopy, suspended in 1 mL keratinocyte serum-free media (KSFM) (Invitrogen, Carlsbad, CA) containing supplements [human epidermal growth factor (EGF) (1 ng/mL), bovine pituitary extract (50 μg/mL), and 1X penicillin/streptomycin (Invitrogen, Carlsbad, CA)] and subsequently placed in 60-mm dish in 3 mL of filter-sterilized (0.2 μm) Leibovitz’s L-15 media (Invitrogen, Carlsbad, CA) CA) containing 115 U/mL collagenase, 1.2 U/mL dispase and 1.25 mg/mL BSA. The biopsy was mechanically dispersed using scissors to pieces less than 1 mm in size and then incubated at 37°C for 1 h. The cell suspension was centrifuged at 500 g for 5 min at 4°C and the pellet washed twice with 5 mL of supplemented KSFM media. Cells were suspended in 1 mL of 0.05% trypsin/EDTA for 10 min at 37°C and agitated every 2 min. Trypsin activity was inhibited with soybean trypsin inhibitor (STI) (250 mg/L in 1X DPBS; 5 mLs). Cells were pelleted by centrifugation, suspended in 1 mL KSFM containing supplements, transferred to a 35-mm dish containing irradiated NIH 3T3 J2 fibroblasts (162,500 cells) and cultured at 37°C and 5% CO2. Media were changed at day 5 and every other day thereafter using KSFM containing supplements. After epithelial cells became 60-70% confluent, they were dispersed from the plate using 0.05% trypsin/EDTA for 10 min at 37°C and agitated every 2 min. Trypsin digestion was inactivated by STI, and cells were then passaged in KSFM containing supplements at 12 × 105 cells per 3 mL in a 60-mm dish.
pHi assay.
Primary esophageal epithelial cells were cultured on Ibidi μ-Slide 4 well (ibidi GmbH, Germany) with a concentration of 25,000 cells/well. After 24 h of equilibration period, cells were stimulated with or without 100 ng/mL recombinant human IL-13 (PeproTech, Rocky Hill, NJ) for another 48 h. pHi changes in these primary cells were measured with the pH-sensitive fluorescent dye BCECF AM (2',7'-bis-(2-carboxyethyl)-5-(and-6)-carboxyfluorescein, acetoxymethyl ester) or SNARF-5F AM (SNARF-5F 5- (and-6)-carboxylic acid, acetoxymethyl ester) (Invitrogen, Carlsbad, CA). Cells were loaded with 10 μM BCECF AM or SNARF-5F AM in HCO3−-free Ringer’s solution [mM, 110 NaCl, 25 Na-Gluconate, 5 KCl, 0.5 MgSO4.7H2O, 1 CaCl2.2H2O, 10 HEPES, 4 Glucose; to pH 7.4] at 37Ό for 30 min prior to the experiment. To remove the extracellular dye, cells were washed two times with HCO3−-free Ringer’s solution at the end of the incubation period. To acidify the intracellular compartment of cells and generate the neccassary H+ gradient (high [H+] inside vs low [H+] outside cell) to measure pHi recovery rate, 20 mM of NH4Cl was added to the chamber after the first 5-min recording of the baseline pHi (Figure 2C. Stage II). To measure the Na+-dependent pHi recovery rate, Na+ was first removed from the cells by replacing the buffer with Na+- free Ringer’s solution [mM, 135 NMDG-Cl, 5 KCl, 0.5 MgSO4.7H2O, 1 CaCl2.2H2O, 10 HEPES, 4 Glucose; to pH 7.4] for 5 min (Figure 2C. Stage III). Na+-dependent pHi recovery rate was measured by replacing extracellular solution to HCO3−-free Ringer’s solution containing 135 mM Na+ (Figure 2C. Stage IV) and determination of the slope of the Na+-dependent pHi change. The pHi values are derived from the calibration curves described below. The statistical significance of Na+-dependent pHi change was determined using a Students t-test (two-tailed). To record the BCECF AM fluorescence change, cells were imaged by a Nikon Spectra X inverted fluorescent microscope with the excitation wavelength of 512 nm / 440 nm and emission at 535 nm. To record the SNARF-5F AM fluorescence change, cells were imaged by Zeiss LSM710 LIVE DUO confocal microscope with excitation wavelength at 488 nm and the emission wavelength of 640 nm / 580 nm. To inhibit NHE3 activity, 30 μM of S3226 or 0.01% DMSO (vehicle) was applied throughout the experiment. % S3226-sensitive Na+-dependent pHi recovery rate was calculated as Recovery rate of (DMSO-treated - S3226-treated)*100/DMSO-treated %. Quantification was performed on 10-20 cells randomly picked in each sample, and the fluorescence intensity was measured using Nikon Elements microscope imaging software or ImageJ software. These fluorescence intensity values were then converted into pH values per calibration curves. A calibration curve was generated at the end of each experiment; BCECF AM or SNARF-5F AM intensity was calibrated against pHi when cells were exposed to the K+/H+ ionophore nigericin (10 μM) and valinomycin (10 μM) (Invitrogen, Carlsbad, CA) in high-K+ solution at four different pH values. High-K+ solution [mM, 20 NaCl, 130 KCl, 1 MgCl2, 1 CaCl2.2H2O, 5 HEPES] was prepared and titrated to a pH ranging from 6.5 to 7.9. Fitting was performed with GraphPad Prism software.
Figure 2. Increased SLC9A3/NHE3 expression and activity in primary esophageal epithelial cells derived from EoE biopsy in response to IL-13.

A) qPCR analysis of SLC9A3, B) Baseline intercellular pH (pHi), C) Representative curves of pHi change over time and D) Na+-dependent pHi recovery rate of cells derived from biopsies of patients with active EoE (n = 6) treated with vehicle (Veh) or IL-13. E) Spearman correlation analysis comparing the SLC9A3 expression level and Na+-dependent pHi recovery rate (n = 5 individual patients stimulated with vehicle and IL-13). F) Percentage of S3226-sensitive Na+-dependent intracellular recovery rate in cells treated with vehicle or IL-13. See Material and Methods for detailed protocol. B) Data represent the average pHi ± S.E.M of cells from patients with active EoE (n = 8). C) Each data point represents the average value of 40 individual cells from 2 individual experiments. Data points for D) represent the average value of 120 individual cells from 6 different patients with active EoE and F) 50 individual cells from 5 different patients with active EoE. (A-B, D, F) Data are represented as the average ± S.E.M. *p < 0.05, **p < 0.01, ****p < 0.0001.
EPC2-ALI culture.
The hTERT-EPC2 cells (hTERT-immortalized human esophageal keratinocytes) were a kind gift from Dr. Anil Rustgi (University of Pennsylvania, Philadelphia, PA, USA) as previously described39. The air-liquid interface (ALI) culture system was previously described and characterized together with EPC2 cells28. EPC2 cells were grown to fully submerge on 0.4-μM pore size, permeable transwell inserts (Corning Incorporated, Corning, NY)) in KSFM (Life Technologies, Carlsbad, CA, USA). As depicted in Figure 3A, (i) Day 0, cells were seeded on a permeable membrane support and grown to single submerged layer after three days. (ii) Cells were then shifted to medium containing high [Ca2+] to induce tight junction formation ([Ca2+] = 1.8mM). (iii) On Day 7, media were removed from top chamber in order to induce differentiation and epithelial stratification in ALI. (iv) Day 12 (5 days post ALI), cells were then treated with vehicle or cytokine (IL-13) in the presence and absence of SLC9A3 inhibitor (30μM)40 as described in figure legends.
Figure 3. Mature stratified squamous esophageal epithelium model using EPC-ALI culture system.

A) Schematic diagram of the esophageal epithelium (EPC2) air-liquid interface (ALI) (EPC2-ALI) differentiation protocol (See Material and Methods). B) Gene expression change of IL-13–stimulated EPC2-ALI versus non-treated EPC2-ALI compared to that of patients with active EoE versus normal control (NL) patients. Fold changes were calculated from RNA sequencing of EPC2-ALI and patient samples. Spearman correlation analysis was applied to analyze these 23660 genes. C) Gene ontology analysis of 572 genes that were significantly dysregulated by IL-13 treatment of EPC2-ALI cells (Fold change > 2, p < 0.05) identified 6 GO nodes related to transmembrane transporter activity. D) Heatmap depicting expression level of 46 individual genes within the transmembrane transporter activity GO nodes that are significantly dysregulated in EPC2-ALI cells following IL-13 stimulation. E) RPKM value indicating SLC9A3 expression level in empty control (CTRL), STAT3 lentiviral knockdown (STAT3KD) and STAT6 lentiviral knockdown (STAT6KD) EPC2-ALI cultures treated with vehicle (Veh) or IL-13; n = 3 per treatment. **padj < 0.01, ***padj < 0.001.
Lentiviral Transduction.
EPC2 cells at 60-70% confluence were transduced with lentiviral particles containing Mission® STAT6 shRNA TRC 0000019409 shRNA, Mission® STAT3 (TRCN0000329887) shRNA (Sigma; St. Louis, MO, USA) or Mission® non-target control shRNA (Sigma; St. Louis, MO, USA). All the three shRNA lentivirus were generated by the Cincinnati Children’s Hospital Medical Center Viral Core using a 4-plasmid packaging system. Lentiviral particles were incubated with EPC2 cells for 6 hours with a Multiplicity of Infection (MOI) from 0.5 to 10 for STAT3 or CTRL shRNA. For STAT6 shRNA, 10μL to 50μL viral particles were added to the cells. All the viral particles were added in the presence of 5μg/mL Hexadimethrine Bromide (Polybrene®) (Sigma; St. Louis, MO, USA). During the first hour of incubation cells were spun down at 1000*g for 1 hour at room temperature. 6 hours following transduction cells were put in fresh KSFM media, and 24 hours later media containing 1μg/mL of Puromycin (Thermo Fisher Scientific Incorporated; Rockford, IL, USA) was used for selection. Cells were grown under selective pressure and cultured as regular EPC2 cells. Stable knockdown of STAT6 and STAT3 in EPC2-ALI cultures were evaluated by Western blot. The results indicated an 80% reduction of STAT6 and 90% reduction of STAT3, relatively, compared to empty control transduced cells.
Western blot.
EPC2-ALI cultures were lysed using protein lysis buffer (10% Glycerol, 20 mM Tris HCl pH 7, 137 mM NaCl, 2 mM EDTA, 1% NP40 in H2O) supplemented with Halt protease inhibitor cocktail (Thermo Fisher Scientific Incorporated, Rockford, IL, USA). Proteins were then quantified with BCA assay, and 20 μg of protein extracted together with protein-reducing buffer was loaded and separated on a 4%-12% Bis-Tris gel and transferred to a nitrocellulose membrane (Life Technologies, Carlsbad, CA). Antibody of NHE3 and α-actin were used for protein detection. The IRDye 800 CW goat anti-rabbit IgG (H+L) (Li-Cor, Licoln, NE) was used as the secondary antibody for detection. Western Blot quantification was performed using Image Studio Lite (Li-Cor, Lincoln, NE).
pH-STAT assay.
Acid secretion by confluent epithelium was quantitated using pH-STAT (TIM856, Radiometer Analytical, Loveland, CO) connected to an Ussing chamber system as previously described41. EPC2-ALI cultures were mounted into an Ussing chamber containing unbuffered Ringer’s solution [mM, 145 NaCl, 2 KCl, 1 MgCl2, 2 CaCl2, 5 Glucose] while gassed with 99.5% oxygen. Both the pH electrode and the titrating burette are placed in the apical side chamber. To measure the equilibrium extracellular pH, without any titration, the extracellular pH was measured for 10 min or until a stable pH was achieved (<0.002 pH unit change/min). After the equilibrium period and extracellular pH measurements were obtained, the mucosal pH was adjusted by titration to a set pH (pH 7.6) to keep the extracellular pH slightly alkalized. Titration rate (amount of alkaline injected by the machine to neutralize the acid secreted by EPC2-ALI culture to maintain the set pH) was used to measure the acid secretion rate.
Histologic analysis for EPC2-ALI.
EPC2-ALI cultures were treated as indicated in experiments and then fixed on transwell supports with 4% paraformaldehyde for 1 h at room temperature. Fixed membranes underwent a series of dehydration steps, cleared in Histoclear solution, embedded in paraffin and sectioned into 5-μm slides. The slides were stained using H&E staining and imaged using an Olympus DP-72 microscope (Olympus Corportaion, Semrock, New York, NY, USA).
Electron microscopy.
EPC2-ALI cultures were treated as indicated in experiments, fixed with 3% glutaraldehyde and submitted to CCHMC Pathology Research Core for processing, sectioning and transmission electron microscopy using a Hitachi model H-7650 electron microscope, at 80 kV, using the AMT-600 image capture engine software.
Statistical analysis.
The statistical significance of EPC2-ALI samples was established using an unpaired t-test (two-tailed), or two-way ANOVA if there were more than one variable. For non-normally distributed data from patient biopsies and primary cells derived from patient biopsies, the Mann-Whitney test was used, and the correlation analyses were assessed with a Spearman correlation test. Graphs and statistical analyses were performed using GraphPad Prism 7.02 (GraphPad Software Incorporated, La Jolla, CA, USA).
Results
Transmembrane transporter SLC9A3/NHE3 specifically upregulated and correlated with eosinophil count and DIS in EoE
To begin to determine the potential involvement of transmembrane transporter activity in the histopathologic alterations of the esophageal epithelium in EoE, we applied gene ontology (GO) enrichment analysis of the 1607 differentially expressed RNA transcripts identified by RNAseq analyses of pediatric NL and EoE biopsy samples24. GO analysis revealed 50 individual GO nodes significantly dysregulated in the EoE transcriptome based on functional annotations and protein interaction networks (FDR-corrected p < 0.05, Supplemental Figure S2). Of these GO nodes, 5 were related to transmembrane transporter activity (Fig. 1A). A combinatory comparison of all 62 genes within these 5 GO nodes revealed that the most upregulated transmembrane transporter activity gene was SLC9A3, which encodes for the sodium-hydrogen exchanger family member 3 (NHE3) (Fig. 1B). SLC9A3 was induced 33-fold in patients with EoE compared to NL (Fig. 1C). In contrast, expression of other members of the SLC9 family, including the ubiquitously expressed sodium-proton exchanger SLC9A1, also referred to as sodium-hydrogen exchanger family member 1 (NHE1), were not dramatically different in expression between EoE and NL (Fig. 1D). Correlation analyses revealed a positive correlation between the level of peak distal esophageal eosinophils and SLC9A3 expression (Fig. 1E, r = 0.7167, p < 0.05. Notably, this was specific to SLC9A3, as we did not observe any correlation with SLC9A1 (Fig. 1E, r = 0.3201, p > 0.05), revealing a specific link between SLC9A3 expression and disease severity in EoE. To confirm these observations, we examined a second independent pediatric cohort [NL n = 10, active EoE n = 10] for which we had paired RNA and histologic biopsy samples from the same day of endoscopy. Consistent with our RNAseq analyses, qPCR analyses revealed significant SLC9A3 overexpression in the pediatric EoE cohort (Fig. 1F). Furthermore, we observed a positive Pearson correlation between SLC9A3 expression level and distal peak esophageal eosinophil numbers (Fig. 1G, r = 0.9172, p < 0.0001).
Figure 1. SLC9A3 is the most upregulated transmembrane transporter activity gene in the EoE transcriptome, and levels correlate with EoE severity and DIS.

A) GO nodes associated with transmembrane transporter activity–related genes identified by Gene ontology (GO) enrichment analysis of 1610 dysregulated genes from RNA sequencing. B) Heatmap depicting the expression level of 62 individual genes within the transmembrane transporter activity GO nodes. C) Individual FPKM values of SLC9A3 and D) Heatmap depicting expression level of SLC9A1-9, E) Correlation analysis of SLC9A3 or SLC9A1 expression and matched peak distal eosinophil counts/HPF in esophageal biopsies (NL = 6; EoE = 10). F) qPCR analysis of SLC9A3 expression and G) Spearman correlation relating SLC9A3 expression and eosinophil count/HPF in an independent validation cohort (NL = 10; EoE = 10). H) Immunofluorescence staining of esophageal biopsy sections from NL (top panel) and patients with EoE (lower panel). NHE3 (red), CK13 (green) and nuclei (DAPI, blue) are shown. Images are representative of 7 patients per group. Magnification x40. I) Spearman correlation between SLC9A3 or SLC9A1 expression and percentage of dilated intercellular spaces (DIS) in esophageal biopsies from patients with active EoE (n = 8). (C, F) Data are represented as the average ± S.E.M. (E, G, I) Data are presented as relative expression over 18S. (C, E-G, I) Individual symbols represent an individual patient **p < 0.01, ***p < 0.001.
We next performed immunofluorescence (IF) analyses to determine the cellular and spatial expression of NHE3 in NL and EoE esophageal biopsy samples. Consistent with our RNAseq and PCR analyses, we observed very little expression of NHE3 in healthy esophageal epithelium (Fig. 1H, upper panel). The positive staining observed was restricted to the CK13− single-cell basal esophageal epithelial layer (Fig. 1H, upper panel). In EoE, NHE3 protein expression was remarkably increased, localized to the esophageal basal cell layer and also expanded into the CK13+ suprabasal layer (Fig. 1H, lower panel). The localization of NHE3 to the suprabasal zone, an area associated with DIS formation, lead us to examine the relationship between SLC9A3 expression and DIS in EoE esophageal biopsies. Notably, SLC9A3, but not SLC9A1, expression positively correlated with the percentage of DIS area in EoE individuals (r = 0.8095, p < 0.05) (Fig. 1I). These cumulative data indicate a specific upregulation of SLC9A3/NHE3 in the suprabasal layer of esophageal epithelium in patients with EoE and that SLC9A3 levels correlate with esophageal eosinophilic inflammation and DIS.
Increased NHE3 function in IL-13–stimuiated primary esophageal epithelial ceils.
The epithelial sodium-proton exchanger, NHE3, is predominantly expressed in the apical membrane of epithelia and is the principal mechanism for electroneutral exchange of (Apical → Baso) Na+ and (Baso → Apical) H+ and plays an important role in the maintenance of intracellular pH (pHi) and regulation of cell volume42. Given IL-13’s known role in upregulating the EoE transcriptome18 and that humanized anti–I L-13 monoclonal antibody (QAX576) has been shown to modulate expression of an anion transport activity node25, we examined the impact of IL-13 exposure on SLC9A3 expression in primary esophageal epithelial cells. We demonstrate upregulation of SLC9A3 expression in primary esophageal epithelial cells following IL-13 stimulation (Fig. 2A). To determine whether increased SLC9A3 expression was associated with altered NHE3 activity, we examined the effect of IL-13 exposure on intracellular pH ([pH]i) in primary esophageal epithelial cells. Notably, increased SLC9A3 expression coincided with a significant increase in baseline pHi (Fig. 2B) and Na+-dependent pHi recovery rate (Fig. 2C-D), supporting an overall increase of Na+/H+ exchange activity. Notably, the recovery rate positively correlated with SLC9A3 expression in primary esophageal epithelial cells (r = 0.9503 p < 0.01; Fig. 2E), suggesting that the increase of pHi recovery rate in IL-13–treated primary esophageal epithelial cells is predominantly due to increased NHE3 expression. Addition of the NHE3-specific inhibitor S3226 (30 μM) confirmed that the IL-13–induced increase in Na+-dependent pHi recovery rate was predominantly mediated by NHE3 (Fig. 2F).
IL-13 induces an EoE-like transcriptome including increased transmembrane transporter activity and SLC9A3 overexpression in an in vitro, matured esophageal epithelium model system.
In order to define the involvement of SLC9A3/NHE3 in the regulation of [pH]i and DIS formation in a mature esophageal epithelial model system, we adapted an in vitro model developed from keratinocyte esophageal epithelial cells (EPC2) grown in air-liquid interface (ALI)28. EPC2 cells were grown under submerged conditions in low-calcium media (0.09 mM; days 0-3), changed to high-calcium media (1.8 mM, days 3-7) and then exposed to the ALI for 5 days in the presence of high calcium (1.8 mM, days 7-12) to induce differentiation and formation of a mature, stratified epithelium (Fig. 3A). Following maturation, EPC2-ALI cells were stimulated with vehicle or IL-13 and RNAseq analyses performed (Fig. 3A, days 12-14). We show that IL-13 significantly dysregulated a total of 572 genes (p < 0.05, fold change > 2.0); notably, many of the most highly dysregulated genes included inflammatory genes associated with EoE, including CCL26 (7-fold), TNFAIP6 (9-fold), CDH26 (3-fold) and CAPN14 (5-fold), and also gene families located in the epidermal differentiation cluster (EDC) on chromosome 1q21 (e.g., IVL, LOR, S100A4, S100A6) (Fig. 3B and Supplemental Table S1). Consistent with these findings, comparative analyses of the IL-13–induced transcriptome changes in EPC2-ALI cells with that of the EoE-specific transcriptome revealed significant overlap with the EoE-specific transcriptome (Fig. 3B, p < 0.0001). GO analysis based on the biological process on IL-13–dysregulated genes revealed the most significant 15 individual GO biological process nodes were associated with keratinization, epidermis development, skin development, keratinocyte differentiation, epidermal cell differentiation and inflammatory response and GO Pathways associated with formation of the cornified envelope, keratinization and interleukin-4 and 13 signaling (Supplemental Table S2, FDR-corrected p < 0.05). To examine the effect of IL-13 on transmembrane transporter activity, we performed GO analysis based on the molecular function of the 572 genes and identified 6 nodes significantly dysregulated related to transmembrane transport activity (Fig. 3C, FDR-corrected p < 0.05). Of the 28 differentially expressed transmembrane transport activity genes in these 6 GO nodes, SLC9A3 was one of the most highly upregulated genes (Fig. 3D).
IL-13 is known to signal through the JAK/STAT pathway, in particular through a STAT3- and STAT6-dependent signaling pathway43. To determine the involvement of STAT-3 and STAT-6 in IL-13 induction of SLC9A3 we examined SLC9A3 mRNA expression in STAT3 and STAT6 shRNA–transduced EPC2-ALI cells following IL-13 stimulation. Notably, STAT-3 knockdown in EPC2-ALI cells caused no significant reduction in IL-13–induced SLC9A3 expression compared to control shRNA–transduced EPC2-ALI cells (Figure 3E). In contrast, STAT6 knockdown in EPC2-ALI cells significantly ablated IL-13–induced SLC9A3 expression (50% reduction), suggesting that IL-13–induced STAT6 signaling is important for SLC9A3 expression in EPC2-ALI cells (Figure 3E). These studies demonstrate that IL-13 induces SLC9A3 expression in EPC2-ALI cells in part by STAT6-dependent mechanism.
IL-13–induced NHE3 expression and function in differentiated esophageal epithelial cells.
Employing this mature EPC2-ALI model system, we show that IL-13 stimulation of EPC2-ALI cells induced an increase in SLC9A3 mRNA (Fig. 4A) and NHE3 protein (Fig. 4B-C) expression. Immunofluorescence analyses revealed that NHE3 was barely expressed in vehicle-treated EPC2-ALI cells (Fig. 4D, top panel). In contrast, we observed a significant increase in NHE3 expression in EPC2-ALI cells following IL-13 exposure; comparable to what we observed in EoE biopsy samples, NHE3 was predominantly localized to the basal and suprabasal layer of epithelium in IL-13–treated EPC2-ALI cultures (Fig. 4D, lower panel). To examine NHE3 function in the mature EPC2-ALI cultures, we measured proton secretion rates in an Ussing chamber system fitted with pH-STAT (Fig. 4E). We show that IL-13 stimulation reduced the extracellular pH (pHe) compared with vehicle-treated control (pHe 6.82 vs. 6.97, respectively, p < 0.05), indicating altered acid-base transport. Notably, the reduction in pHe was abrogated with exposure to the specific NHE3 inhibitor S3226 (Fig. 4F), indicating NHE3-dependent proton extrusion. To measure the rate of acid extrusion by the mature EPC2-ALI, the apical side buffer was adjusted to an alkaline pH [pH 7.6; Ba(OH)2] to generate an ion concentration gradient and the amount of alkali [Ba(OH)2] required to maintain this condition (pH 7.6) was continuously monitored using a pH-STAT (Fig. 4G). We show that IL-13 stimulation of the mature EPC2-ALI cells led to increased Ba(OH)2 injection to counterbalance H+ secretion from the tissue and maintain pH 7.6 (Fig. 4G). To determine the involvement of NHE3 in apical acid secretion function in the mature EPC2-ALI, S3226 was added to the apical side of the buffer to identify the NHE3-mediated fraction of acid secretion. Notably, the acid-secretion rate in IL-13–stimulated mature EPC2-ALI cells was significantly abrogated with S3226, indicating NHE3-dependent secretion (Fig. 4H). These observations indicate an IL-13–induced increase in NHE3-dependent acid secretion in EPC2-ALI cells.
Figure 4. Increased SLC9A3/NHE3 expression and activity in IL-13–stimulated EPC2-ALI.

A) qPCR, B) Western blot analysis and C) Western blot quantification of SLC9A3/NHE3 expression in EPC2-ALI following a 72 h-treatment with vehicle (Veh) or IL-13 (100 ng/mL). D) Immunofluorescence staining of vehicle (top panel) or 100 ng/mL of IL-13 (lower panel) stimulated EPC2-ALI cultures. NHE3 (red) and nuclei (blue) are shown. Images are presentative of 3 samples per group. Magnification X400 E) Schematic view of pH-STAT assay. See Material and Methods for detailed protocol. F) Baseline extracellular pH (pHe) of EPC2-ALI cells treated with vehicle or IL-13 for 72 h. DMSO (0.1%) or S3226 (30 μM) was added to both sides of the solution during the experiment (n = 6-11 samples per group from 5 individual experiments). G) Amount of Ba(OH)2 injection over time and H) Ba(OH)2 injection rate measured for EPC2-ALI cells treated with vehicle or IL-13 (100 ng/mL) for 72 h. DMSO (0.1%) or S3226 (30 μM) is added to both sides of the solution during experiment (n = 6-11 samples per group from 5 individual experiments). (A, C, F, H) Data are represented as the average ± S.E.M. *p < 0.05; n.s. not significant
Increased SLC9A3 expression and activity is linked with DIS formation.
Given the observed association between NHE3 and acid secretion in EPC2-ALI cells and correlation between SLC9A3 expression and DIS formation in esophageal biopsy samples from patients with EoE (Fig. 4H and 1I, respectively), we examined the relationship between NHE3 function and DIS formation in the mature EPC2-ALI cells. IL-13 stimulation of EPC2-ALI cells induced DIS formation within the basal and suprabasal layer of EPC2-ALI cells as evidenced by spaces between cells (Fig. 5A). Electron microscopy analyses revealed alteration to the intercellular junctional structures of esophageal cells, with the appearance of expanded or dilated intercellular areas (Fig. 5B). Notably, the DIS are sealed by lateral membranes that are of close apposition and tethered by intercellular junctional proteins such as desmosomes (Fig. 5B). To determine the requirement of NHE3 activity in DIS formation, we stimulated EPC-ALI cells with IL-13 in the presence of the NHE3 inhibitor S3226 (Fig. 5C-D). Notably, we show that the IL-13–induced DIS within the suprabasal layer in EPC2-ALI cells were diminished in the presence of S3226 (Fig. 5C-D). Collectively, we concluded that NHE3 has an important role in IL-13–induced DIS formation in esophageal cells.
Figure 5. Blockade of NHE3 protected EPC2-ALI from IL-13–induced dilated intercellular spaces (DIS).

A) H&E staining and B) electron microscopy of EPC2-ALI cultures stimulated with vehicle or IL-13 (100 ng/mL) for 72 h and showing DIS (black arrows) in only IL-13–treated cells. C) H&E staining of EPC2-ALI cultures stimulated with vehicle or IL-13 (100 ng/mL) in the presence and absence of S3226 (30 μM) for 72 h. D) DIS formation (% of total area) was quantitated by morphometric analyses and expressed as the mean ± S.E.M; n = 3 independent experiments; ****p < 0.0001. Magnification A) X200, B) X5000 and C) X300.
Discussion
EoE is characterized by histopathologic manifestations including BZH and DIS. The underlying molecular processes that drive these pathologic manifestations remain largely unexplored. Herein, we demonstrate 1) dysregulation of transmembrane transporter activity gene networks in esophageal biopsies from patients with EoE; 2) increased expression of the Na+-H+ exchanger SLC9A3/NHE3 in EoE esophageal biopsies and positive correlation of this increased expression with DIS area and eosinophil infiltration; 3) increased SLC9A3 expression and NHE3 activity in primary esophageal epithelial cells and in response to IL-13 stimulation in a mature EPC2-ALI model system; and 4) reduction of IL-13–induced DIS formation in EPC2-ALI cells by pharmacological antagonism of NHE3 activity. Collectively, we have identified a role for SLC9A3/NHE3 in IL-13–induced DIS formation in the esophageal epithelium and provide evidence for involvement of this pathway in EoE.
The cytokine IL-13 has an important role in driving the underling allergic inflammatory cascade and the histopathologic features of EoE22-24. This notion is supported by the observations that stimulating esophageal cells with IL-13 leads to a transcript signature that partially overlaps the esophageal EoE transcriptome18. Furthermore, while the primary outcome of greater than 75% decrease in peak eosinophil counts at week 12 was not met, treating patients with EoE with anti–IL-13 (QAX576) reduced intraepithelial esophageal eosinophil counts and lead to an improvement in the EoE transcriptome and clinical symptom such as dysphagia in adults with EoE25. Our observation of elevated SLC9A3 and NHE3 expression in EoE tissue samples and in both primary esophageal epithelial and EPC2-ALI cultures following IL-13 stimulation was surprising given that SLC9A3/NHE3 expression and function is predominantly associated with induction of Th1 proinflammatory cytokines, including IFN-γ and TNF44. IFN-γ and TNF are thought to modulate SLC9A3 expression by PKA-mediated phosphorylation of Sp1 and Sp3 transcription factors44. TNF has also been shown to alter NHE3 activity by stimulating PKCα-dependent internalization of NHE345. Stimulation of EPC2-ALI cultures with other pro-Type 2 cytokines such as IL-25 and IL-33 did not lead to induction of SLC9A3/NHE3 mRNA expression (results not shown). Notably, a recent study in kidney and intestinal epithelial cells (Caco-2) reported a STAT3-dependent increase in SLC9A3 expression through the recruitment of transcriptional factor Sp1 and Sp346 IL-13 is known to signal through the JAK/STAT pathway, in particular through a STAT3- and STAT6-dependent signaling pathway43. We reveal that STAT6 signaling plays a significant role in IL-13–induced SLC9A3 expression in EPC2-ALI cells. Examining the SLC9A3 promoter did not reveal the presence of STAT6 gamma-interferon-activation site (GAS) elements (results not shown), suggesting that STAT6 may indirectly modulate SLC9A3 expression. Notably, there are recent reports of IL-13–induced, STAT6-dependent activation of EGR1 signaling pathways in EoE47, 48, and previous studies in intestinal epithelial cells have revealed that overexpression of EGR1 promotes SLC9A3/NHE3 expression and activity49. We are currently further pursuing the molecular basis of IL-13 transcriptional regulation of SLC9A3 expression.
SLC9A3 as a member of the Na+/H+ exchanger family, drives Na+-dependent extrusion of H+ and is primarily involved in the regulation of [pH]i and acid protective mechanisms50-53. A consequence of Na+-dependent acid extrusion in a multilayered stratified epithelium such as the esophageal epithelium is acidification of the intercellular spaces54. In well-perfused tissues where there are short diffusion distances and good cell-to-capillary diffusive coupling, the acid is rapidly buffered by phosphates, proteins and HCO3−55. However, in stratified epithelium that is undergoing rapid and sustained cellular proliferation, the diffusion distances are increased leading to often-inadequate capillary perfusion, which limits the capacity of the intercellular acid-protective mechanisms and neutralization of the acidified intercellular spaces. The accumulation of acid [H+] in the intercellular spaces permits the formation of an electrochemical gradient and Cl− diffusion, creating an osmotic force for water flux and dilation of the intercellular spaces56, 57 In EoE, there is significant esophageal epithelial basal zone (BZ) expansion, and the basal cell layer can exceed 15% of the total epithelial thickness58. We speculate that the esophageal proliferative response and the thickening of the suprabasal layer of the esophageal epithelium in EoE increases the diffusion distances, thus causing a loss in the intercellular acid-protective mechanisms and leading to DIS. Consistent with the concept of esophageal epithelial intercellular acid as a primary driver for DIS in EoE, luminal acid has been shown to drive acidification of the intercellular spaces and DIS in non-erosive reflux disease55-57,59. Further, support for this concept, a recent study reports a strong positive correlation between BZH and DIS (r2 ≥ 0.67) in both proximal and distal biopsy samples from pediatric patients with EoE60. Interestingly, the increased esophageal intercellular acid in non-erosive reflux disease is thought to activate afferent neurons (nociceptors) within the esophageal epithelium leading to the development of heartburn59,61. Intriguingly, though not common, EoE is also associated with the development of heartburn4.
SLC9A3’s role in the regulation of [pH]i may not simply in response to dysregulation of [pH]i but also in part fulfilling a larger role in the regulation of esophageal epithelial proliferation. Moreover, intracellular pH plays an important role in many cellular functions including proliferation62 and apoptosis63. In tumor cells, the [pH]i is often elevated as compared to normal cells, and it is thought that the alkaline [pH]i provides an optimal environment for DNA synthesis relative to enzyme function64. Consistent with this, growth factors such as EGF and PDGF stimulate a rapid rise in [pH]i that is a critical requirement for entry of mitogen-stimulated quiescent cells into the S phase of the cell cycle65, 66. Experimental studies have identified an important role for NHE family members in the growth factor–induced increase in [pH]i and cellular proliferation67, 68 The pharmacologic abrogation of mitogen-stimulated, Na+-dependent extrusion of H+ and increase in [pH]i-inhibited growth factor-induced mouse bone marrow-derived macrophage DNA synthesis and prevents progression into the S phase67. Furthermore, the rapid and transient mitogen-induced increase in NHE1 activity and [pH]i during G2/M entry and transition is ablated in NHE1 mutant fibroblasts68. Notably, increasing the [pH]i in the absence of NHE1 activity was sufficient to restore CDC2 activity and cyclin B1 expression and to promote G2/M entry and transition and cellular proliferation, indicating that the NHE1-driven increase in [pH]i at the completion of S phase is an important checkpoint for progression to G2 and mitosis68. We speculate that IL-13 induction of SLC9A3/NHE3 may be a critical requirement for esophageal epithelial cell proliferation via regulating [pH]i. Notably, we have previously demonstrated that overexpression of IL-13 in mice leads to esophageal cell proliferation69. Herein, we show co-localization of NHE3 expression within the esophageal basal proliferative zone in EoE esophageal biopsy samples and IL-13–treated EPC2-ALI cultures. Furthermore, we show that stimulating EPC2-ALI cells with IL-13 induces SLC9A3, but not SLC9A1, expression and that treating mature EPC2-ALI cells with the pan NHE inhibitor ethylisopropyl amiloride (EIPA) attenuated IL-13–induced proliferation (Supplemental Figure S3). These findings support the necessity of an NHE in IL-13–induced proliferation in an esophageal epithelial model system in vitro and given the overexpression, localization and function of NHE3, we conjecture that [pH]i balance and regulation is a critical component of the observed proliferative effect that is induced by IL-13 and mediated by an NHE in esophageal epithelial cells.
Multiple compensatory mechanisms regulate [pH]i in mammalian cells and involve Na+/H+ exchangers, HCO3- transporters, lactate-H+ transporters and vacuolar H+-ATPase70, 71. Our gene ontology analysis supports dysregulation of these mechanisms in EoE, identifying that 5 out of the 50 individual GO nodes generated from genes significantly dysregulated in EoE are tightly correlated with the transmembrane ion transport activity. Notably, several the most dysregulated genes were part of the [pH]i regulatory circuit, including Cl−/HCO3− exchangers (SLC26A4, SLC4A2, SLC4A8) and carbonic anhydrases (CA2). These functional analyses support the concept of [pH]i pathways being active in the primary esophageal epithelial cells in EoE.
The significant decrease in DIS with steroid therapy or elimination diet in patients with EoE being associated with symptom improvement31 indicates an association between DIS and the etiology of EoE. We demonstrate a role for SLC9A3/NHE3 and Na+/H+ exchange in DIS formation, one of the histopathologic manifestations of EoE. Given our observations, one would predict that utilizing NHE3 antagonists (systemically or topically) may be a therapeutic approach for reducing DIS and thus normalizing associated esophageal caliber dimensions in EoE. Notably, a NHE3-specific inhibitor, tenapanor, is in phase 3 clinical trials for treatment of cardiorenal and gastrointestinal disease72. Tenapanor has been shown to reduce sodium uptake, resulting in reduction in [pH]i72. Given the contribution of DIS to esophageal barrier dysfunction and facilitating food allergen exposure, considering potential usage of NHE3 inhibitors for EoE is warranted.
In summary, we identified a relationship between SLC9A3/NHE3 expression and activity with DIS in EoE. Mechanistically, we show that IL-13 stimulates SLC9A3 expression and NHE3 activity (via [pH]i) and that these were associated with esophageal epithelial DIS. Inhibiting NHE activity attenuated esophageal epithelial DIS formation, providing rationale for the therapeutic utilization of NHE3 antagonists for reducing DIS and DIS-associated esophageal pathophysiologic manifestations in EoE.
Supplementary Material
Key Messages.
EoE transcriptome consists of altered expression of gene networks associated with regulation of intracellular pH ([pH]i) and acid protective mechanisms.
Increased expression of levels of SLC9A3 within the basal layer of esophageal biopsies from patients with EoE and that expression positively correlated with disease severity (eosinophils/HPF) and DIS.
IL-13–induced SLC9A3 expression and Na+-dependent proton secretion and that SLC9A3 activity positively correlated with DIS formation.
IL-13–mediated Na+-dependent proton secretion was the primary intracellular acid protective mechanism within the esophageal epithelium.
SLC9A3-dependent transport is required for IL-13–induced DIS formation.
Acknowledgments
Grant support: This work was supported by NIH DK090119, NIH AI112626, FARE and The Crohn’s Colitis Foundation of America (S.P.H).
Abbreviations:
- EoE
Eosinophilic esophagitis
- DIS
dilated intercellular spaces
- IL
interleukin
- DSG-1
desmoglein-1
- LRRC31
leucine-rich repeat–containing protein 31
- KLK
kallikrein
- CAPN14
calpain 14
- GERD
gastroesophageal reflux disease
- RNAseq
RNA sequencing
- SLC
solute carrier family
- SLC9A3
solute carrier family 9, subfamily A, member 3
- NHE3
sodium-hydrogen exchanger member 3
- ESSE
primary esophageal epithelial cells
- TNF
tumor necrosis factor
- IFN
interferon
- STAT
Signal transducer and activator of transcription
- GAS
gamma-interferon-activation site
- EGF
epidermal growth factor
- PDGF
platelet derived growth factor
- CA2
carbonic anhydrases
- BZH
basal zone hyperplasia
Footnotes
Disclosures: M.E.R. is a consultant for Immune Pharmaceuticals, NKT Therapeutics, Pulm One, Celgene, Shire, GlaxoSmith Kline, Astra Zeneca and Novartis and has an equity interest in the first three companies listed and royalties from reslizumab (Teva Pharmaceuticals). M.E.R. is an inventor of several patents, owned by Cincinnati Children’s, and a set of these patents relates to molecular diagnostics. M.C. is a consultant for Shire and Actelion and has received research grant support from Shire, Regeneron and Nutricia. The other authors have declared that they have no conflict of interest.
Publisher's Disclaimer: This is a PDF file of an unedited manuscript that has been accepted for publication. As a service to our customers we are providing this early version of the manuscript. The manuscript will undergo copyediting, typesetting, and review of the resulting proof before it is published in its final citable form. Please note that during the production process errors may be discovered which could affect the content, and all legal disclaimers that apply to the journal pertain.
References
- 1.Dellon ES, Hirano I. Epidemiology and Natural History of Eosinophilic Esophagitis. Gastroenterology 2017. [DOI] [PMC free article] [PubMed] [Google Scholar]
- 2.Dellon ES. Epidemiology of eosinophilic esophagitis. Gastroenterol Clin North Am 2014; 43:201–18. [DOI] [PMC free article] [PubMed] [Google Scholar]
- 3.Prasad GA, Alexander JA, Schleck CD, Zinsmeister AR, Smyrk TC, Elias RM, et al. Epidemiology of eosinophilic esophagitis over three decades in Olmsted County, Minnesota. Clin Gastroenterol Hepatol 2009; 7:1055–61. [DOI] [PMC free article] [PubMed] [Google Scholar]
- 4.Arias A, Perez-Martinez I, Tenias JM, Lucendo AJ. Systematic review with meta-analysis: the incidence and prevalence of eosinophilic oesophagitis in children and adults in population-based studies. Aliment Pharmacol Ther 2016; 43:3–15. [DOI] [PubMed] [Google Scholar]
- 5.Liacouras CA, Furuta GT, Hirano I, Atkins D, Attwood SE, Bonis PA, et al. Eosinophilic esophagitis: updated consensus recommendations for children and adults. J Allergy Clin Immunol 2011; 128:3–20 e6; quiz 1–2. [DOI] [PubMed] [Google Scholar]
- 6.Klinnert MD, Silveira L, Harris R, Moore W, Atkins D, Fleischer DM, et al. Health-Related Quality of Life Over Time in Children With Eosinophilic Esophagitis and Their Families. Journal of Pediatric Gastroenterology and Nutrition 2014; 59:308–16. [DOI] [PMC free article] [PubMed] [Google Scholar]
- 7.Akei HS, Mishra A, Blanchard C, Rothenberg ME. Epicutaneous Antigen Exposure Primes for Experimental Eosinophilic Esophagitis in Mice. Gastroenterology 2005; 129:985–94. [DOI] [PubMed] [Google Scholar]
- 8.Collins MH. Histopathology of eosinophilic esophagitis. Dig Dis 2014; 32:68–73. [DOI] [PubMed] [Google Scholar]
- 9.Collins MH. Histopathologic features of eosinophilic esophagitis. Gastrointest Endosc Clin N Am 2008; 18:59–71; viii-ix. [DOI] [PubMed] [Google Scholar]
- 10.Doherty TA, Baum R, Newbury RO, Yang T, Dohil R, Aquino M, et al. Group 2 innate lymphocytes (ILC2) are enriched in active eosinophilic esophagitis. J Allergy Clin Immunol 2015; 136:792–4.e3. [DOI] [PMC free article] [PubMed] [Google Scholar]
- 11.Abu-Sultaneh SM, Durst P, Maynard V, Elitsur Y. Fluticasone and food allergen elimination reverse sub-epithelial fibrosis in children with eosinophilic esophagitis. Dig Dis Sci 2011; 56:97–102. [DOI] [PubMed] [Google Scholar]
- 12.Straumann A, Conus S, Degen L, Felder S, Kummer M, Engel H, et al. Budesonide is effective in adolescent and adult patients with active eosinophilic esophagitis. Gastroenterology 2010; 139:1526–37, 37 e1. [DOI] [PubMed] [Google Scholar]
- 13.Arora AS, Perrault J, Smyrk TC. Topical corticosteroid treatment of dysphagia due to eosinophilic esophagitis in adults. Mayo Clin Proc 2003; 78:830–5. [DOI] [PubMed] [Google Scholar]
- 14.Faubion WA Jr.,, Perrault J, Burgart LJ, Zein NN, Clawson M, Freese DK Treatment of eosinophilic esophagitis with inhaled corticosteroids. J Pediatr Gastroenterol Nutr 1998; 27:90–3. [DOI] [PubMed] [Google Scholar]
- 15.Kelly KJ, Lazenby AJ, Rowe PC, Yardley JH, Perman JA, Sampson HA. Eosinophilic esophagitis attributed to gastroesophageal reflux: improvement with an amino acid-based formula. Gastroenterology 1995; 109:1503–12. [DOI] [PubMed] [Google Scholar]
- 16.Liacouras CA, Ruchelli E. Eosinophilic esophagitis. Curr Opin Pediatr 2004; 16:560–6. [DOI] [PubMed] [Google Scholar]
- 17.Liacouras CA, Wenner WJ, Brown K, Ruchelli E. Primary eosinophilic esophagitis in children: successful treatment with oral corticosteroids. J Pediatr Gastroenterol Nutr 1998; 26:380–5. [DOI] [PubMed] [Google Scholar]
- 18.Blanchard C, Mingler MK, Vicario M, Abonia JP, Wu YY, Lu TX, et al. IL-13 involvement in eosinophilic esophagitis: transcriptome analysis and reversibility with glucocorticoids. J Allergy Clin Immunol 2007; 120:1292–300. [DOI] [PubMed] [Google Scholar]
- 19.Mishra A, Hogan SP, Brandt EB, Rothenberg ME. IL-5 promotes eosinophil trafficking to the esophagus. J Immunol 2002; 168:2464–9. [DOI] [PubMed] [Google Scholar]
- 20.Mishra A, Hogan SP, Brandt EB, Rothenberg ME. An etiological role for aeroallergens and eosinophils in experimental esophagitis. J Clin Invest 2001; 107:83–90. [DOI] [PMC free article] [PubMed] [Google Scholar]
- 21.Mishra A, Rothenberg ME. Intratracheal IL-13 induces eosinophilic esophagitis by an IL-5, eotaxin-1, and STAT6-dependent mechanism. Gastroenterology 2003; 125:1419–27. [DOI] [PubMed] [Google Scholar]
- 22.Blanchard C, Stucke EM, Burwinkel K, Caldwell JM, Collins MH, Ahrens A, et al. Coordinate interaction between IL-13 and epithelial differentiation cluster genes in eosinophilic esophagitis. J Immunol 2010; 184:4033–41. [DOI] [PMC free article] [PubMed] [Google Scholar]
- 23.Blanchard C, Stucke EM, Rodriguez-Jimenez B, Burwinkel K, Collins MH, Ahrens A, et al. A striking local esophageal cytokine expression profile in eosinophilic esophagitis. J Allergy Clin Immunol 2011; 127:208–17, 17 e1–7. [DOI] [PMC free article] [PubMed] [Google Scholar]
- 24.Sherrill JD, Kiran KC, Blanchard C, Stucke EM, Kemme KA, Collins MH, et al. Analysis and expansion of the eosinophilic esophagitis transcriptome by RNA sequencing. Genes Immun 2014; 15:361–9. [DOI] [PMC free article] [PubMed] [Google Scholar]
- 25.Rothenberg ME, Wen T, Greenberg A, Alpan O, Enav B, Hirano I, et al. Intravenous anti-IL-13 mAb QAX576 for the treatment of eosinophilic esophagitis. J Allergy Clin Immunol 2015; 135:500–7. [DOI] [PubMed] [Google Scholar]
- 26.D'Mello RJ, Caldwell JM, Azouz NP, Wen T, Sherrill JD, Hogan SP, et al. LRRC31 is induced by IL-13 and regulates kallikrein expression and barrier function in the esophageal epithelium. Mucosal Immunol 2016; 9:744–56. [DOI] [PMC free article] [PubMed] [Google Scholar]
- 27.Davis BP, Stucke EM, Khorki ME, Litosh VA, Rymer JK, Rochman M, et al. Eosinophilic esophagitis-linked calpain 14 is an IL-13-induced protease that mediates esophageal epithelial barrier impairment. JCI Insight 2016; 1:e86355. [DOI] [PMC free article] [PubMed] [Google Scholar]
- 28.Sherrill JD, Kc K, Wu D, Djukic Z, Caldwell JM, Stucke EM, et al. Desmoglein-1 regulates esophageal epithelial barrier function and immune responses in eosinophilic esophagitis. Mucosal Immunol 2014; 7:718–29. [DOI] [PMC free article] [PubMed] [Google Scholar]
- 29.Purdy JK, Appelman HD, Golembeski CP, McKenna BJ. Lymphocytic esophagitis: a chronic or recurring pattern of esophagitis resembling allergic contact dermatitis. Am J Clin Pathol 2008; 130:508–13. [DOI] [PubMed] [Google Scholar]
- 30.Caviglia R, Ribolsi M, Maggiano N, Gabbrielli AM, Emerenziani S, Guarino MP, et al. Dilated intercellular spaces of esophageal epithelium in nonerosive reflux disease patients with physiological esophageal acid exposure. Am J Gastroenterol 2005; 100:543–8. [DOI] [PubMed] [Google Scholar]
- 31.Ravelli A, Villanacci V, Cadei M, Fuoti M, Gennati G, Salemme M. Dilated intercellular spaces in eosinophilic esophagitis. J Pediatr Gastroenterol Nutr 2014; 59:589–93. [DOI] [PubMed] [Google Scholar]
- 32.Mueller S, Neureiter D, Aigner T, Stolte M. Comparison of histological parameters for the diagnosis of eosinophilic oesophagitis versus gastro-oesophageal reflux disease on oesophageal biopsy material. Histopathology 2008; 53:676–84. [DOI] [PubMed] [Google Scholar]
- 33.Orlowski J, Grinstein S. Emerging roles of alkali cation/proton exchangers in organellar homeostasis. Curr Opin Cell Biol 2007; 19:483–92. [DOI] [PMC free article] [PubMed] [Google Scholar]
- 34.Trapnell C, Roberts A, Goff L, Pertea G, Kim D, Kelley DR, et al. Differential gene and transcript expression analysis of RNA-seq experiments with TopHat and Cufflinks. Nat Protoc 2012; 7:562–78. [DOI] [PMC free article] [PubMed] [Google Scholar]
- 35.Langmead B, Trapnell C, Pop M, Salzberg SL. Ultrafast and memory-efficient alignment of short DNA sequences to the human genome. Genome Biol 2009; 10:R25. [DOI] [PMC free article] [PubMed] [Google Scholar]
- 36.Garber M, Grabherr MG, Guttman M, Trapnell C. Computational methods for transcriptome annotation and quantification using RNA-seq. Nature Methods 2011; 8:469–77. [DOI] [PubMed] [Google Scholar]
- 37.Kartashov AV, Barski A. BioWardrobe: an integrated platform for analysis of epigenomics and transcriptomics data. Genome Biol 2015; 16:158. [DOI] [PMC free article] [PubMed] [Google Scholar]
- 38.Chen J, Bardes EE, Aronow BJ, Jegga AG. ToppGene Suite for gene list enrichment analysis and candidate gene prioritization. Nucleic Acids Res 2009; 37:W305–11. [DOI] [PMC free article] [PubMed] [Google Scholar]
- 39.Harada H, Nakagawa H, Oyama K, Takaoka M, Andl CD, Jacobmeier B, et al. Telomerase induces immortalization of human esophageal keratinocytes without p16(INK4a) inactivation. Molecular Cancer Research 2003; 1:729–38. [PubMed] [Google Scholar]
- 40.Schwark JR, Jansen HW, Lang HJ, Krick W, Burckhardt G, Hropot M. S3226, a novel inhibitor of Na+/H+ exchanger subtype 3 in various cell types. Pflugers Arch 1998; 436:797–800. [DOI] [PubMed] [Google Scholar]
- 41.Iovannisci D, Illek B, Fischer H. Function of the HVCN1 proton channel in airway epithelia and a naturally occurring mutation, M91T. J Gen Physiol 2010; 136:35–46. [DOI] [PMC free article] [PubMed] [Google Scholar]
- 42.Wakabayashi S, Shigekawa M, Pouyssegur J. Molecular physiology of vertebrate Na+/H+ exchangers. Physiol Rev 1997; 77:51–74. [DOI] [PubMed] [Google Scholar]
- 43.Liu Y, Munker S, Mullenbach R, Weng HL. IL-13 Signaling in Liver Fibrogenesis. Front Immunol 2012; 3:116. [DOI] [PMC free article] [PubMed] [Google Scholar]
- 44.Amin MR, Malakooti J, Sandoval R, Dudeja PK, Ramaswamy K. IFN-gamma and TNF-alpha regulate human NHE3 gene expression by modulating the Sp family transcription factors in human intestinal epithelial cell line C2BBe1. Am J Physiol Cell Physiol 2006; 291:C887–96. [DOI] [PubMed] [Google Scholar]
- 45.Clayburgh DR, Musch MW, Leitges M, Fu YX, Turner JR. Coordinated epithelial NHE3 inhibition and barrier dysfunction are required for TNF-mediated diarrhea in vivo. J Clin Invest 2006; 116:2682–94. [DOI] [PMC free article] [PubMed] [Google Scholar]
- 46.Su HW, Wang SW, Ghishan FK, Kiela PR, Tang MJ. Cell confluency-induced Stat3 activation regulates NHE3 expression by recruiting Sp1 and Sp3 to the proximal NHE3 promoter region during epithelial dome formation. Am J Physiol Cell Physiol 2009; 296:C13–24. [DOI] [PMC free article] [PubMed] [Google Scholar]
- 47.Rochman M, Kartashov AV, Caldwell JM, Collins MH, Stucke EM, Kc K, et al. Neurotrophic tyrosine kinase receptor 1 is a direct transcriptional and epigenetic target of IL-13 involved in allergic inflammation. Mucosal Immunol 2015; 8:785–98. [DOI] [PMC free article] [PubMed] [Google Scholar]
- 48.Cho SJ, Kang MJ, Homer RJ, Kang HR, Zhang X, Lee PJ, et al. Role of early growth response-1 (Egr-1) in interleukin-13-induced inflammation and remodeling. J Biol Chem 2006; 281:8161–8. [DOI] [PubMed] [Google Scholar]
- 49.Malakooti J, Sandoval R, Amin MR, Clark J, Dudeja PK, Ramaswamy K. Transcriptional stimulation of the human NHE3 promoter activity by PMA: PKC independence and involvement of the transcription factor EGR-1. Biochem J 2006; 396:327–36. [DOI] [PMC free article] [PubMed] [Google Scholar]
- 50.Brant SR, Yun CH, Donowitz M, Tse CM. Cloning, tissue distribution, and functional analysis of the human Na+/N+ exchanger isoform, NHE3. Am J Physiol 1995; 269:C198–206. [DOI] [PubMed] [Google Scholar]
- 51.Praetorius J, Andreasen D, Jensen BL, Ainsworth MA, Friis UG, Johansen T. NHE1, NHE2, and NHE3 contribute to regulation of intracellular pH in murine duodenal epithelial cells. Am J Physiol Gastrointest Liver Physiol 2000; 278:G197–206. [DOI] [PubMed] [Google Scholar]
- 52.Wang Z, Orlowski J, Shull GE. Primary structure and functional expression of a novel gastrointestinal isoform of the rat Na/H exchanger. J Biol Chem 1993; 268:11925–8. [PubMed] [Google Scholar]
- 53.Schultheis PJ, Clarke LL, Meneton P, Miller ML, Soleimani M, Gawenis LR, et al. Renal and intestinal absorptive defects in mice lacking the NHE3 Na+/H+ exchanger. Nat Genet 1998; 19:282–5. [DOI] [PubMed] [Google Scholar]
- 54.Swietach P, Vaughan-Jones RD, Harris AL, Hulikova A. The chemistry, physiology and pathology of pH in cancer. Philos Trans R Soc Lond B Biol Sci 2014; 369:20130099. [DOI] [PMC free article] [PubMed] [Google Scholar]
- 55.Orlando RC. Esophageal mucosal defense mechanisms. GI Motility online 2006. [Google Scholar]
- 56.Tobey NA, Gambling TM, Vanegas XC, Carson JL, Orlando RC. Physicochemical basis for dilated intercellular spaces in non-erosive acid-damaged rabbit esophageal epithelium. Dis Esophagus 2008; 21:757–64. [DOI] [PubMed] [Google Scholar]
- 57.Orlando LA, Orlando RC. Dilated intercellular spaces as a marker of GERD. Curr Gastroenterol Rep 2009; 11:190–4. [DOI] [PubMed] [Google Scholar]
- 58.Noffsinger AE. Update on esophagitis: controversial and underdiagnosed causes. Archives of pathology & laboratory medicine 2009; 133:1087–95. [DOI] [PubMed] [Google Scholar]
- 59.Barlow WJ, Orlando RC. The pathogenesis of heartburn in nonerosive reflux disease: a unifying hypothesis. Gastroenterology 2005; 128:771–8. [DOI] [PubMed] [Google Scholar]
- 60.Collins MH, Martin LJ, Alexander ES, Boyd JT, Sheridan R, He H, et al. Newly developed and validated eosinophilic esophagitis histology scoring system and evidence that it outperforms peak eosinophil count for disease diagnosis and monitoring. Dis Esophagus 2017; 30:1–8. [DOI] [PMC free article] [PubMed] [Google Scholar]
- 61.Rodrigo J, Hernandez DJ, Vidal MA, Pedrosa JA. Vegetative innervation of the esophagus III. Intraepithelial endings. Acta Anat 1975; 92:242. [DOI] [PubMed] [Google Scholar]
- 62.Pouyssegur J, Franchi A, L'Allemain G, Paris S. Cytoplasmic pH, a key determinant of growth factor-induced DNA synthesis in quiescent fibroblasts. FEBS Lett 1985; 190:115–9. [DOI] [PubMed] [Google Scholar]
- 63.Schelling JR, Abu Jawdeh BG. Regulation of cell survival by Na+/H+ exchanger-1. Am J Physiol Renal Physiol 2008; 295:F625–32. [DOI] [PMC free article] [PubMed] [Google Scholar]
- 64.Moolenaar WH, Defize LH, De Laat SW. Ionic signalling by growth factor receptors. J Exp Biol 1986; 124:359–73. [DOI] [PubMed] [Google Scholar]
- 65.Di Sario A, Svegliati Baroni G, Bendia E, Ridolfi F, Saccomanno S, Ugili L, et al. Intracellular pH regulation and Na+/H+ exchange activity in human hepatic stellate cells: effect of platelet-derived growth factor, insulin-like growth factor 1 and insulin. J Hepatol 2001; 34:378–85. [DOI] [PubMed] [Google Scholar]
- 66.Li M, Morley P, Asem EK, Tsang BK. Epidermal growth factor elevates intracellular pH in chicken granulosa cells. Endocrinology 1991; 129:656–62. [DOI] [PubMed] [Google Scholar]
- 67.Vairo G, Cocks BG, Cragoe EJ Jr.,, Hamilton JA Selective suppression of growth factor-induced cell cycle gene expression by Na+/H+ antiport inhibitors. J Biol Chem 1992; 267:19043–6. [PubMed] [Google Scholar]
- 68.Putney LK, Barber DL. Na-H exchange-dependent increase in intracellular pH times G2/M entry and transition. J Biol Chem 2003; 278:44645–9. [DOI] [PubMed] [Google Scholar]
- 69.Zuo L, Fulkerson PC, Finkelman FD, Mingler M, Fischetti CA, Blanchard C, et al. IL-13 induces esophageal remodeling and gene expression by an eosinophil-independent, IL-13R alpha 2-inhibited pathway. J Immunol 2010; 185:660–9. [DOI] [PMC free article] [PubMed] [Google Scholar]
- 70.Schreiber R Ca2+ signaling, intracellular pH and cell volume in cell proliferation. J Membr Biol 2005; 205:129–37. [DOI] [PubMed] [Google Scholar]
- 71.Shrode LD, Tapper H, Grinstein S. Role of intracellular pH in proliferation, transformation, and apoptosis. J Bioenerg Biomembr 1997; 29:393–9. [DOI] [PubMed] [Google Scholar]
- 72.Spencer AG, Labonte ED, Rosenbaum DP, Plato CF, Carreras CW, Leadbetter MR, et al. Intestinal inhibition of the Na+/H+ exchanger 3 prevents cardiorenal damage in rats and inhibits Na+ uptake in humans. Sci Transl Med 2014; 6:227ra36. [DOI] [PubMed] [Google Scholar]
Associated Data
This section collects any data citations, data availability statements, or supplementary materials included in this article.