Abstract
Objective
To examine the long-term cognitive trajectories of individuals with normal cognition at baseline and distinct amyloid/tau/neurodegeneration (ATN) profiles.
Methods
Pooling data across 4 cohort studies, 814 cognitively normal participants (mean baseline age = 59.6 years) were classified into 8 ATN groups using baseline CSF levels of β-amyloid 1–42 as a measure of amyloid (A), phosphorylated tau 181 as a measure of tau (T), and total tau as a measure of neurodegeneration (N). Cognitive performance was measured using a previously validated global factor score and with the Mini-Mental State Examination. We compared the cognitive trajectories across groups using growth curve models (mean follow-up time = 7 years).
Results
Using different model formulations and cut points for determining biomarker abnormality, only the group with abnormal levels of amyloid, tau, and neurodegeneration (A+T+N+) showed consistently greater cognitive decline than the group with normal levels of all biomarkers (A−T−N−). Replicating prior findings using the 2011 National Institute on Aging–Alzheimer's Association/suspected non–Alzheimer disease pathophysiology schema, only individuals with abnormal levels of both amyloid and phosphorylated tau 181 or total tau (stage 2) showed greater cognitive decline than those with normal biomarker levels (stage 0).
Conclusion
The results are consistent with the hypothesis that both elevated brain amyloid and neurofibrillary tangles are necessary to observe accelerated neurodegeneration, which in turn leads to cognitive decline.
Based on accumulating evidence from neuropathologic and biomarker studies among cognitively normal adults, it is now recognized that Alzheimer disease (AD) pathology (i.e., amyloid plaques and neurofibrillary tangles) begins to develop many years before the emergence of obvious clinical symptoms.1 In 2011, the National Institute on Aging (NIA) and Alzheimer's Association (AA) published recommendations for staging the preclinical phase of AD, with stage 1 characterized by the presence of amyloid pathology, stage 2 by evidence of both amyloid and tau-related neurodegeneration, stage 3 by the presence of amyloid, tau, and subtle cognitive decline, and stage 0 by neither type of pathology.1 Subsequently, it was proposed that tau-related neurodegeneration in the absence of amyloid could be classified as suspected non-AD pathophysiology (SNAP).2 A consistent finding of prospective, longitudinal cohort studies that have examined the cognitive and clinical trajectories of individuals in these groups is that cognitive decline was primarily evident for stages 2 and 3.3–9
More recently, the amyloid/tau/neurodegeneration (ATN) classification schema has been proposed for organizing AD biomarkers during both the preclinical and symptomatic phases of the disease.10 This framework forms the basis of the 2018 NIA-AA research framework for AD.11 One of the major distinctions between the 2011 NIA-AA and ATN frameworks is that biomarkers of neuronal injury were divided into those specific for deposits of fibrillar tau and its associated pathophysiology (measured by tau PET imaging and phosphorylated tau [p-tau] in CSF) and those that provide nonspecific measures of neurodegeneration or neuronal injury (measured by MRI, [18F]-fluorodeoxyglucose–PET, or total tau [t-tau] in CSF). Thus, the ATN classification scheme divides AD biomarkers into 3 categories: (1) amyloid, (2) tau, and (3) neurodegeneration, which, when dichotomized into normal vs abnormal, results in 8 biomarker profiles.
Although an initial description of the demographic and cognitive characteristics of cognitively normal individuals with different ATN profiles has been published,12 no data currently exist regarding the clinical and cognitive trajectories of these groups. This may be because a very large sample size is needed to examine participants divided into the 8 groupings. Such a study is possible using data from the Preclinical AD Consortium,13 a collaboration of studies that have collected extensive biomarker data from participants who were cognitively normal at baseline and followed longitudinally. The aim of the current study was to examine the cognitive trajectories among 814 individuals with normal cognition at baseline and classified by both the 2011 NIA-AA/SNAP and the ATN groupings using baseline CSF measures.
Methods
Participants
The data used in this study are derived from 4 cohorts established to study the earliest phases of AD: the Adult Children Study (ACS),14 the Australian Imaging, Biomarker, and Lifestyle (AIBL) study,15 the Biomarkers of Cognitive Decline Among Normal Individuals (BIOCARD) study,16 and the Wisconsin Registry for Alzheimer's Prevention (WRAP)17 as well as its closely connected cohort Investigating Memory in Preclinical AD—Causes and Treatment (IMPACT). By design, at least half of the participants in each study had a family history of dementia. Individuals with epilepsy, recent strokes, or remote strokes with residual effects were excluded at baseline. Participants in all cohorts provided written informed consent. The study protocols were approved by the institutional review boards of Johns Hopkins University, University of Melbourne, University of Wisconsin, and Washington University.
Participants were included in the current study if they were cognitively normal at the time the CSF was collected and they had completed a clinical and cognitive evaluation within 1.5 years of that CSF collection date (mean interval for all 814 participants = 0.13 years, SD = 0.55, range = 0.15–1.38 years). For most participants (n = 755, 93%), the interval between the CSF draw and the cognitive visit was <1 year. Excluding participants with >1 year lag between the CSF and cognitive assessments did not significantly alter the results. For all participants, the first available CSF sample was used, which corresponded to the baseline visit for the majority of participants (n = 592), and to a subsequent visit for the remaining participants (n = 222).
CSF assessments
In each cohort, CSF was collected by routine lumbar puncture in the morning after overnight fasting. The samples were analyzed for β-amyloid 1–42 (Aβ1–42), t-tau, and p-tau181 using the xMAP-based AlzBio3 kit by Innogenetics (Ghent, Belgium) (BIOCARD and WRAP/IMPACT cohorts) or INNOTEST ELISA by Fujirebio Europe (Ghent, Belgium) (ACS, AIBL, WRAP/IMPACT cohorts). Additional details regarding CSF collection and processing have been published previously for each study: ACS,18 AIBL,19 BIOCARD,20 and WRAP/IMPACT.21 In light of the considerable interlaboratory variability of CSF assays of Aβ1–42, p-tau181, and t-tau,22 biomarker abnormality was established within each site, using cut points based on both tertiles and quartiles (see below).
Cognitive assessments
Cognitive assessments were completed at baseline and on a regular basis thereafter, depending on the protocol at each site (e.g., every 12 or 18 months). Each site administered a comprehensive neuropsychological battery to participants that covered all major cognitive domains, including attention, executive function, episodic memory, semantic memory, verbal fluency, visual-spatial processing, and processing speed. The specific tests administered at each site and included in the current analyses are listed in data available from Dryad (table e-1, doi.org/10.5061/dryad.88br3tn).
For the analyses presented in this report, cognitive performance was measured in 2 ways: (1) using a previously validated global cognitive factor score that summarizes performance across the cognitive variables from each study,13,23 and (2) using the Mini-Mental State Examination (MMSE), a measure of global cognition. The MMSE was administered at each site across visits and is widely recognized as a mental status test. The global cognitive factor score was created using relatively new procedures based on confirmatory factor analysis methods (see references 13 and 23 for additional details), which allowed for harmonization of data across the 5 cohorts. With this method, tests that are common to all cohorts, as well as noncommon tests, can be combined into a single score for each participant at each visit, thereby utilizing all available data. This is important given that most tests were not administered at all sites, across all visits, or to all participants (data available from Dryad, table e-1, doi.org/10.5061/dryad.88br3tn). We have previously shown that the global cognitive factor score, as calculated in this study, is associated with risk of progression to mild cognitive impairment in this cohort, suggesting that it is sensitive to subtle changes in cognition during preclinical AD. Briefly, using Mplus software, a factor score was estimated for each participant at each study visit using 2-parameter logistic item response models with a Bayesian estimator. Item-level fit of data in the models was evaluated using normalized residuals.24,25 Factor scores were estimated in the pooled data for each model based on averages of 30 plausible values from the posterior distribution generated by the models.26 Before combining cognitive testing data across the different studies, test versions and characteristics were reviewed with study-specific codebooks and documentation, and by comparing means and ranges of the variables. To facilitate comparisons of parameter estimates across tests, cognitive tests were standardized to a T-scale using data from all participants (mean = 50, SD = 10).
Statistical analysis
Individuals were classified into groups based on their CSF values using both the 2011 NIA-AA/SNAP schema (stages 0–2 and SNAP) and the ATN framework (8 groups). For these analyses, the CSF measures were dichotomized as normal or abnormal within each cohort using tertile cut points because of the known interlaboratory assay variability mentioned above. That is, Aβ1–42 in the lower one-third and t-tau or p-tau181 in the upper one-third of the cohort-specific distributions were considered abnormal. Tertiles were selected for the primary analyses based on the observation that about one-third of cognitively normal adults aged 50 to 70 years (i.e., the approximate age range of this sample) have one or more abnormal AD biomarkers.12 For the 2011 NIA-AA/SNAP schema, individuals were classified both using Aβ1–42 and p-tau181 (with t-tau being free to vary) and Aβ1–42 and t-tau (with p-tau181 being free to vary). For the ATN framework, p-tau181 was used as the marker of tau-related tangle pathology and t-tau a marker of neurodegeneration. Using tertile cut points, the proportion of individuals classified into the 2011 NIA-AA/SNAP stages was comparable to prior studies that used clinically validated cut points.5,7,12 In follow-up sensitivity analyses, other cut points were used, including (1) quartiles for all biomarkers or (2) tertiles for Aβ1–42 and quartiles for t-tau and p-tau181 to simulate the possibility that Aβ1–42 becomes abnormal earlier than tau and p-tau181. Similar results were obtained, suggesting robustness to choices of cut points (data available from Dryad, tables e-3 to e-6, doi.org/10.5061/dryad.88br3tn). Using more extreme cut points (i.e., quintiles), some of the group sizes became too small in our dataset for reliable analyses; however, the pattern of results remained the same (data not shown).
The data were analyzed using growth-curve models, including linear effects of time, to test whether the rate of change in cognition differed across the CSF groups. Growth curve models have the advantage that one can parsimoniously compare multiple groups to a single reference group within the same model, thus not requiring a correction for multiple comparisons. Models were specified with a random intercept and slope. Two main analyses were performed: (1) with groupings based on the NIA-AA/SNAP schema (separately for p-tau181 and t-tau); (2) with the ATN groups. Group status was coded using binary predictors (0 or 1) for each group. Because 222 participants had one or more cognitive testing sessions prior to their first CSF draw (which were excluded from trajectory modeling), we included a binary indicator for “prior cognitive testing exposure” to account for effects of practice on subsequent cognitive trajectories.
All models included the following predictors: indicators for each group (excluding indicators for the stage 0 and A−/T−/N− groups, which were treated as the reference groups), indicators for site (to control for site differences), baseline age, sex, years of education, indicator for prior cognitive test exposure, time, the interaction (i.e., cross-product) of each group indicator with time, and the age × time interaction (education × time and sex × time interactions were not significant). Group differences in the NIA-AA/SNAP schema were also examined using stage 2 as the reference, which is simply a recoded version of the original model. The outcome variables were cognitive trajectories over time measured by either (1) the global cognitive factor score or (2) the MMSE score. In both cases, the baseline test scores selected corresponded to the initial date of CSF collection ±1.5 years. All available follow-up scores were used.
The time variable in the models was defined in 2 ways: (1) time (in years) since CSF draw and (2) chronological age (in years) at CSF draw and at subsequent observations. The rationale for examining 2 alternative timescales is that change in cognitive performance is likely a consequence of both aging and the accumulation of age-related pathology, as opposed to time since CSF draw. However, using chronological age potentially confounds covariate effects with cohort effects, while models using time since CSF draw avoid this potential bias.27 In all models, the interaction of each group indicator with time tested whether the rate of change in the cognitive outcome variable differed between either the stage 0 or A−/T−/N− group (the reference group) and the other groups.
Differences in baseline characteristics of participants across CSF groups were first assessed using a global F test for continuous variables or a global χ2 test for categorical variables. Global F tests protect against false-positive results by examining the variability across all groups simultaneously. Only if the global F test was significant at p < 0.05, post hoc t tests or χ2 tests were performed to compare individual groups. Data analyses were performed using Mplus software, version 8.
Data availability
Anonymized study data for the primary analyses presented in this report are available on request from any qualified investigator for purposes of replicating the results.
Results
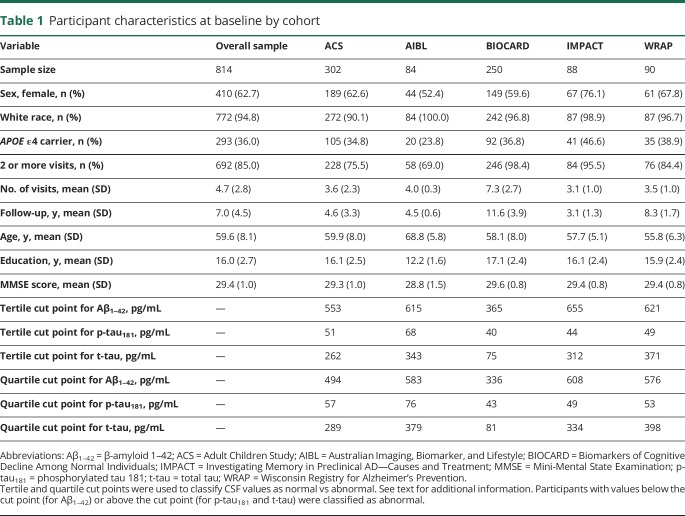
Baseline characteristics (i.e., at the time of the CSF draw) of participants included in this study are shown in table 1. Participants were primarily white, non-Hispanic, well-educated, and about one-third were carriers of the APOE ε4 allele, the major genetic risk factor for late-onset AD.28 In each cohort, CSF p-tau181 was highly correlated with t-tau (all r ≥ 0.69, all p < 0.0001); correlations between Aβ1–42 and t-tau or p-tau181 were considerably weaker and not consistent across cohorts (data available from Dryad, table e-2, doi.org/10.5061/dryad.88br3tn).
Table 1.
Participant characteristics at baseline by cohort
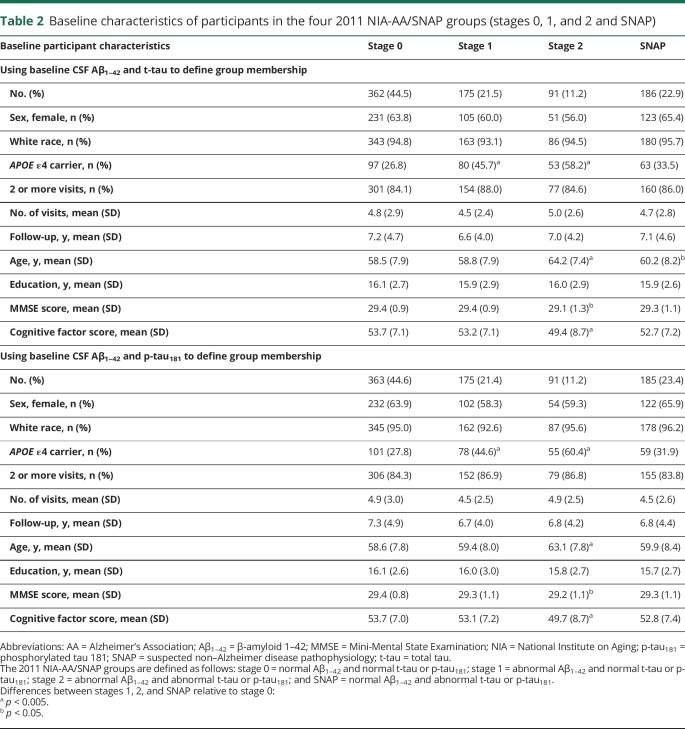
2011 NIA-AA/SNAP groups: Baseline characteristics and rate of change in cognition
Table 2 shows the baseline characteristics for participants in the NIA-AA/SNAP groups (stages 0–2 and SNAP), separately for groups defined by Aβ1–42 and t-tau vs Aβ1–42 and p-tau181. Using either t-tau or p-tau181 to define the groups, the mean number of visits, mean follow-up time, mean years of education, and proportion of women and nonwhite participants did not differ across groups. However, individuals in stage 2 were older and had lower baseline global cognitive factor scores compared to the other groups (all p < 0.001). In addition, the stage 1 and 2 groups had a higher proportion of APOE ε4 carriers than the stage 0 and SNAP groups (all p < 0.05). Of the 814 participants included in the analyses, 132 (16.2%) were classified in a different CSF group when groups were defined using Aβ1–42 and t-tau vs Aβ1–42 and p-tau181. Group membership changes were between stage 0 and SNAP (n = 93, with n = 46 switching from stage 0 to SNAP and n = 47 from SNAP to stage 0), with the remainder between stages 1 and 2 (n = 39, with n = 20 switching from stage 1 to stage 2 and n = 19 switching from stage 2 to stage 1).
Table 2.
Baseline characteristics of participants in the four 2011 NIA-AA/SNAP groups (stages 0, 1, and 2 and SNAP)
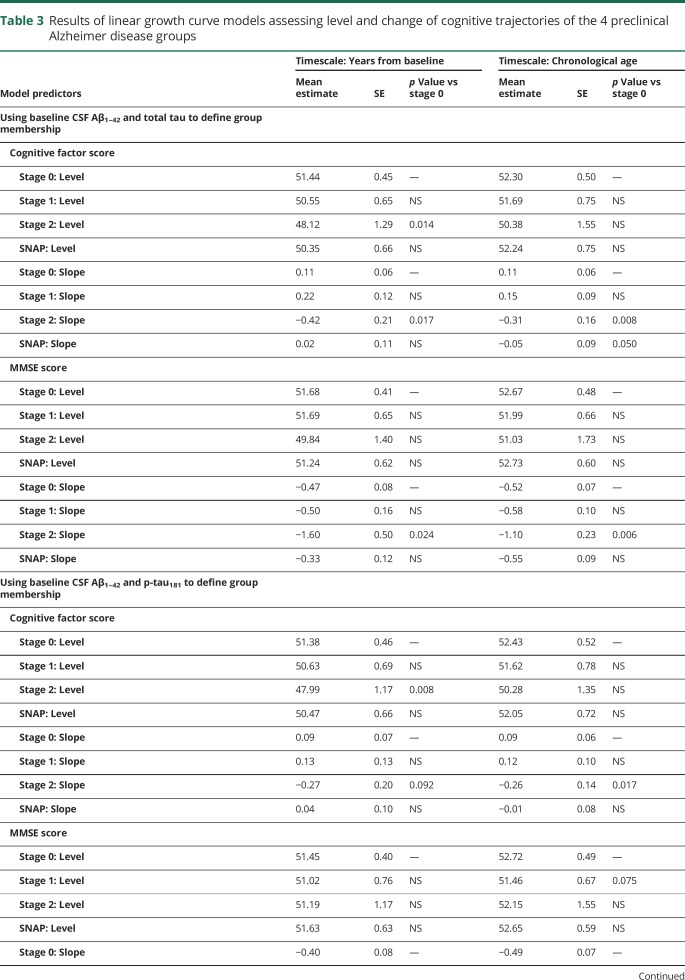
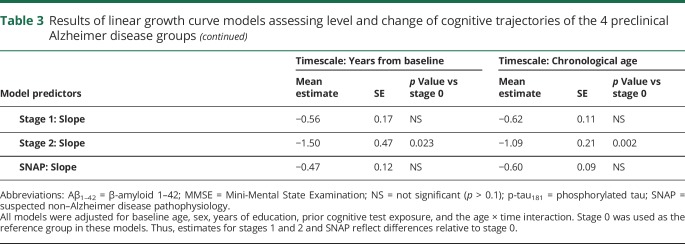
The results from models comparing the cognitive trajectories of individuals in stage 0 with the other groups are summarized in table 3. Unless noted otherwise, the same pattern of results was obtained using years since baseline or chronological age as timescales, and using either Aβ1–42 and t-tau or Aβ1–42 and p-tau181 to define the groups.
Table 3.
Results of linear growth curve models assessing level and change of cognitive trajectories of the 4 preclinical Alzheimer disease groups
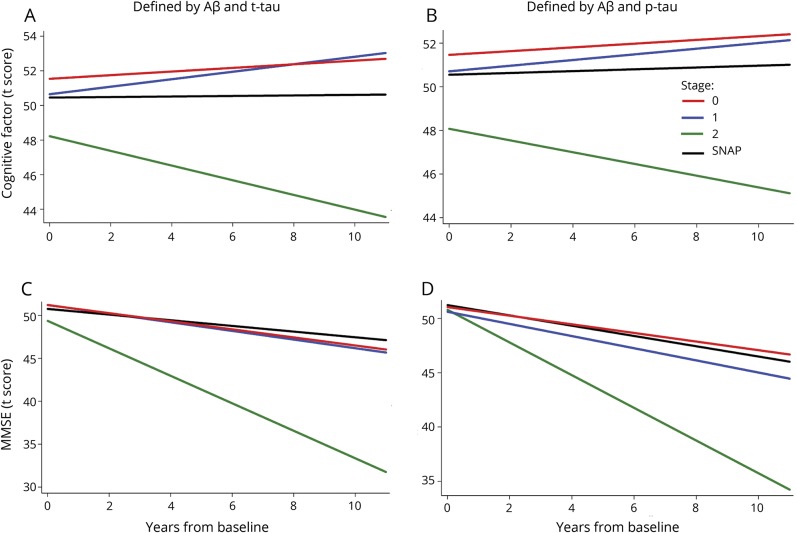
For the global cognitive factor score, the stage 2 group showed a greater rate of decline relative to the stage 0 and stage 1 groups (all p < 0.025, except using Aβ1–42 and p-tau181 to define the groups and years since baseline as the timescale: p = 0.089 and p = 0.093 for stage 2 vs 0 and 1, respectively). The rate of change in the cognitive factor score for the SNAP group was intermediate and did not differ from the other groups (all p ≥ 0.07). In addition, as shown in figure 1, using years since baseline as the timescale (but not using age), the stage 2 group had lower baseline cognitive factor scores compared to the other groups (all p < 0.062) (data available from Dryad, figure e-1, doi.org/10.5061/dryad.88br3tn).
Figure 1. Estimates of longitudinal change in cognition for the 4 National Institute on Aging–Alzheimer’s Association/SNAP groups.
Estimates from linear growth curve models predicting cognitive factor scores (A and B) and MMSE scores (C and D) over time among individuals classified into the 3 preclinical AD groups (stages 0, 1, 2) and SNAP using baseline CSF Aβ1–42 and t-tau (A and C) or Aβ1–42 and p-tau181 (B and D) for classification. The estimates are adjusted for baseline age, sex, education, and the age × time interaction and the timescale was years since baseline. The stage 2 group (solid green line) showed the greatest rate of decline among the 4 groups. Aβ1–42 = β-amyloid 1–42; MMSE = Mini-Mental State Examination; p-tau181 = phosphorylated tau 181; SNAP = suspected non–Alzheimer disease pathophysiology; t-tau = total tau.
Similarly, for the MMSE, individuals classified as stage 2 showed more decline relative to the stage 0, 1, and SNAP groups (all p ≤ 0.05, except for vs stage 1 defined using Aβ1–42 and p-tau181 and years since baseline as the timescale, where p = 0.069) (figure 1, C and D). There was no difference in the rate of change of the MMSE score between the stage 0, 1, and SNAP groups. There was also no difference in the baseline MMSE score between the groups.
ATN profile groups: Baseline characteristics and rate of change in cognition
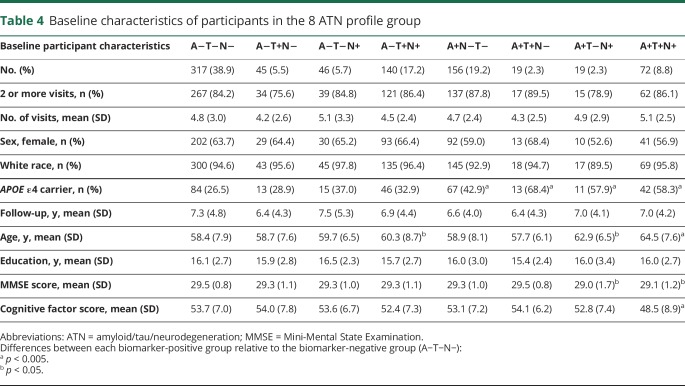
Baseline characteristics of participants in the 8 ATN groups are shown in table 4. There were no group differences in the number of visits, follow-up years, proportion of females, proportion of nonwhite participants, and years of education. Individuals who were positive for a given biomarker tended to be older (all p < 0.03), have slightly lower cognitive factor scores (all p < 0.007), and included more APOE ε4 carriers (all p < 0.02) than individuals negative for the same biomarker. Of note, the number of participants in the 2 groups positive for Aβ1–42 and either tau or neurodegeneration but not both (i.e., A+/T+/N− and A+/T−/N+) each represented only 2.3% of the sample, likely reflecting the high correlation between CSF p-tau181 and t-tau among A+ individuals.
Table 4.
Baseline characteristics of participants in the 8 ATN profile group
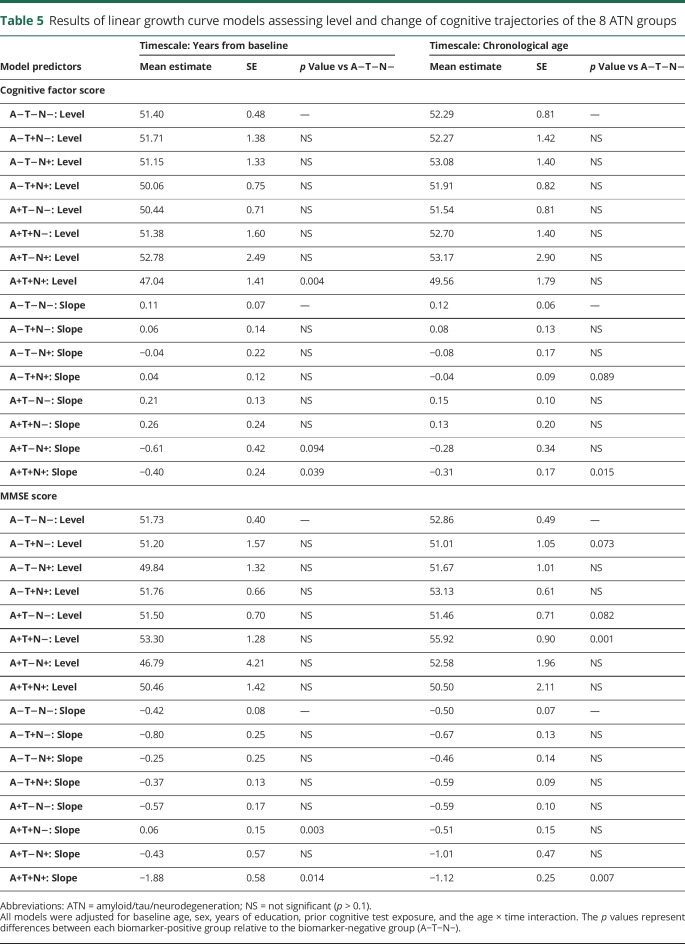
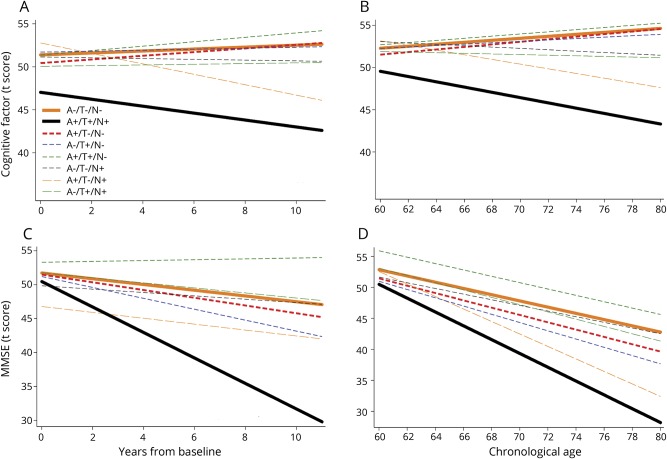
Table 5 shows the results from the growth curve models assessing the cognitive trajectories of the ATN groups, using the biomarker-negative group (A−/T−/N−) as a reference. The group positive for all biomarkers (A+/T+/N+) showed greater decline on the cognitive factor score compared to the reference group (p = 0.015 and p = 0.039 using age and years since baseline as the timescale, respectively) (figure 2, A and B). In addition, the A+/T+/N+ group had lower baseline factor scores than the reference group, using years since baseline as the timescale (p = 0.004).
Table 5.
Results of linear growth curve models assessing level and change of cognitive trajectories of the 8 ATN groups
Figure 2. Estimates of longitudinal change in cognition for the 8 ATN profile groups.
Estimates from linear growth curve models predicting cognitive factor scores (A and B) and MMSE scores (C and D) over time among individuals classified into the 8 ATN profile groups using baseline CSF β-amyloid 1–42 as a measure of amyloid, CSF phosphorylated tau 181 as a measure of tau, and CSF total tau as a measure of neurodegeneration. The estimates are adjusted for baseline age, sex, education, and the age × time interaction, and the timescale was years since baseline (A and C) or chronological age (B and D). Only the A+T+N+ group (solid black line) consistently showed greater decline than the biomarker-negative (A−T−N−) group (solid orange line). ATN = amyloid/tau/neurodegeneration; MMSE = Mini-Mental State Examination.
Similarly, for the MMSE, only the group positive for all biomarkers (A+/T+/N+) demonstrated greater cognitive decline compared to the reference group (p = 0.014 and p = 0.007 using years since baseline and age as the timescale, respectively; see figure 2, C and D). In addition, the group positive for Aβ1–42 and tau but not neurodegeneration (A+/T+/N−) had a more positive MMSE trajectory (p = 0.003) than the biomarker-negative group (A−/T−/N−) using years since baseline as the timescale. None of the other groups showed reliable differences in the rate of change of the MMSE or the cognitive factor score relative to the reference group. When more stringent cut points were used to define the groups (e.g., quartiles), again only the A+T+N+ group showed more negative cognitive trajectories than the biomarker-negative group (A−T−N−) (data available from Dryad, tables e-5 and e-6 and figure e-2, doi.org/10.5061/dryad.88br3tn).
Discussion
This study investigated longitudinal cognitive trajectories among 814 primarily middle-aged individuals with normal cognition and different CSF biomarker profiles at baseline by pooling data across 4 independent cohorts. The large sample size of the current study and the 7-year follow-up period allowed us to examine the long-term cognitive trajectories of individuals in the 8 ATN biomarker groups.10 Using different cut points and model formulations, we found that only the group with abnormal levels of amyloid, tau, and neurodegeneration (A+T+N+), as assessed by CSF Aβ1–42, p-tau181, and t-tau, respectively, showed consistently greater cognitive decline than the group with normal biomarker levels (A−T−N−). This may suggest that abnormality in all 3 biomarkers is necessary for observing accelerated cognitive decline during preclinical AD. However, we cannot rule out the possibility that we were unable to detect real differences between A+ groups discordant for T and N because of insufficient power. In addition, replicating results from prior studies that examined the 2011 NIA-AA/SNAP schema, we found that, relative to individuals with normal CSF levels of amyloid, p-tau181, and t-tau (stage 0), only those with abnormal levels of both amyloid and p-tau181 or t-tau (i.e., stage 2) showed greater cognitive decline over time.3–9 These results are consistent with the hypothesis that the presence of both elevated brain amyloid and neurofibrillary tangles is necessary for acceleration in neurodegeneration,29,30 which in turn leads to cognitive decline.31
It is also possible that some degree of cognitive decline observed among the A+T+N+ group stems from neurodegeneration due to non-AD related causes, including cerebrovascular disease. However, given the cohort's relatively young age, strong family history of AD, and high proportion of APOE ε4 carriers, we hypothesize that much of the elevation in t-tau reflects AD-related processes. More broadly, it seems unlikely that non-AD neurodegenerative processes are major contributors to cognitive decline in this study because none of the other N+ groups showed accelerated cognitive decline. Disentangling the relative contributions of different sources of neurodegeneration in general, and among the A+T+N+ group more specifically, is an important avenue for future research.
According to both biomarker schemas, the A+ groups are thought to represent different stages of the AD pathophysiologic cascade, beginning with the accumulation of amyloid (A+T−N−), followed by the deposition of tau (A+T+N−) and subsequent neurodegeneration (A+T+N+), which eventually leads to cognitive decline. The finding that cognitive decline in the current study was most prominent among individuals with abnormalities in all 3 classes of biomarkers is consistent with this hypothesized sequence of events. However, the sample sizes of the A+ groups discordant for T and N were too small (approximately 10–20, depending on the cut point) to reliably differentiate their cognitive trajectories from that of the A+T+N+ group (due to the high correlation between CSF p-tau181 and t-tau). Consequently, we cannot rule out the possibility that the presence of high amyloid and either tau or neurodegeneration are sufficient to cause accelerated cognitive decline, as might be expected based on the finding that the stage 2 group (which requires abnormality in only N or T) showed accelerated cognitive decline. Consistent with this possibility, the mean slopes of the cognitive trajectories of the A+T+N− and A+T−N+ groups often approached that of the A+T+N+ group (figure 2 and data available from Dryad, figure e-2, doi.org/10.5061/dryad.88br3tn). It is also possible, however, that the cognitive decline among individuals in the stage 2 group in this, as well as in prior studies, was primarily driven by individuals with abnormality in both T and N because only one of these biomarkers was measured and statistically controlled. The more positive trajectory of the A + T+N− group relative to the biomarker-negative (A−T−N−) group for the MMSE when using years since baseline as the timescale likely presents a false-positive finding related to the small sample size of the group. This is supported by the fact that this group did not differ from (and tended to be more negative relative to) the A−T−N− group, when using age as the timescale or other cut points (data available from Dryad, tables e-5 and e-6, doi.org/10.5061/dryad.88br3tn).
In light of the low frequency of A+ individuals who are discordant for T and N as measured by CSF p-tau181 and t-tau, our findings further suggest that it may not be possible or practical to differentiate the cognitive trajectories of cognitively normal individuals with these CSF profiles. Future studies are needed to examine whether other CSF markers of neurodegeneration, such as VILIP-1, neurogranin, neurofilament light chain, or neuronal pentraxin 2,32–34 add discriminating power, above and beyond the standard CSF biomarkers, facilitating differentiation among the ATN profile groups. More broadly, the finding that in a cohort of 814 individuals, we were able to reliably differentiate the cognitive trajectories of only 2 groups (A−T−N− vs A+T+N+) may further suggest that in a preclinical, largely middle-aged cohort, the ATN staging system may not be sensitive to differences in risk of cognitive decline.
In addition, it has been hypothesized that the A−T−N+ profile is associated with non-AD neurodegenerative conditions, such as TDP-43 (TAR DNA-binding protein 43), hippocampal sclerosis, or cerebrovascular disease, while the A−T+N− profile may represent primary age-related tauopathy, and the A−T+N+ profile a combination of both.12 Although the current results do not directly address these hypotheses, they do suggest that in the absence of amyloid, the levels of tau and neurodegeneration present in middle age are not sufficient to cause accelerated cognitive decline. Different findings might be obtained for older cohorts, who tend to harbor higher levels of tau and neurodegeneration.
The results from the current study have implications for the practical implementation of the ATN research framework as proposed by the NIA-AA 2018 workgroup.11 First, these findings suggest that very large sample sizes will be needed to assess this framework, since even with 814 participants, some of the subgroups were extremely small, and thereby had limited power. Second, these data suggest that the AD biomarkers examined in this study (CSF Aβ1–42, p-tau, and t-tau) did not incrementally improve the ability to predict future cognitive outcomes among initially cognitively unimpaired, late-middle-aged individuals. The new framework makes the implicit assumption that each added biomarker will incrementally add predictive power, whereas it may be the case that only certain types of biomarkers add orthogonal information. Moreover, it seems likely that the added value of a biomarker may depend on the characteristics of the participants being studied. For example, evidence suggests that among the oldest old, the vascular (V) biomarker category may be particularly important.35 For a theoretical critique of the ATN framework, see reference 36.
Our results showed no baseline differences in MMSE scores among individuals in the 2011 NIA-AA/SNAP or ATN groups, likely reflecting ceiling effects among these cognitively normal individuals.37,38 However, participants in NIA-AA stage 2 and the A+T+N+ group tended to score lower on the global cognitive factor score at baseline. These results confirm that the level of cognitive impairment among those in NIA-AA stage 2 and the A+T+N+ group may be quite subtle and primarily detectable with sensitive tests, such as composite scores that assess multiple cognitive domains. Our results are consistent with our previous finding that lower baseline cognitive factor scores, as calculated in this study, are associated with elevated risk of progression to mild cognitive impairment 5 years later.13 It will be important for future studies to determine which cognitive measures show the greatest difference between the biomarker-positive (stage 2, A+T+N+) and biomarker-negative (stage 0, A−T−N−) groups, since they might be useful for initial screening of participants most likely to harbor both amyloid and tau pathology for AD clinical trials.
The interlaboratory variability in CSF measurements of AD biomarkers23 necessitated the use of cohort-specific cut points for classifying individuals as biomarker positive or negative. This could have resulted in an over- and/or underestimation of biomarker-positive individuals within cohorts, depending on whether overall pathology levels differed across cohorts. In this study, it is unlikely that this represents a large bias because individuals in all cohorts were cognitively normal at baseline, were enriched for a family history of AD, and with the exception of the AIBL cohort, had a similar baseline age (mid to late 50s in all cohorts, with AIBL baseline age = 68.8). This suggests that levels of baseline pathology are likely very similar across cohorts, in which case any bias associated with using cohort-specific biomarker cutoffs would likely be relatively minor.
Our study has several limitations. First, participants in all cohorts were primarily of white race, well-educated, middle-aged at baseline, and females were overrepresented. Therefore, the results may not generalize to the broader population and to older cohorts. However, we also note that because the preclinical phase of AD can precede the symptomatic phase by a decade or more,1 studies among middle-aged individuals are vital for understanding the earliest phases of AD and for identifying individuals at greatest risk of future cognitive decline, who would be most likely to benefit from interventions. Second, most participants had a family history of AD-dementia, which may make it more likely that cognitive decline is due to AD pathology rather than other pathologies. While this may be beneficial for testing the new AD-biomarker framework, it may influence cognitive performance and biomarker profiles in ways that cannot be fully understood. To address this issue, larger studies are needed that could subdivide individuals in each biomarker profile group into those with and without a family history of dementia. Third, we did not use clinically validated cut points to classify individuals into 2011 NIA-AA/SNAP stages or ATN profile groups and usage of cohort-specific cut points might bias the results if distributions of AD pathology are different across the cohorts. Future studies are needed to determine whether results differ across cognitive domains and whether similar findings would be obtained using clinically validated CSF cut points or imaging biomarker measures of amyloid, tau, and neurodegeneration. With the recently obtained NIH funding for the Preclinical AD Consortium, we are now in a position to address these and related questions.
Acknowledgment
The authors gratefully acknowledge the participants and staff from each study for their contributions to the research program.
Glossary
- AA
Alzheimer's Association
- Aβ1–42
β-amyloid 1–42
- ACS
Adult Children Study
- AD
Alzheimer disease
- AIBL
Australian Imaging, Biomarker, and Lifestyle
- ATN
amyloid/tau/neurodegeneration
- BIOCARD
Biomarkers of Cognitive Decline Among Normal Individuals
- IMPACT
Investigating Memory in Preclinical AD—Causes and Treatment
- MMSE
Mini-Mental State Examination
- NIA
National Institute on Aging
- p-tau
phosphorylated tau
- SNAP
suspected non–Alzheimer disease pathophysiology
- t-tau
total tau
- WRAP
Wisconsin Registry for Alzheimer's Prevention
Footnotes
Editorial, page 643
Author contributions
Drafting/revising the manuscript for content: all authors. Study concept or design: A. Soldan, C. Pettigrew, M. Albert, and A.L. Gross. Analysis or interpretation of data: all authors. Statistical analysis: A.L. Gross. Contribution of vital reagents/tools/patents: A.M. Fagan, S.E. Schindler, A. Moghekar, C. Fowler, and C. Carlsson. Study supervision or coordination: C.L. Masters, S. Johnson, J.C. Morris, M. Albert.
Study funding
The Preclinical AD Consortium is supported by the Alzheimer's Association and Fidelity Biosciences. The individual studies in the consortium are funded, in part, by the following grants: U19-AG03365, P01-AG026276, R01-AG027161, and the Australian Commonwealth Scientific Industrial Research Organization (CSIRO). Dr. Gross is supported by K01-AG050699 from the National Institute on Aging.
Disclosure
A. Soldan and C. Pettigrew report no disclosures relevant to the manuscript. A. Fagan is an advisor to Roche Diagnostics, DiamiR LLC, Araclon/Grifols, Genentech, and Biogen. S. Schindler, A. Moghekar, C. Fowler, Q. Li, S. Collins, C. Carlsson, and S. Asthana report no disclosures relevant to the manuscript. C. Masters is an advisor to Eli Lilly. S. Johnson has served as an advisor to Roche Diagnostics. J. Morris reports no disclosures relevant to the manuscript. M. Albert is an advisor to Eli Lilly. A. Gross reports no disclosures relevant to the manuscript. Go to Neurology.org/N for full disclosures.
References
- 1.Sperling RA, Aisen PS, Beckett LA, et al. Toward defining the preclinical stages of Alzheimer's disease: recommendations from the National Institute on Aging–Alzheimer's Association workgroups on diagnostic guidelines for Alzheimer's disease. Alzheimers Dement 2011;7:280–292. [DOI] [PMC free article] [PubMed] [Google Scholar]
- 2.Jack CR Jr, Knopman DS, Weigand SD, et al. An operational approach to National Institute on Aging–Alzheimer's Association criteria for preclinical Alzheimer disease. Ann Neurol 2012;71:765–775. [DOI] [PMC free article] [PubMed] [Google Scholar]
- 3.Burnham SC, Bourgeat P, Doré V, et al. Clinical and cognitive trajectories in cognitively healthy elderly individuals with suspected non-Alzheimer's disease pathophysiology (SNAP) or Alzheimer's disease pathology: a longitudinal study. Lancet Neurol 2016;15:1044–1053. [DOI] [PubMed] [Google Scholar]
- 4.Knopman DS, Jack CR Jr, Wiste HJ, et al. Short-term clinical outcomes for stages of NIA-AA preclinical Alzheimer disease. Neurology 2012;78:1576–1582. [DOI] [PMC free article] [PubMed] [Google Scholar]
- 5.Mormino EC, Betensky RA, Hedden T, et al. Synergistic effect of beta-amyloid and neurodegeneration on cognitive decline in clinically normal individuals. JAMA Neurol 2014;71:1379–1385. [DOI] [PMC free article] [PubMed] [Google Scholar]
- 6.Soldan A, Pettigrew C, Cai Q, et al. Hypothetical preclinical Alzheimer disease groups and longitudinal cognitive change. JAMA Neurol 2016;73:698–705. [DOI] [PMC free article] [PubMed] [Google Scholar]
- 7.Vos SJ, Xiong C, Visser PJ, et al. Preclinical Alzheimer's disease and its outcome: a longitudinal cohort study. Lancet Neurol 2013;12:957–965. [DOI] [PMC free article] [PubMed] [Google Scholar]
- 8.Vos SJB, Gordon BA, Su Y, et al. NIA-AA staging of preclinical Alzheimer disease: discordance and concordance of CSF and imaging biomarkers. Neurobiol Aging 2016;44:1–8. [DOI] [PMC free article] [PubMed] [Google Scholar]
- 9.Mormino EC, Papp KV, Rentz DM, et al. Heterogeneity in suspected non-Alzheimer disease pathophysiology among clinically normal older individuals. JAMA Neurol 2016;73:1185–1191. [DOI] [PMC free article] [PubMed] [Google Scholar]
- 10.Jack CR Jr, Bennett DA, Blennow K, et al. A/T/N: an unbiased descriptive classification scheme for Alzheimer disease biomarkers. Neurology 2016;87:539–547. [DOI] [PMC free article] [PubMed] [Google Scholar]
- 11.Jack CR Jr, Bennett DA, Blennow K, et al. NIA-AA research framework: toward a biological definition of Alzheimer's disease. Alzheimers Dement 2018;14:535–562. [DOI] [PMC free article] [PubMed] [Google Scholar]
- 12.Jack CR Jr, Wiste HJ, Weigand SD, et al. Age-specific and sex-specific prevalence of cerebral beta-amyloidosis, tauopathy, and neurodegeneration in cognitively unimpaired individuals aged 50–95 years: a cross-sectional study. Lancet Neurol 2017;16:435–444. [DOI] [PMC free article] [PubMed] [Google Scholar]
- 13.Gross AL, Hassenstab JJ, Johnson SC, et al. A classification algorithm for predicting progression from normal cognition to mild cognitive impairment across five cohorts: the preclinical AD consortium. Alzheimers Dement 2017;8:147–155. [DOI] [PMC free article] [PubMed] [Google Scholar]
- 14.Coats M, Morris JC. Antecedent biomarkers of Alzheimer's disease: the adult children study. J Geriatr Psychiatry Neurol 2005;18:242–244. [DOI] [PubMed] [Google Scholar]
- 15.Ellis KA, Bush AI, Darby D, et al. The Australian Imaging, Biomarkers and Lifestyle (AIBL) study of aging: methodology and baseline characteristics of 1112 individuals recruited for a longitudinal study of Alzheimer's disease. Int Psychogeriatr 2009;21:672–687. [DOI] [PubMed] [Google Scholar]
- 16.Albert M, Soldan A, Gottesman R, et al. Cognitive changes preceding clinical symptom onset of mild cognitive impairment and relationship to ApoE genotype. Curr Alzheimer Res 2014;11:773–784. [DOI] [PMC free article] [PubMed] [Google Scholar]
- 17.Johnson SC, Koscik RL, Jonaitis EM, et al. The Wisconsin Registry for Alzheimer's Prevention: a review of findings and current directions. Alzheimers Dement 2018;10:130–142. [DOI] [PMC free article] [PubMed] [Google Scholar]
- 18.Sutphen CL, Jasielec MS, Shah AR, et al. Longitudinal cerebrospinal fluid biomarker changes in preclinical Alzheimer disease during middle age. JAMA Neurol 2015;72:1029–1042. [DOI] [PMC free article] [PubMed] [Google Scholar]
- 19.Li QX, Villemagne VL, Doecke JD, et al. Alzheimer's disease normative cerebrospinal fluid biomarkers validated in PET amyloid-beta characterized subjects from the Australian Imaging, Biomarkers and Lifestyle (AIBL) study. J Alzheimers Dis 2015;48:175–187. [DOI] [PubMed] [Google Scholar]
- 20.Moghekar A, Li S, Lu Y, et al. CSF biomarker changes precede symptom onset of mild cognitive impairment. Neurology 2013;81:1753–1758. [DOI] [PMC free article] [PubMed] [Google Scholar]
- 21.Olsson A, Vanderstichele H, Andreasen N, et al. Simultaneous measurement of beta-amyloid(1–42), total tau, and phosphorylated tau (Thr181) in cerebrospinal fluid by the xMAP technology. Clin Chem 2005;51:336–345. [DOI] [PubMed] [Google Scholar]
- 22.Mattsson N, Andreasson U, Persson S, et al. CSF biomarker variability in the Alzheimer's Association quality control program. Alzheimers Dement 2013;9:251–261. [DOI] [PMC free article] [PubMed] [Google Scholar]
- 23.Gross AL, Sherva R, Mukherjee S, et al. Calibrating longitudinal cognition in Alzheimer's disease across diverse test batteries and datasets. Neuroepidemiology 2014;43:194–205. [DOI] [PMC free article] [PubMed] [Google Scholar]
- 24.McDonald R. Test Theory: A Unified Treatment. Mahwah, NJ: Lawrence Erlbaum Associates; 1999. [Google Scholar]
- 25.Bollen DA. Structural Equations with Latent Variables. New York: Wiley-Interscience; 1989. [Google Scholar]
- 26.Muthén LK, Muthén BO. Mplus User's Guide, 7th ed. Los Angeles: Muthén & Muthén; 1998–2012. [Google Scholar]
- 27.Hoffman L. Considering alternative metrics of time. In: Harring JR, Hancock GR, editors. Advances in Longitudinal Methods in the Social and Behavioral Sciences. Charlotte, NC: Information Age Publishing; 2012:255–287. [Google Scholar]
- 28.Corder EH, Saunders AM, Strittmatter WJ, et al. Gene dose of apolipoprotein E type 4 allele and the risk of Alzheimer's disease in late onset families. Science 1993;261:921–923. [DOI] [PubMed] [Google Scholar]
- 29.Desikan RS, McEvoy LK, Thompson WK, et al. Amyloid-beta associated volume loss occurs only in the presence of phospho-tau. Ann Neurol 2011;70:657–661. [DOI] [PMC free article] [PubMed] [Google Scholar]
- 30.Pettigrew C, Soldan A, Sloane K, et al. Progressive medial temporal lobe atrophy during preclinical Alzheimer's disease. Neuroimage Clin 2017;16:439–446. [DOI] [PMC free article] [PubMed] [Google Scholar]
- 31.Jack CR Jr, Knopman DS, Jagust WJ, et al. Tracking pathophysiological processes in Alzheimer's disease: an updated hypothetical model of dynamic biomarkers. Lancet Neurol 2013;12:207–216. [DOI] [PMC free article] [PubMed] [Google Scholar]
- 32.Mattsson N, Insel PS, Palmqvist S, et al. Cerebrospinal fluid tau, neurogranin, and neurofilament light in Alzheimer's disease. EMBO Mol Med 2016;8:1184–1196. [DOI] [PMC free article] [PubMed] [Google Scholar]
- 33.Xiao MF, Xu D, Craig MT, et al. NPTX2 and cognitive dysfunction in Alzheimer's disease. Elife 2017;6:e23798. [DOI] [PMC free article] [PubMed] [Google Scholar]
- 34.Tarawneh R, D'Angelo G, Macy E, et al. Visinin-like protein-1: diagnostic and prognostic biomarker in Alzheimer disease. Ann Neurol 2011;70:274–285. [DOI] [PMC free article] [PubMed] [Google Scholar]
- 35.Toledo JB, Arnold SE, Raible K, et al. Contribution of cerebrovascular disease in autopsy confirmed neurodegenerative disease cases in the National Alzheimer's Coordinating Centre. Brain 2013;136(pt 9):2697–2706. [DOI] [PMC free article] [PubMed] [Google Scholar]
- 36.Glymour MM, Brickman AM, Kivimaki M, et al. Will biomarker-based diagnosis of Alzheimer's disease maximize scientific progress? Evaluating proposed diagnostic criteria. Eur J Epidemiol 2018;33:607–612. [DOI] [PMC free article] [PubMed] [Google Scholar]
- 37.Nasreddine ZS, Phillips NA, Bédirian V, et al. The Montreal Cognitive Assessment, MoCA: a brief screening tool for mild cognitive impairment. J Am Geriatr Soc 2005;53:695–699. [DOI] [PubMed] [Google Scholar]
- 38.Lonie JA, Tierney KM, Ebmeier KP. Screening for mild cognitive impairment: a systematic review. Int J Geriatr Psychiatry 2009;24:902–915. [DOI] [PubMed] [Google Scholar]
Associated Data
This section collects any data citations, data availability statements, or supplementary materials included in this article.
Data Availability Statement
Anonymized study data for the primary analyses presented in this report are available on request from any qualified investigator for purposes of replicating the results.


