Abstract
Amyloid-β (Aβ) plays a key role in the pathogenesis of Alzheimer disease (AD) and can be imaged in vivo using 18F-florbetapir PET. A composite SUV ratio (SUVr) is a commonly used outcome measure for quantifying the global Aβ burden; however, sensitivity is suboptimal and can lead to low power in clinical trials. We introduce amyloid load, AβL, as a novel biomarker to quantify the global Aβ burden along with an automated algorithm for its calculation (AmyloidIQ). AβL is evaluated on cross-sectional and longitudinal data obtained from the Alzheimer’s Disease Neuroimaging Initiative. The cross-sectional data consisted of 769 subjects across the disease spectrum (211 healthy controls, 223 patients with early mild cognitive impairment, 204 with late mild cognitive impairment, and 132 with AD). The distributions of AβL in the 4 different classifications were compared, and the same analyses were applied to a composite SUVr outcome measure. The effect sizes (Hedges g) between all but one classification were higher for AβL than for composite SUVr, with the mean difference being 46%. Of the patients with early mild cognitive impairment, 147 had a 2-y follow-up scan, and the effect size between baseline and follow-up for AβL was 0.49, compared with 0.36 for a composite SUVr, demonstrating an equivalent increase in power for longitudinal data. These results offer evidence that AβL will be a valuable outcome measure in future Aβ imaging studies, providing a substantial increase in power over currently used SUVr methods.
Keywords: neurology, PET, Alzheimer disease, amyloid, florbetapir, mathematic modeling
Neuritic plaques are one of the two pathologic hallmarks of Alzheimer disease (AD), and the major constituent of these plaques is amyloid-β (Aβ) (1–3). Evidence suggests that Aβ plays a key role in the pathogenesis of the disease (4–6).
The in vivo Aβ concentration can be quantified in humans with static PET imaging using the radioligand 18F-florbetapir. A composite SUV ratio (SUVr) with a gray matter cerebellum reference region is a commonly used outcome measure for assessing the global Aβ burden from static images. It can be calculated from a static 18F-florbetapir image by dividing the mean intensity of voxels in an Aβ-specific target region that includes most of the cortex by the mean intensity of voxels in the gray matter cerebellum, when these 2 regions of interest have been defined using a combination of gray matter probability and an anatomic atlas.
Large cross-sectional, longitudinal studies have been performed with composite SUVr as the primary outcome measure (7–9) to better understand the Aβ accumulation in AD. Although the cross-sectional studies have shown increases in composite SUVr in AD subjects when compared with healthy controls (HCs) (7,10), the longitudinal results show high variability (11,12) between baseline and follow-up. High variability in the outcome measure results in low power to detect biologic differences in the Aβ concentration. Consequently, it has been argued that only dynamic images should be used for quantitative imaging studies (13), but this is less cost-effective and puts more stress on patients. A more sensitive outcome measure from static 18F-florbetapir PET images that quantifies the global Aβ burden could reduce variability and therefore increase the probability of detecting real biologic effects.
In this work, we introduce a novel sensitive biomarker, AβL, for quantifying the global Aβ burden from static 18F-florbetapir PET images. It is calculated using 2 previously derived canonic images for the nonspecific binding of 18F-florbetapir and the Aβ carrying capacity (14). AβL is calculated using the fully automated AmyloidIQ algorithm on both cross-sectional and longitudinal data from the Alzheimer’s Disease Neuroimaging Initiative (ADNI), and the results from AβL are compared with those from composite SUVr.
MATERIALS AND METHODS
Imaging Data
Cross-Sectional Data
18F-florbetapir human Aβ PET imaging data and structural MRI data were obtained from the ADNI database (15) (http://adni.loni.usc.edu/) for 779 subjects (211 HCs, 223 patients with early mild cognitive impairment [EMCI], 204 with late mild cognitive impairment [LMCI], and 132 with AD).
Longitudinal Data
In addition to the cross-sectional data, 2-y follow-up (mean, 1.96 ± 0.12 y) scans for 147 subjects were downloaded.
The ADNI was launched in 2003 as a public–private partnership, led by Principal Investigator Michael W. Weiner. The primary goal of the ADNI has been to test whether serial MRI, PET, tests of other biologic markers, and clinical and neuropsychological assessments can be combined to measure the progression of mild cognitive impairment and early AD. Up-to-date information can be found at www.adni-info.org.
18F-Florbetapir Human Aβ PET Imaging Data
18F-florbetapir PET scans consisted of a 20-min 18F-florbetapir PET scan (370 ± 37 MBq) 50 min after injection according to the standardized ADNI protocol (7). Three image preprocessing steps were applied to the data before entry into the ADNI imaging database (full details can be found at http://adni.loni.usc.edu/methods/pet-analysis/preprocessing). Briefly, 4 late-time 5-min frames are coregistered and averaged. The resulting image is converted to a 160 × 160 × 96 voxel static image with voxel dimension of 1.5 × 1.5 × 1.5 mm. Finally, a gaussian filter of 8 mm in full width at half maximum was applied (corresponding to the lowest-resolution scanner used in the study). These primary data were downloaded from the ADNI database and used in the subsequent analyses.
T1-Weighted MRI Data
All subjects underwent T1-weighted 1.5-T structural MRI, the images of which were downloaded from the ADNI imaging database.
Image Processing
Registration of Images into Stereotactic Space
18F-florbetapir data were nonlinearly registered into Montreal Neurologic Institute 152 space (MNI152 space (16)) using a diffeomorphic nonlinear registration (DARTEL toolbox) (17). Initially, the structural MR images were segmented into gray matter and white matter using SPM12 and registered to a group average template. The group average template was then registered to MNI152 space. Each 18F-florbetapir SUVr image was registered to its corresponding MR image using a rigid-body registration. Finally, the individual’s DARTEL flow field and template transformation was applied without modulation, resulting in 18F-florbetapir images in MNI152 space. The normalized maps were spatially smoothed (gaussian kernel of 8 mm in full width at half maximum). Each registration was visually assessed to check the quality of the registration. Ten subjects were rejected, resulting in a cross-sectional dataset that included 769 subjects and a longitudinal dataset that included 147 subjects.
Generation of SUVr Images
SUVr images for all scans were generated using the gray matter cerebellum as the reference region, which was defined as the intersection of voxels that are in the cerebellum region of interest of the CIC atlas (18) and voxels that have a gray matter tissue probability of greater than 0.3. The mean uptake value for the gray matter cerebellum region of interest was obtained, and image intensities were divided by this value to generate an SUVr image for each subject.
Definition of AβL
On the basis of our prior spatiotemporal modeling work (14), we hypothesized that an 18F-florbetapir SUVr (gray matter cerebellum reference) image, spatially normalized into MNI152 space, could be effectively modeled using a linear combination of previously derived canonic images for the nonspecific binding NS and carrying capacity K (19). Therefore,
| Eq. 1 |
where, SUVrfit is the modeled image, NS is the nonspecific binding image, K is the carrying capacity image, ns is the nonspecific binding coefficient, and AβL is the amyloid load. Because the carrying capacity image is the one relating to Aβ concentration, it was further hypothesized that the AβL would be a sensitive biomarker to quantify the global Aβ burden ranging from 0% in the case of a healthy brain up to 100% in the case of a brain with the highest level of amyloid.
AmyloidIQ Algorithm for Calculating AβL
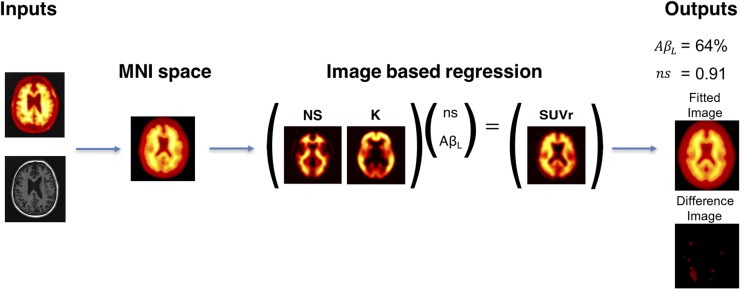
After spatially normalizing the 18F-florbetapir SUVr images, a fully automated algorithm was used to calculate SUVrfit, ns, and AβL for each image. Values for ns and AβL were optimized by minimizing the sum of squares of residuals between the voxel intensities of the spatially normalized 18F-florbetapir SUVr image and the SUVrfit image. This was achieved by forming the overdetermined system of linear equations shown in Equation 2 and solving for ns and AβL. Equation 2 was optimized in MATLAB using QR decomposition:
| Eq. 2 |
where NSi, Ki, and SUVri are the ith voxel intensities in the NS image, K image, and 18F-florbetapir SUVr image in MNI space, respectively.
The algorithm produces 4 outputs as summarized in Figure 1. The parameter values ns and AβL are estimated along with the fitted image (SUVrfit) and the residual difference (SUVr − SUVrfit).
FIGURE 1.
AmyloidIQ algorithm for calculating AβL from single SUVr image with cerebellar gray matter used as reference region.
Comparison of AβL with Composite SUVr
In both the cross-sectional and the longitudinal studies, AβL was compared with composite SUVr as an outcome measure to quantify the Aβ burden.
A composite SUVr was defined to be the mean SUVr from gray matter voxels (those with values greater than 0.3 in the gray matter probability map) in 4 large cortical regions (frontal lobe excluding sensory motor area and precentral gyrus, cingulate cortex, parietal lobe, and temporal lobe) taken from the CIC atlas (18).
In the cross-sectional study, the effect sizes (Hedges g) were calculated between each of the different clinical groups for both AβL and composite SUVr. For the longitudinal study, an effect size (again Hedges g) was calculated for the change at follow-up from baseline for both AβL and composite SUVr.
RESULTS
Calculation of AβL
AβL was successfully calculated for all 769 subjects. The algorithm was completed for each subject in under 1 min on a standard workstation after the PET images had been spatially normalized to MNI space (where the canonic images K and NS had been generated previously).
Evaluation of SUVrfit Images
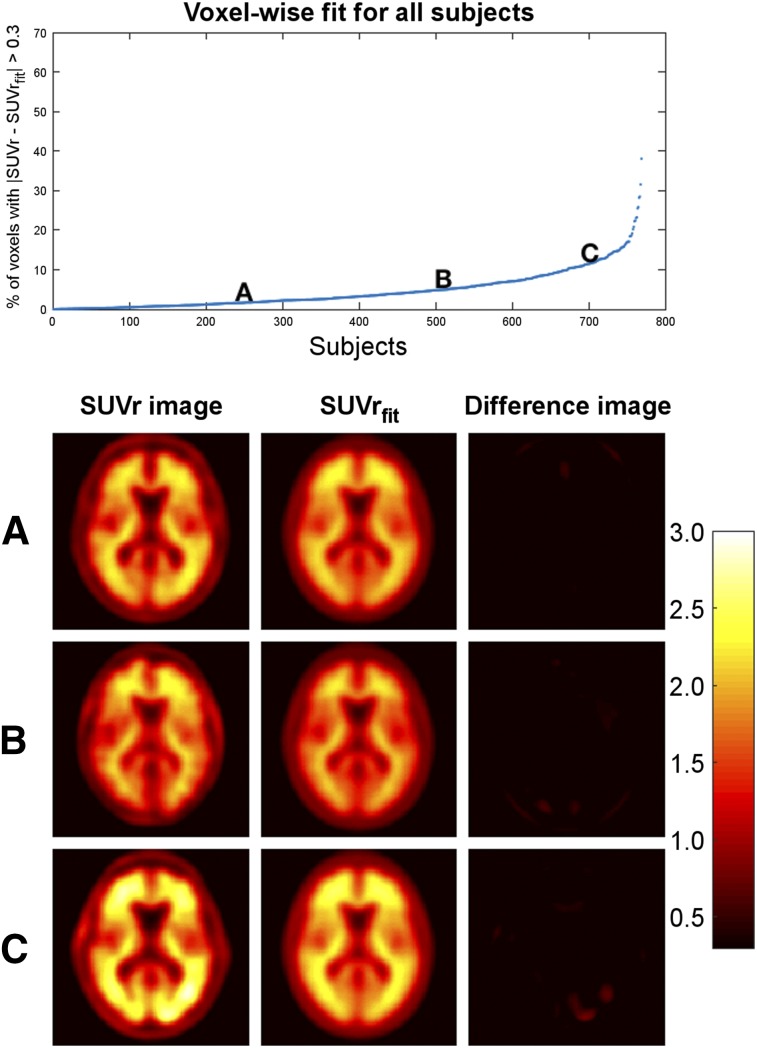
The quality of the fit for SUVrfit was assessed by evaluating the percentage voxels in the brain that satisfied (Fig. 2). The larger this percentage, the poorer the fit. The mean percentage of voxels in the brain with across all 769 subjects was 4.6%. Of the 769 subjects, 96% had fewer than 20% of voxels that satisfied , meaning that over 80% of voxels in 96% of subjects were well modeled. The highest percentage in all subjects was 38.0%. There was no correlation between the calculated AβL and the percentage of voxels that satisfied . Example fittings for images with high, medium, and low AβL scores can be seen in Supplemental Figure 1 (supplemental materials are available at http://jnm.snmjournals.org).
FIGURE 2.
Evaluation of fit of SUVrfit images. (Top) Percentage of voxels in brain with for each subject. (Bottom) SUVr image, SUVrfit image, and difference image for 3 example subjects (A–C). SUVrfit image accurately fits SUVr image in all 3 examples.
AβL and Composite SUVr in Cross-Sectional ADNI Data
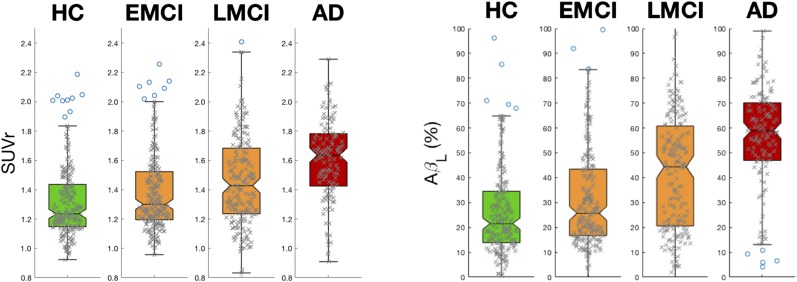
The distributions of AβL in the 4 different ADNI classifications (HC, EMCI, LMCI, and AD) were calculated and compared with analogous distributions for the composite SUVr. Box plots for each of the distributions are presented in Figure 3. The effect sizes among the different groups for composite SUVr and AβL are shown in Tables 1 and 2, respectively. Both composite SUVr and AβL increase as the level of cognition declines in the ADNI population, but AβL has greater sensitivity between all classification groups apart from EMCI to HC, for which the 2 measures were equivalent. The mean increase in effect size when comparing AβL with composite SUVr was 46%, and the greatest increase was observed between LMCI and EMCI, which increased by 106%.
FIGURE 3.
Box plots for composite SUVr (left) and AβL (right) for each of 4 diagnosis groups in cross-sectional data. Effect sizes calculated among all groups are larger for AβL than for composite SUVr, apart from EMCI to HC, for which outcome measures are equivalent (Tables 1 and 2).
TABLE 1.
Effect Sizes for Composite SUVr
| Parameter | EMCI | LMCI | AD |
| Effect size vs. HC | 0.24 | 0.48 | 1.06 |
| Effect size vs. EMCI | 0.26 | 0.81 | |
| Effect size vs. LMCI | 0.50 |
TABLE 2.
Effect Sizes for AβL
| Parameter | EMCI | LMCI | AD |
| Effect size vs. HC | 0.24 | 0.71 | 1.51 |
| Effect size vs. EMCI | 0.49 | 1.24 | |
| Effect size vs. LMCI | 0.64 |
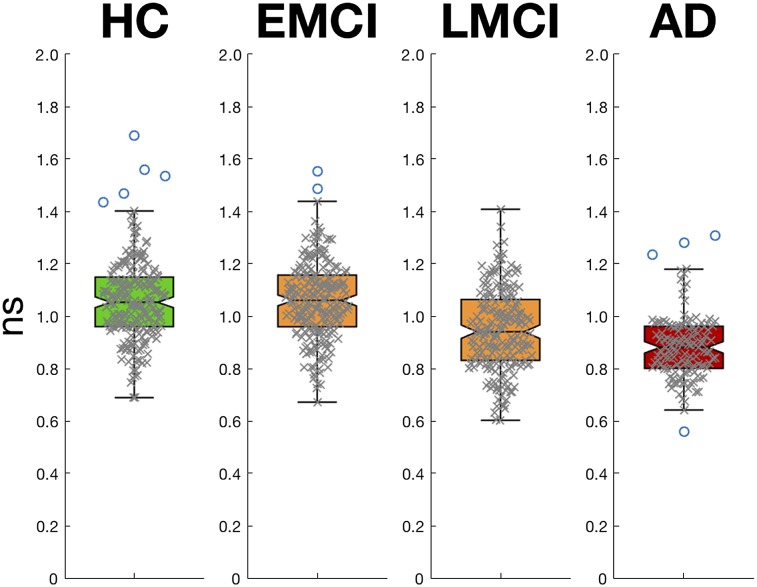
The mean calculated ns for HC was 1.06. There was a 17% reduction in the mean calculated ns for AD when compared with HC and a 10% reduction between LMCI and HC but no difference between EMCI and HC. Box plots for the distributions of ns can be seen in Figure 4.
FIGURE 4.
Box plots showing distributions of ns for each of 4 diagnosis groups in cross-sectional data. ns is statistically lower in AD and LMCI groups when compared with HCs but same in EMCI group.
AβL and Composite SUVr in Longitudinal ADNI Data
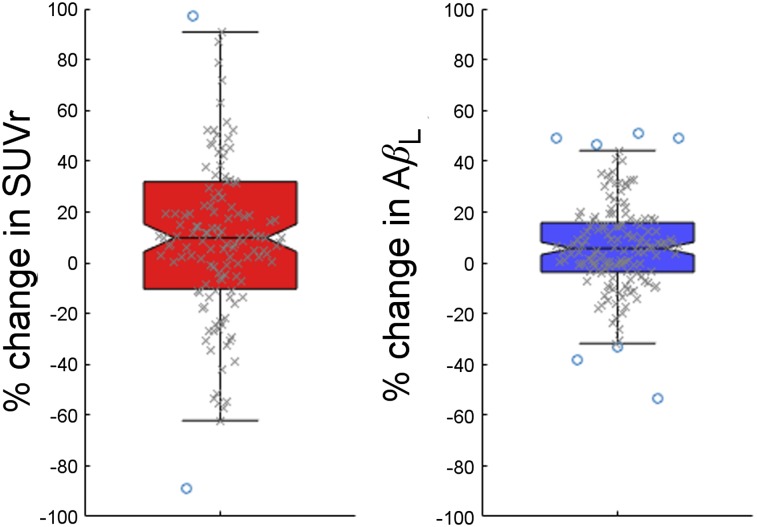
Change in AβL (baseline AβL subtracted from follow-up AβL) and change in composite SUVr (baseline composite SUVr subtracted from follow-up composite SUVr) were calculated for each of the 147 subjects who had repeated 18F-florbetapir. The distributions of change in AβL and change in composite SUVr are shown in Figure 5. The increase in follow-up mean composite SUVr was 0.030 compared with baseline, with an SD of 0.12, which translates to an effect size of 0.36. The increase in follow-up AβL compared with baseline was 2.0% and the SD was 5.8%, which translates to an effect size for change in AβL of 0.49. This increase in effect size shows an increased sensitivity. There was no difference in the calculated ns between baseline and follow-up (P > 0.8).
FIGURE 5.
Box plots showing distributions of percentage change in composite SUVr (left) and in AβL (right). A larger effect is seen with AβL.
DISCUSSION
We have introduced the novel sensitive biomarker AβL to quantify the Aβ burden in the human brain using data from a static PET 18F-florbetapir scan. AβL is calculated by modeling an SUVr image as a linear combination of 2 canonic images: K and NS. Subsequently, AβL can be extracted simply as the scaling factor of the carrying capacity canonic image K. In addition to defining the biomarker, we have presented an automated algorithm for calculating AβL, AmyloidIQ, which is fast and robust to execute.
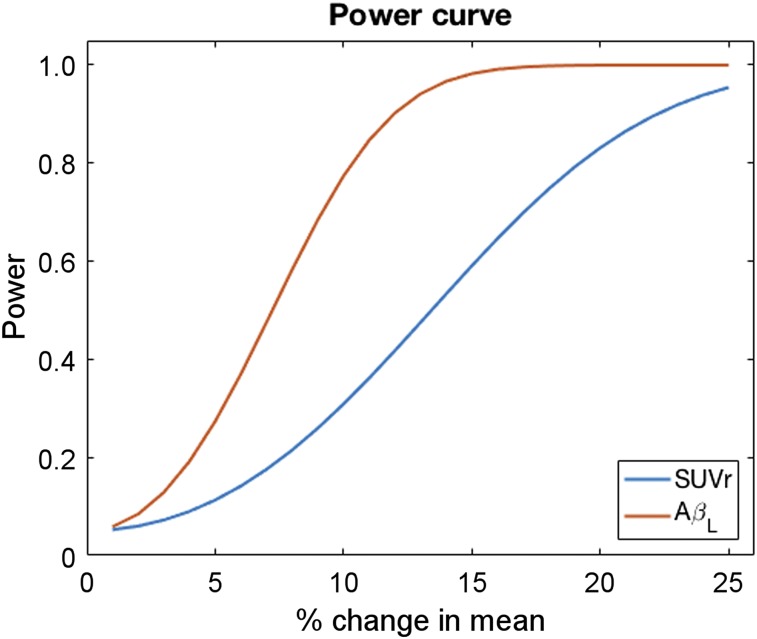
In this work, we calculated AβL and composite SUVr for the scans of 769 subjects ranging across the full spectrum of disease. The effect sizes between the different disease classifications were calculated for both outcome measures, with larger effect sizes observed for AβL in every comparison apart from EMCI to HC, for which the 2 measures were equivalent. The mean increase in effect size between the different classifications in the cross-sectional ADNI data was 46%. This increase in sensitivity would be important in future studies because one would require fewer subjects to detect a significant difference between disease groups and HCs. A similar increase in power was also observed for the longitudinal ADNI data. As with the cross-sectional results, the increased power could be important for future longitudinal studies and clinical trials. In particular, in interventional studies one would have greater power to detect reductions in baseline Aβ. Figure 6 illustrates this by showing power curves (calculated using the effect sizes in the longitudinal data) for AβL and composite SUVr in a simulated clinical trial of an anti-Aβ therapeutic (50 placebo, 50 drug). The power for AβL reaches 80% at about a 10% reduction in baseline Aβ, whereas one would require about a 20% reduction in Aβ to achieve the same when using composite SUVr as the outcome measure. This capacity will have a dramatic effect on the financial cost and disruption to patients in interventional studies and clinical trials and comes at an important time as it has recently been reported that aducanumab reduces Aβ in AD (20).
FIGURE 6.
Power curves for composite SUVr and AβL in simulated clinical trial (50 placebo, 50 drug) of anti-Aβ therapeutic calculated using effect sizes found in longitudinal ADNI data.
The difference image produced by the algorithm allows one to analyze how well the SUVr image data were modeled. This feature can provide useful information as to whether a particular scan has an abnormal AβL due to poor fitting (resulting from poor registration to MNI space or lesions), for instance, rather than abnormal concentrations of Aβ. This information is lacking when composite SUVr is used. In this work, a voxel was considered to be poorly estimated if the absolute difference in intensity was greater than 0.3. Of the SUVr-fitted images, 96% had fewer than 20% of voxels that were poorly fitted, suggesting the SUVr-fitted images accurately model the majority of SUVr images.
The calculated ns in the cross-sectional analysis reduced as the subjects progressed along the AD pathway. It is possible that this finding is caused by reductions in white matter volume because 18F-florbetapir binds nonspecifically to white matter, which has been shown to decline in AD by up to 5% per year. Further investigation would be required to characterize the relationship between the calculated ns and white matter atrophy.
There are some limitations that should be considered when using this technique in future studies. In particular, for interventional studies, one should consider that if the intervention affects the Aβ concentration in a spatially dependent manner (i.e., does not reduce Aβ uniformly across the brain), then scans may not be modeled effectively using a linear combination of NS and K after treatment. The quality of fitting before and after treatment should be investigated in future work. Also, caution should be exercised when using AβL disease groups other than AD, because the outcome measure was developed using templates derived from modeling the disease progression of AD. In addition, it should also be noted that all the work here used SUVr images with a gray matter cerebellum reference region. Recent work has showed greater effect sizes for composite SUVr when using a white matter composite reference region (21), and therefore, the increase in effect size of AβL over this SUVr measure could be reduced. However, as mentioned previously, there is a reduction in the calculated ns as the disease progresses and the use of white matter as a reference region is not without complexities that will require further investigation.
CONCLUSION
We have introduced the novel biomarker AβL for quantifying the global Aβ burden using static 18F-florbetapir PET data. AβL was tested using both cross-sectional and longitudinal data. In both sets of data, AβL showed increased sensitivity to differences in Aβ concentration. AβL could prove useful by increasing the power to detect changes in longitudinal studies and trials of novel therapeutics targeting Aβ.
DISCLOSURE
Roger Gunn is a consultant for Abbvie, Biogen, and Cerveau. Data collection and sharing for this project were funded by the ADNI (National Institutes of Health grant U01 AG024904) and DOD ADNI (Department of Defense award W81XWH-12-2-0012). ADNI is funded by the National Institute on Aging, the National Institute of Biomedical Imaging and Bioengineering, and through generous contributions from the following: AbbVie; Alzheimer’s Association; Alzheimer’s Drug Discovery Foundation; Araclon Biotech; BioClinica, Inc.; Biogen; Bristol-Myers Squibb Company; CereSpir, Inc.; Cogstate; Eisai Inc.; Elan Pharmaceuticals, Inc.; Eli Lilly and Company; EuroImmun; F. Hoffmann-La Roche Ltd and its affiliated company Genentech, Inc.; Fujirebio; GE Healthcare; IXICO Ltd.; Janssen Alzheimer Immunotherapy Research & Development, LLC; Johnson & Johnson Pharmaceutical Research & Development LLC; Lumosity; Lundbeck; Merck & Co., Inc.; Meso Scale Diagnostics, LLC; NeuroRx Research; Neurotrack Technologies; Novartis Pharmaceuticals Corporation; Pfizer Inc.; Piramal Imaging; Servier; Takeda Pharmaceutical Company; and Transition Therapeutics. The Canadian Institutes of Health Research is providing funds to support ADNI clinical sites in Canada. Private sector contributions are facilitated by the Foundation for the National Institutes of Health (www.fnih.org). The grantee organization is the Northern California Institute for Research and Education, and the study is coordinated by the Alzheimer’s Therapeutic Research Institute at the University of Southern California. ADNI data are disseminated by the Laboratory for Neuro Imaging at the University of Southern California. No other potential conflict of interest relevant to this article was reported.
ACKNOWLEDGMENTS
Data used in preparation of this article were obtained from the ADNI database (http://adni.loni.usc.edu/). As such, the investigators within the ADNI contributed to the design and implementation of ADNI or provided data but did not participate in analysis or writing of this report. A complete listing of ADNI investigators can be found at http://adni.loni.usc.edu/wp-content/themes/freshnews-dev-v2/documents/policy/ADNI_Acknowledgement_List%205-29-18.pdf. We thank Clifford Jack for kindly providing us with the longitudinal composite SUVr data; David J. Sharp, Ilan Rabiner, and Paul Matthews for helpful comments on the manuscript; and Yasser Ituria and Alan Evans for interesting discussions on this topic.
Supplementary Material
REFERENCES
- 1.Glenner GG, Wong CW. Alzheimer’s disease: initial report of the purification and characterization of a novel cerebrovascular amyloid protein. Biochem Biophys Res Commun. 1984;120:885–890. [DOI] [PubMed] [Google Scholar]
- 2.Wong DF, Rosenberg PB, Zhou Y, et al. In vivo imaging of amyloid deposition in Alzheimer disease using the radioligand 18F-AV-45 (florbetapir [corrected] F 18). J Nucl Med. 2010;51:913–920. [DOI] [PMC free article] [PubMed] [Google Scholar]
- 3.Wong CW, Quaranta V, Glenner GG. Neuritic plaques and cerebrovascular amyloid in Alzheimer disease are antigenically related. Proc Natl Acad Sci USA. 1985;82:8729–8732. [DOI] [PMC free article] [PubMed] [Google Scholar]
- 4.Hardy JA, Higgins GA. Alzheimer’s disease: the amyloid cascade hypothesis. Science. 1992;256:184–185. [DOI] [PubMed] [Google Scholar]
- 5.Hardy J, Allsop D. Amyloid deposition as the central event in the aetiology of Alzheimer’s disease. Trends Pharmacol Sci. 1991;12:383–388. [DOI] [PubMed] [Google Scholar]
- 6.Stefani M, Dobson CM. Protein aggregation and aggregate toxicity: new insights into protein folding, misfolding diseases and biological evolution. J Mol Med. 2003;81:678–699. [DOI] [PubMed] [Google Scholar]
- 7.Jagust WJ, Landau SM, Koeppe RA, et al. The Alzheimer’s Disease Neuroimaging Initiative 2 PET Core: 2015. Alzheimers Dement. 2015;11:757–771. [DOI] [PMC free article] [PubMed] [Google Scholar]
- 8.Rowe CC, Ellis KA, Rimajova M, et al. Amyloid imaging results from the Australian Imaging, Biomarkers and Lifestyle (AIBL) study of aging. Neurobiol Aging. 2010;31:1275–1283. [DOI] [PubMed] [Google Scholar]
- 9.Jack CR, Wiste HJ, Lesnick TG, et al. Brain β-amyloid load approaches a plateau. Neurology. 2013;80:890–896. [DOI] [PMC free article] [PubMed] [Google Scholar]
- 10.Mueller SG, Weiner MW, Thal LJ, et al. The Alzheimer’s Disease Neuroimaging Initiative. Neuroimaging Clin N Am. 2005;15:869–877. [DOI] [PMC free article] [PubMed] [Google Scholar]
- 11.Tryputsen V, DiBernardo A, Samtani M, Novak GP, Narayan VA, Raghavan N. Optimizing regions-of-interest composites for capturing treatment effects on brain amyloid in clinical trials. J Alzheimers Dis. 2015;43:809–821. [DOI] [PubMed] [Google Scholar]
- 12.Landau SM, Fero A, Baker SL, et al. Measurement of longitudinal β-amyloid change with 18F-florbetapir PET and standardized uptake value ratios. J Nucl Med. 2015;56:567–574. [DOI] [PMC free article] [PubMed] [Google Scholar]
- 13.Lammertsma AA. Forward to the past: the case for quantitative PET imaging. J Nucl Med. 2017;58:1019–1024. [DOI] [PubMed] [Google Scholar]
- 14.Whittington A, Sharp DJ, Gunn RN; Alzheimer’s Disease Neuroimaging Initiative. Spatiotemporal distribution of β-amyloid in Alzheimer disease is the result of heterogeneous regional carrying capacities. J Nucl Med. 2018;59:822–827. [DOI] [PMC free article] [PubMed] [Google Scholar]
- 15.Jagust WJ, Bandy D, Chen K, et al. The Alzheimer’s Disease Neuroimaging Initiative positron emission tomography core. Alzheimers Dement. 2010;6:221–229. [DOI] [PMC free article] [PubMed] [Google Scholar]
- 16.Mazziotta J, Toga A, Evans A, et al. A probabilistic atlas and reference system for the human brain: International Consortium for Brain Mapping (ICBM). Philos Trans R Soc London Ser B Biol Sci. 2001;356:1293–1322. [DOI] [PMC free article] [PubMed] [Google Scholar]
- 17.Ashburner J. A fast diffeomorphic image registration algorithm. Neuroimage. 2007;38:95–113. [DOI] [PubMed] [Google Scholar]
- 18.Tziortzi AC, Searle GE, Tzimopoulou S, et al. Imaging dopamine receptors in humans with [11C]-(+)-PHNO: dissection of D3 signal and anatomy. Neuroimage. 2011;54:264–277. [DOI] [PubMed] [Google Scholar]
- 19.Whittington A, Sharp DJ, Gunn RN. Spatiotemporal distribution of β-amyloid in Alzheimer disease is the result of heterogeneous regional carrying capacities. J Nucl Med. 2018;59:822–827. [DOI] [PMC free article] [PubMed] [Google Scholar]
- 20.Sevigny J, Chiao P, Bussière T, et al. The antibody aducanumab reduces Aβ plaques in Alzheimer’s disease. Nature. 2016;537:50–56. [DOI] [PubMed] [Google Scholar]
- 21.Fleisher AS, Joshi AD, Sundell KL, et al. Use of white matter reference regions for detection of change in florbetapir positron emission tomography from completed phase 3 solanezumab trials. Alzheimers Dement. 2017;13:1117–1124. [DOI] [PubMed] [Google Scholar]
Associated Data
This section collects any data citations, data availability statements, or supplementary materials included in this article.


