Abstract
With the growing popularity of wearable devices in the consumer space, interest in leveraging this technological platform in the medical field is rising. In this report, we describe a smartwatch capable of measuring respiration and heart rate using photoplethysmography (PPG). The device couples a photosensor, specifically tuned bandpass filters, and frequency content analysis to extract respiration and heart rate from the PPG signal. The results from the experimental device were compared to a commercial chest strap heart rate monitor. Respiratory rate measurements agreed within 1 breath per minute and heart rate measurements agreed within 3–4 beats per minute of the reference device. Furthermore, the device was packaged in an untethered wristwatch allowing for real-time measurements and analysis.
I. Introduction
Methods to measure physiological signals, such as heart rate, using photoplethysmography (PPG) detect changes in the volume of blood flowing through blood vessels due to the rhythmic activity of the heart [1]. This volume change is measured by illuminating the capillary bed with a small light source and measuring the amount of light that reflects or passes through the tissue with a photodiode. This technique has been utilized at length in consumer fitness devices for continuous monitoring of heart rate during rest and exercise [2]. Though heart rate monitoring is undoubtedly beneficial for monitoring general health and activity levels, more sensing capabilities are needed to provide a more holistic picture of human health. Of these additional sensing capabilities, respiration is of particular value since it provides a more comprehensive evaluation of cardiopulmonary activity when coupled with heart rate monitoring [3]. Respiratory monitoring provides additional clinical diagnostic capabilities for diagnosing anomalies such as sleep apnea [4], hyperventilation [5], [6], and panic disorders [7]. As such, respiratory rate measurements have extensive clinical utility. Conveniently, PPG has also been shown to measure respiratory signals in addition to heart rate [8], [9]. This suggests that there is a possibility of monitoring respiratory and heart rate with a single device by analyzing the PPG signal.
In addition to sensing capabilities and detection modalities, the choice of form factor is critical. For heart rate measurements, both chest strap and wrist-worn devices have been developed. However, chest straps are known for their level of discomfort [2] making a wrist-worn device a more attractive form factor. In this report, we detail our on-going development of a wrist-worn PPG device capable of measuring both heart rate and respiration. Our device exceeds the abilities of current commercially available wrist-worn fitness devices, which are able to measure heart rate alone [2], by demonstrating the ability to measure both heart rate and respiration using additional filtering and signal amplification strategies.
II. Device Construction and Testing
A. Feature-packed
The device is fully-featured to include the main components to perform the physiological monitoring, as well as auxiliary features to give it the capabilities of a watch. The device contains a 9DoF inertial measurement unit, a PCF8523 real-time clock, SD card, 0.66in’ OLED, three user input buttons, an ARM Cortex M0 Bluetooth microcontroller, external RAM, a vibration motor, a speaker, fuel gauge for monitoring battery usage, battery charging circuit, and voltage regulator. These components were designed on custom designed printed circuit boards contained within a 42mm wide x 38mm tall x 18mm tall 3D printed enclosure.
B. Pulse and Respiration Sensor Construction
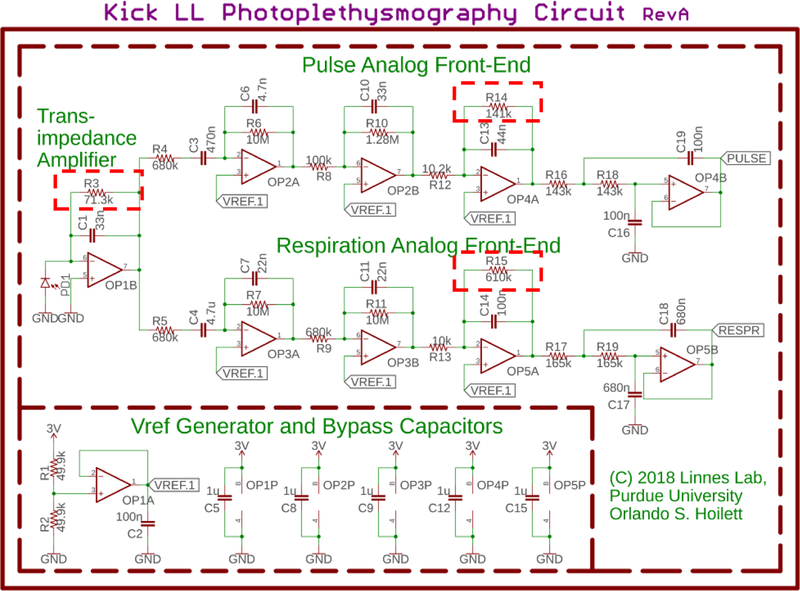
The PPG sensing circuit (Fig. 1) is primarily composed of a photodiode, a transimpedance amplifier (TIA), and two sets of cascaded active filters. Each set of filters is specifically tuned for monitoring heart rate, which has a frequency range of 0.7 Hz to 3.5 Hz corresponding to 42 beats per minute (BPM) to 210 BPM, and respiratory rate, which has a frequency range of 0.2 Hz to 0.5 Hz corresponding to 12 breaths per minute (BrthPM) to 30 BrthPM, in healthy human adults [10].
Fig. 1.
Schematic of the PPG sensing circuit. The signal from the transimpedance amplifier is sent into two sets of cascaded active filters tuned for heart rate sensing and respiration monitoring respectively. The outputs of the amplifier stages are sensed by two channels of an on-board 10-bit analog-to-digital converter on a Bluetooth-enabled microcontroller. The signals are processed by the on-board microcontroller. R3, R14, and R15 (highlighted with a dashed box) are digitally controlled potentiometers enabling automatic gain control. Using these potentiometers, the microcontroller can modulate system gain in order to adjust for differences in the optical reflective properties of skin across difference subjects.
The TIA converts the current produced by the photodiode to a voltage. This voltage is then sent into each respective set of active filters tuned for heart and respiratory rate monitoring respectively. The outputs of our PPG sensing circuits are sensed by a microcontroller with a 10-bit analogto-digital converter. The heart rate circuit is sampled at 11.9Hz, while the respiration circuit is sampled at 4.0Hz satisfying Nyquist.
C. Automatic Gain Control
The signal from the photodiode will vary with a number of physiological factors such as skin tone [11]. As such, it is necessary to scale the gain of each amplifier stage to avoid saturating the amplifiers. To accomplish this, we employ a dynamic gain control using digitally controlled potentiometers (R3, R14, and R15 in Fig. 1). Digital potentiometers are variable resistors that can be programmed over a serial interface such as I2C. By employing these digital potentiometers, we can modify the gain of each amplifier stage in software, removing the need for user intervention, and allowing the device to be portable and used in the field.
D. Comparison to Reference Standard
We compared the results from our experimental device to the BioHarness 3 from Zephyr™ Technology. The BioHarness 3 is a U.S.-FDA cleared physiological monitor available in the form of a chest strap. The device collects the electrocardiogram (ECG) signal using fabric electrodes located in the chest strap, and reports both heart and respiratory rates to the user via a convenient mobile application. The data from the BioHarness was exported using the IoTool smartphone application on a ZTE Whirl 2 Z667G Android phone. We chose to compare our device to the BioHarness due to its portability, relative low-cost, and accessible app interface. Furthermore, the device has been validated for accuracy in an earlier study [12].
E. Device Validation
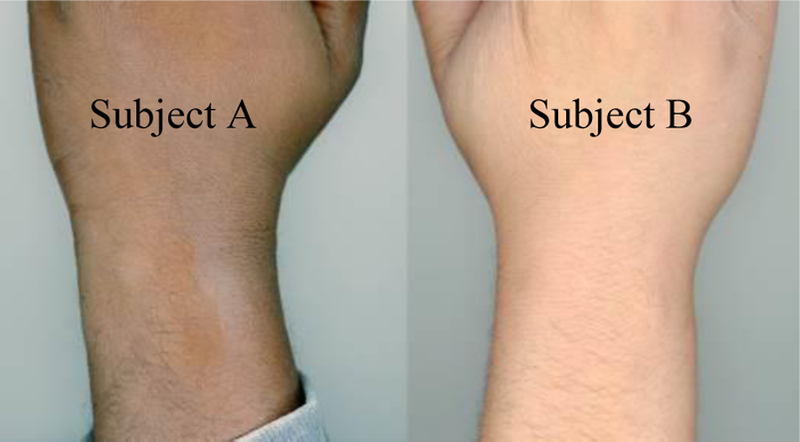
This study was approved by the Institutional Review Board at Purdue University. As a pilot, we tested our device on two participants, Subject A and Subject B. Prior to participating in the study, both subjects gave oral and written consent. Both subjects were male in the age range of 25–34 years. Other physical characteristics of both subjects are summarized in Table I and each subject’s skin tone is shown in Fig. 2. Subjects were allowed to place the experimental device on either hand in accordance with the location each subject usually wears wristwatches. Subjects were instructed to place the device snugly on the wrist, to their own comfort. The device was located about 1–2 inches upwards from the wrist. Subject A placed the device on his non-dominant hand (left), while Subject B placed the device on his dominant hand (right). Each subject also wore the reference standard below the chest about even-level with the diaphragm. Measurements were taken while Subject A sat upright in a chair around a small desk. Subject B was monitored while lying flat on a couch, sleeping.
TABLE I.
Physical characteristics of each subject
| Subject A | Subject B | |
|---|---|---|
| Age Range (years) | 25–34 | 25–34 |
| Gender | Male | Male |
| Height (cm) | 175.3 | 172.7 |
| Weight (kg) | 87.1 | 106.6 |
| Skin Tone | Dark | Medium |
| Dominant Hand | Right | Right |
| Sensor Location | Left Wrist | Right Wrist |
| Testing Position | Seated Upright | Sleeping |
Fig. 2.

Scanned images of subjects’ wrists. Images were taken with an Epson Perfection V850 Pro using the Epson Scan Windows application Version 3.9.3.2US with 24-bit color and 600dpi resolution.
For initial benchtop validation, the discrete Fourier transform (DFT) was computed in Microsoft Excel using the “Data Analysis ToolPak” toolkit. The DFT was calculated with 128 samples using a rectangular window for both sets of measurements (heart rate and respiration). We then identified the local maxima of the resulting spectra and compared those frequencies to the respiratory and heart rates returned by the commercial device.
The sampling rates and number of samples were chosen in order to optimize frequency resolution as well as the length of sampling period. In order to collect 128 samples at 11.9Hz for our heart rate measurements, it is necessary to sample for 11 seconds giving our heart rate determination a refresh rate of 11 seconds and a resolution of 0.09 Hz (5.4B PM). The frequencies of interest were limited to 0.7 to 3.5 Hz. The conditions for respiratory rate monitoring were determined similarly. Sampling at 4.0 Hz for 128 samples provides a refresh rate of 33 seconds and a frequency resolution of 0.03 Hz (1.8 BrthPM). The frequencies of interest were limited to 0.2Hz to 0.5Hz.
To properly compare the results from our device to the BioHarness, a few special considerations had to be made. The reference device returns beat-to-beat heart rate and breath-to-breath respiratory rate measurements, while the experimental device returns the rates over the respective sampling periods. As a result, we averaged the rates reported by the reference device over the same sampling periods as the experimental device.
After benchtop validation, the on-board microcontroller was programmed to compute the DFT on-chip, allowing the device to be completely portable and independent of a computer. The microcontroller was programmed according to the expression for calculating the discrete Fourier transform (DFT) [13] using a rectangular window. Care was taken to avoid performing trigonometric floating-point calculations on the microcontroller as these are computationally expensive and severely slow down our data processing. Instead, we stored the trigonometric relationships in an array of 128 values mapped as 16-bit unsigned integers between 0 and 1000. Indexing the array instead of computing the exact value of the trigonometric function increased our computing speed extensively. We then limited the calculation of the DFT to the frequencies of interests, namely 0.7 Hz to 3.5 Hz for heart rate measurements and 0.2 Hz to 0.5 Hz for respiratory rate measurements. We were able to calculate the DFT in less than 50ms compared to 83 seconds when using the exact value of the trigonometric function.
III. Results and Discussion
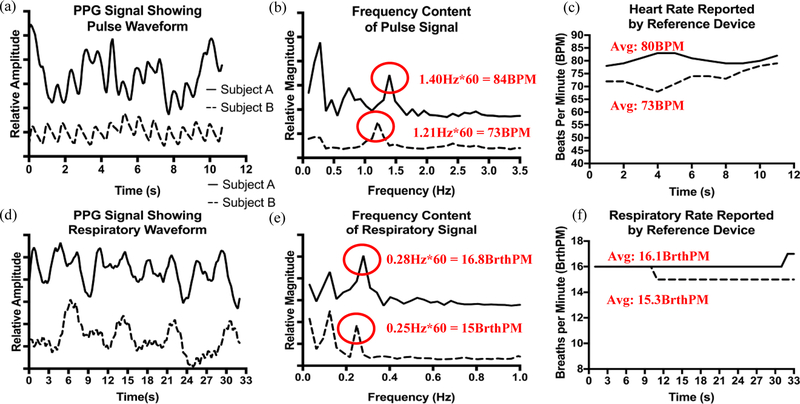
Overall, the results from our initial pilot study showed reasonable agreement between the experimental device and the reference device. For each Subject, the error rates were within 3–4 BPM or BrthPM (accounting for rounding) as indicated in Fig. 3. For Subject A, the experimental device reported prominent frequency content at 0.28Hz and 1.40Hz for heart rate, and 0.12Hz and 0.28Hz for respiration. The reference device reported rates of 80BPM and 16.1BrthPM during the sampling period, corresponding to 1.40Hz (84BPM) and 0.28Hz (16.8BrthPM) in the data collected by the experimental device. Furthermore, we observed that for Subject A, the respiratory component could be seen in the heart rate signal (Fig. 3(a) and 3(b) at 0.28Hz) even before further signal processing was done to amplify the respiratory signal. Data agreement was similar for Subject B. We observed frequency content at 1.21Hz in the heart rate data and 0.12Hz and 0.25Hz in the respiratory data. The reference device reported an average heart rate of 73BPM and an average respiratory rate of 15.3BrthPM during the sampling period. This agrees with frequency content at 1.21Hz (73BPM) and 0.25Hz (15BrthPM) reported by the experimental device.
Fig. 3.
(a) Shows the time domain response of the experimental device to heartbeats for Subjects A and B. We can visibly observe at least 2 frequency components in each signal, one possibly corresponding to heart rate and the other to respiration. (b) Each signal is processed in the frequency domain. Suspected frequency components indicative of heart rate are highlighted. (c) Data from the reference device indicates heart rates of 83BPM and 73BPM for Subjects A and B, respectively. These rates correspond to frequency components 1.40Hz for Subject A and 1.21Hz for Subject B. (d) The respiratory signal is shown. We notice slower changes in the signal on the order of several seconds compared to heart rate, which was more on the order of 1 to 1.5 seconds. (e) The spectra of the respiration signals are highlighted with two dominant frequency components for each Subject (0.12Hz and 0.28Hz for Subject A and 0.12Hz and 0.25Hz for Subject B). (f) Data from the reference device indicates a respiratory rates of 16.1 BrthPM for Subject A and 15.3Hz for Subject B. These rates correspond to peaks at 0.28Hz (Subject A) and 0.25Hz (Subject B) for each respective subject.
We do observe the presence of additional frequency content for each Subject and for each measurement that do not appear to be indicative of any physiological signal indicated by the reference device (0.12Hz in respiratory rate measurements for both subjects and 0.74Hz in the heart rate spectra for Subject A). We postulate that these additional frequency components could be due to system baseline drift and further investigation is necessary to confirm.
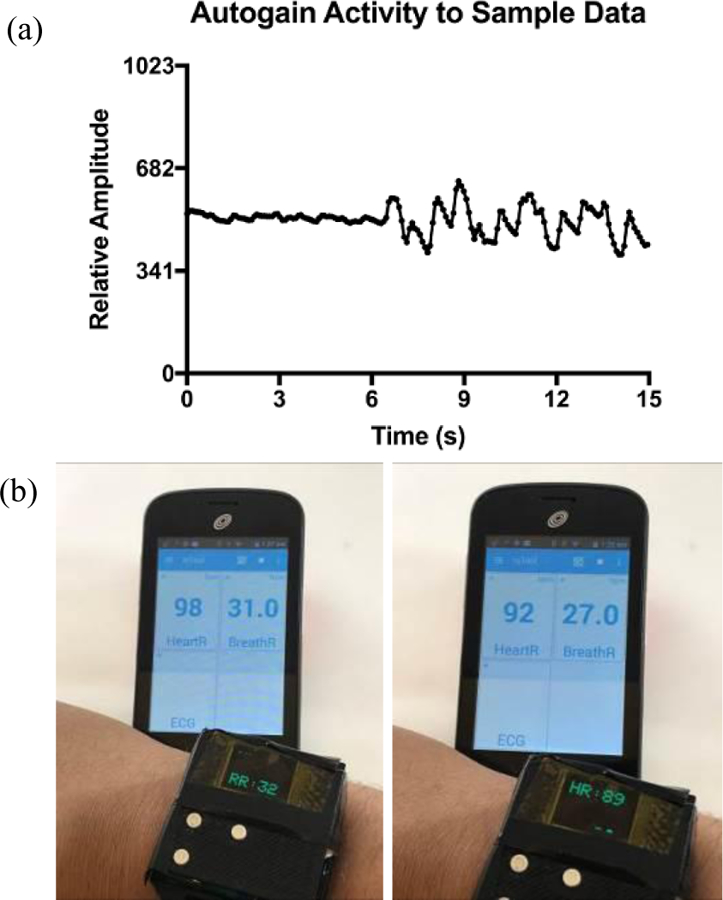
Furthermore, we validated our device for untethered collection of data with all processing and determination of physiological rates done on-board (Fig. 4.). Our respiratory rate measurements agreed within 1BrthPM of the reference standard, while the heart rate measurements agreed within 3BPM.
Figure 4.

(a) Amplitude increase in signal due to activity of auto-gain function. The microcontroller samples the dataset for the full sampling period, then adjusts the gain of the active filters to module signal amplitude. (b) Real-time, on-board signal processing of heart and respiratory signals after a very stressful event. The refresh rate of the display is such that heart rate (HR) and respiratory rate (RR) could not be captured in a single photograph at the same time. Additionally, there is a few seconds delay between each snapshot resulting in the difference in HR and RR reported by the reference device (viewed on the smartphone), which has a faster refresh rate than the experimental device.
IV. Conclusion
We have presented a proof-of-concept for accurate measurements of respiration and heart rate on the wrist with a single device. Our device improves upon other wrist-worn PPG sensors, which are only capable of measuring heart rate alone, by demonstrating the ability to detect respiration in addition to heart rate. Future optimization of our algorithms will be done in order to improve the refresh rate of our measurements. We postulate this could be done by sliding our DFT computation across the sampling period. We will also increase the number of human subjects in order to validate the accuracy of our device for all-day wear.
Acknowledgment
We would like to acknowledge the Weldon School of Biomedical Engineering for allowing us to use their 3D printer to prototype our housing units. We would also like to thank our subjects for participating in the study.
* Research supported by National Institute on Drug Abuse; 5U01DA038886–02.
Contributor Information
Orlando S. Hoilett, Weldon School of Biomedical Engineering, Purdue University, West Lafayette, IN 47907 USA..
Ashlyn M. Twibell, Weldon School of Biomedical Engineering, Purdue University, West Lafayette, IN 47907 USA.
Rohit Srivastava, Weldon School of Biomedical Engineering, Purdue University, West Lafayette, IN 47907 USA..
Jacqueline C. Linnes, Weldon School of Biomedical Engineering, Purdue University, West Lafayette, IN 47907 USA..
References
- [1].Allen J, “Photoplethysmography and its application in clinical physiological measurement,” Physiol. Meas, vol. 28, no. 3, p. R1, 2007. [DOI] [PubMed] [Google Scholar]
- [2].Spierer DK, Rosen Z, Litman LL, and Fujii K, “Validation of photoplethysmography as a method to detect heart rate during rest and exercise,” J. Med. Eng. Technol, vol. 39, no. 5, pp. 264–271, July 2015. [DOI] [PubMed] [Google Scholar]
- [3].Fieselmann JF, Hendryx MS, Helms CM, and Wakefield DS, “Respiratory rate predicts cardiopulmonary arrest for internal medicine inpatients,” J. Gen. Intern. Med, vol. 8, no. 7, pp. 354–360, July 1993. [DOI] [PubMed] [Google Scholar]
- [4].“Clinical Guideline for the Evaluation, Management and Long-term Care of Obstructive Sleep Apnea in Adults,” J. Clin. Sleep Med. JCSM Off. Publ. Am. Acad. Sleep Med, vol. 5, no. 3, pp. 263–276, June 2009. [PMC free article] [PubMed] [Google Scholar]
- [5].Folgering H, “The pathophysiology of hyperventilation syndrome.,” Monaldi Arch. Chest Dis. Arch. Monaldi Mal. Torace, vol. 54, no. 4, pp. 365–372, August 1999. [PubMed] [Google Scholar]
- [6].Missri JC and Alexander S, “Hyperventilation Syndrome: A Brief Review,” JAMA, vol. 240, no. 19, pp. 2093–2096, November 1978. [PubMed] [Google Scholar]
- [7].Cowley DS and Roy-Byrne PP, “Hyperventilation and panic disorder,” Am. J. Med, vol. 83, no. 5, pp. 929–937, November 1987. [DOI] [PubMed] [Google Scholar]
- [8].Leonard P, Beattie T, Addison P, and Watson J, “Standard pulse oximeters can be used to monitor respiratory rate,” Emerg. Med. J. EMJ, vol. 20, no. 6, pp. 524–525, November 2003. [DOI] [PMC free article] [PubMed] [Google Scholar]
- [9].Clifton D, Douglas JG, Addison PS, and Watson JN, “Measurement Of Respiratory Rate From the Photoplethysmogram In Chest Clinic Patients,” J. Clin. Monit. Comput, vol. 21, no. 1, pp. 55–61, February 2007. [DOI] [PubMed] [Google Scholar]
- [10].Eckberg DL, Kifle YT, and Roberts VL, “Phase relationship between normal human respiration and baroreflex responsiveness.,” J. Physiol, vol. 304, no. 1, pp. 489–502, July 1980. [DOI] [PMC free article] [PubMed] [Google Scholar]
- [11].Kim J et al. , “Battery-free, stretchable optoelectronic systems for wireless optical characterization of the skin,” Sci. Adv, vol. 2, no. 8, p. e1600418, August 2016. [DOI] [PMC free article] [PubMed] [Google Scholar]
- [12].Kim J-H, Roberge R, Powell JB, Shafer AB, and Williams WJ, “Measurement Accuracy of Heart Rate and Respiratory Rate during Graded Exercise and Sustained Exercise in the Heat Using the Zephyr BioHarness™,” Int. J. Sports Med, vol. 34, no. 6, pp. 497–501, June 2013. [DOI] [PMC free article] [PubMed] [Google Scholar]
- [13].Allen J, “Short term spectral analysis, synthesis, and modification by discrete Fourier transform,” IEEE Trans. Acoust. Speech Signal Process, vol. 25, no. 3, pp. 235–238, June 1977. [Google Scholar]


