

SUMMARY
The chromatin-associated protein WDR5 is a promising target for pharmacological inhibition in cancer. Drug discovery efforts center on the blockade of the “WIN site” of WDR5, a well-defined pocket that is amenable to small molecule inhibition. Various cancer contexts have been proposed to be targets for WIN site inhibitors, but a lack of understanding of WDR5 target genes and of the primary effects of WIN site inhibitors hampers their utility. Here, by the discovery of potent WIN site inhibitors, we demonstrate that the WIN site links WDR5 to chromatin at a small cohort of loci, including a specific subset of ribosome protein genes. WIN site inhibitors rapidly displace WDR5 from chromatin and decrease the expression of associated genes, causing translational inhibition, nucleolar stress, and p53 induction. Our studies define a mode by which WDR5 engages chromatin and forecast that WIN site blockade could have utility against multiple cancer types.
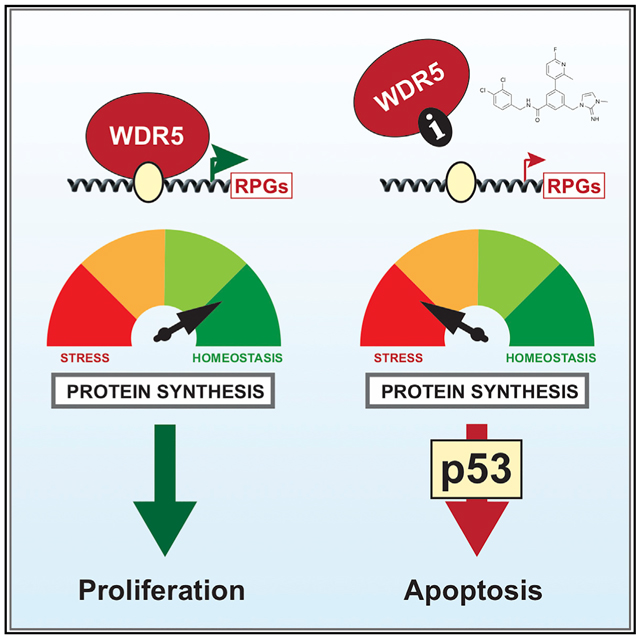
Graphical Abstract
In Brief
WDR5 is a chromatin-associated protein and promising anti-cancer target. Aho et al. show that WDR5 controls the expression of ribosome protein genes and describe how small molecule inhibitors of WDR5 displace it from chromatin, causing impeded translation, nucleolar stress, and induction of p53-dependent apoptosis in leukemia cells.
INTRODUCTION
Increased awareness of the importance of epigenetic processes in cancer has fueled interest in the concept that epigenetic regulators can be targeted to treat malignancy. A collection of epigenetic regulators has been subject to small molecule inhibition in recent years, including histone methyltransferases, his-tone deacetylases, and proteins that bind modified histones. There are dozens of small molecule epigenetic inhibitors in clinical trials in the United States (Bennett and Licht, 2018), but as the likelihood of approval of investigational oncology drugs is small, drugs against additional targets are needed to increase the chances that one of these agents will improve our ability to treat cancer.
One epigenetic regulator that has received considerable attention as a cancer target is WDR5. WDR5 is a WD40-repeat protein that scaffolds the assembly of multiple epigenetic “writers,” including the non-specific lethal (NSL) and Ada2-containing (ATAC) histone acetyltransferase (HAT) complexes and the MLL/SET-type histone methyltransferases (HMTs) that catalyze histone H3 lysine 4 (H3K4) di- and tri-methylation (Guarnaccia and Tansey, 2018). Aberrant WDR5 expression is implicated in a variety of cancers, such as leukemias (Ge et al., 2016), breast cancer (Dai et al., 2015), and bladder cancer (Chen et al., 2015). In addition, WDR5 has been shown to play a critical role in promoting the epithelial-to-mesenchymal transition (Wu et al., 2011), it serves as a co-factor for MYC (Carugo et al., 2016; Thomas et al., 2015), and it is a promising therapeutic target in a number of bloodborne and solid cancers (Cao et al., 2014; Grebien et al., 2015; Zhu et al., 2015). Highly potent drug-like inhibitors of WDR5—if they can be discovered—could have a tremendous impact in the clinic.
From a structural perspective, the most obvious route to pharmacologically inhibit WDR5 is via the WIN (WDR5 interaction) site, a well-defined pocket that mediates interaction with an arginine-containing motif (WIN motif; consensus “ARA”) present in multiple WDR5-interaction partners (Guarnaccia and Tansey, 2018). Although the functions of the WIN site are not fully understood, it is clear that the HMT activity of complexes carrying the MLL1 protein, but not other mixed lineage leukemia/Su(var)3–9, Ezh2, Trithorax (MLL/SET) family members, is dependent on WIN site binding by a WIN motif (Alicea-Velázquez et al., 2016), leading to the concept that WIN site inhibitors could alter transcriptional patterns by modulating H3K4 methylation. Consistent with this idea, a moderately potent (Kd ~100 nM) small molecule WIN site inhibitor inhibits cancer cells that express mutant forms of CCAAT-enhancer-binding protein α (C/EBPα) (Grebien et al., 2015) and p53 (Zhu et al., 2015). Additionally, higher affinity (Kd ~1 nM) peptidomimetics against the WIN site temper H3K4 methylation and inhibit leukemia cells bearing rearrangements in the MLL1 gene (Cao et al., 2014). Whether WIN site inhibitors work by directly affecting H3K4 methylation or whether these changes are a secondary consequence of some other perturbation of the WIN site, however, is unknown. Compounding this issue is the relative lack of understanding of the types of genes controlled by WDR5, making it difficult to predict the primary transcriptional consequences of WIN site blockade.
Given the therapeutic potential of targeting WDR5 in cancer, we sought to independently discover small molecule inhibitors of the WIN site and to characterize their primary mechanism of action in the well-studied context of MLL1-rearranged (MLLr) cancer cells. Here, we used fragment-based approaches, coupled with structure-based design, to identify inhibitors that bind tightly to the WIN site of WDR5—in our best case, with an affinity in the picomolar range. We show that these inhibitors result in the rapid and comprehensive displacement of WDR5 from chromatin and lead to a commensurate decrease in the expression of WDR5-bound genes. We also define how these compounds inhibit proliferation and induce apoptosis in MLLr cancer cells. These studies reveal a primary mechanism of action of WIN site inhibitors, illuminate gene regulatory networks driven by WDR5, and forecast that drug-like WIN site inhibitors could have broad anti-cancer activity.
RESULTS
Discovery of WIN Site Inhibitors
To identify small molecules that bind the WIN site, we conducted a fragment-based screen of ~13,800 compounds by acquiring SOFAST 1H-15N heteronuclear multiple quantum coherence (HMQC) spectra of WDR5 (Wang et al., 2018). An initial HMQC spectrum of uniformly 15N-labeled WDR5 with an unlabeled MLL1 WIN peptide highlighted peak shifts that correspond to amino acids in the vicinity of the WIN site. Mixtures of 12 fragments were incubated with labeled WDR5 protein, and those that caused peak shifts similar to the MLL1 peptide were flagged as WIN site hits. Follow-up screening of individual compounds from the hit mixtures identified 47 hits. One of these fragment hits is compound C1 (Figure 1A), which binds WDR5 with a Kd of ~66 μM (Table S1). We solved the X-ray crystal structure of C1 when complexed with WDR5 (Figure 1B; Table S2) and found that the cyclic guanidine of C1 binds deep into the S2 pocket of WDR5 (Wang et al., 2018), mimicking the arginine of the WIN peptide. To improve the affinity of C1, we used structure-based design to access nearby pockets. Growing out to S7 with a benzyl amide yielded compound C2 (Figure 1A), with a ~3,000-fold improvement in affinity. In the X-ray structure of WDR5 bound to C2 (Figure 1C; Table S2), the benzyl group occupies the S7 pocket, anchored by additional hydrogen-bonding interaction of the carbonyl oxygen with the backbone NH of Cys-261. Further optimization of C2 led to C3 (Figure 1A), with a Kd of 1.3 nM. Compound C3 provides improved potency by modifying the substituents on the benzylic ring to better occupy the S7 pocket and by inclusion of a fluorine atom on the phenyl core that points toward the S4 pocket (Figure 1D; Table S2). C3 is our first-generation chemical probe to explore the cellular consequences of WIN site blockade. To aid in these studies, we designed a negative control compound, C3nc (Figure S1A), that has the same molecular weight as C3 but binds WDR5 with reduced affinity due to the regioisomeric fluorine atom that clashes with the protein.
Figure 1. Discovery of Small Molecule WIN Site Inhibitors.

(A) Elaboration of fragment hit C1 into our first-generation chemical probe C3.
(B–D) X-ray co-crystal structures of WDR5 bound to (B) the fragment hit C1 (PDB: 6DY7), (C) C2 (PDB: 6E1Y), and (D) C3 (PDB: 6E22).
(E) Elaboration of fragment hit C4 into our second-generation chemical probe C6.
(F–H) X-ray co-crystal structures of WDR5 bound to (F) the fragment hit C4 (PDB: 6E1Z), (G) C5 (PDB: 6DYA), and (H) C6 (PDB: 6E23).
See also Figure S1 and Tables S1 and S2.
To obtain a more potent probe, we started with a different fragment hit (C4; Figure 1E). Although C4 bound the S2 pocket as shown in the X-ray structure (Figure 1F; Table S2), it did not bind to any of the nearby binding sites. Accessing the S7 pocket (Figure 1G; Table S2) led to compound C5, which has improved binding affinity. A further improvement in affinity was achieved by occupying the S4 pocket with compound C6 (Figures 1H, S1B, and S1C; Table S2). C6 has a Kd of ~100 pM and served as our second-generation chemical probe. As with C3, we obtained a negative control, C6nc, in this instance by adjusting the attachment point of the S2 imidazole-imine “warhead” to yield a compound with a >1,000-fold reduction in binding affinity (Figure S1A). For C3 and C6, we performed direct affinity measurements using surface plasmon resonance and found that in both cases their affinity for WDR5 was within 2-fold of the values calculated by time-resolved fluorescence energy transfer (TR-FRET) (Figure S1D). Representative data from affinity measurement experiments is shown in Figures S1E and S1F. As expected, C3 and C6 inhibit the HMT activity of MLL/SET complexes containing MLL1 and do so in a manner that reflects their affinity for the WIN site (Table S1). Profiling C6 against all MLL/SET complexes (Table S1), we found the inhibition to be specific for MLL1, with little activity against other MLL/SET family members. We used C3 and C6 and their negative controls to interrogate the biological consequences of WIN site blockade.
C3 and C6 Inhibit Leukemia Cell Lines In Vitro
The WIN site peptidomimetic MM-401 inhibits cell lines and primary transformed cells carrying MLL1 rearrangements (Cao et al., 2014). We asked whether C3 and C6 show similar activity. We profiled a collection of human leukemia lines, as well as human CD34+ cord blood cells transformed by the expression of an MLL-AF9 fusion protein (MA93), either alone or in conjunction with FMS-like tyrosine kinase-3-internal tandem duplication (FLT3-ITD) (MA93 FLT3-ITD) or NrasG12D (MA93 Ras) onco-genes (Wei et al., 2008). We also tested the murine Mll-Af9; NrasG12D cell line RN2, derived from the spleens of terminally ill leukemic mice (Mazurek et al., 2014). We treated cells with increasing doses of compounds for 3 days and measured viable cell numbers compared to DMSO-treated controls (Table 1). Four trends were apparent from this analysis. First, MLLr cell lines are generally more sensitive than non-MLLr cells to both C3 and C6. Second, the tighter WIN site binder C6 has higher cellular potency than C3 in all sensitive lines. Third, negative control compounds C3nc and C6nc have little, if any, activity in any cell type. Fourth, a robust response to these inhibitors appears to correlate with p53 status, as MLLr leukemia lines with wild-type (WT) p53 were more sensitive than lines with mutant p53.
Table 1.
Cellular Sensitivity to WIN Site Compounds and Their Matching Negative Controls
| Cell Line | C6 GI50 (μM) | C6nc GI50 (μM) | C3 GI50 (μM) | C3nc GI50 (μM) | p53 Status | Notable Mutations |
|---|---|---|---|---|---|---|
| MV4:11 | 3.20 ± 0.213 | 42.0 ± 9.02 | 6.67 ± 0.519 | >50 | WT | MLL-AF4, FLT3/ITD |
| Molm13 | 6.43 ± 0.683 | >50 | 10.3 ± 1.03 | >50 | WT | MLL-AF9, FLT3/ITD |
| HL60 | 14.8 ± 1.10 | >50 | >50 | >50 | null | Nras (Q61L) |
| K562 | 25.4 ± 2.07 | 31.7 ± 2.45 | >50 | >50 | null (Q136fs) | |
| THP-1 | >50 | >50 | >50 | >50 | null (C174fs) | MLL-AF9, Nras (G12D) |
| HEL | >50 | >50 | >50 | >50 | M133K | JAK2 V617F |
| NOMO-1 | >50 | >50 | >50 | >50 | null (C242fs) | MLL-AF9 |
| SET-2 | >50 | >50 | >50 | >50 | R248W (GOF) | JAK2 V617F |
| MONO-Mac-6 | 31.7 ± 2.32 | >50 | ND | ND | R273H | MLL-AF9 |
| GDM-1 | >50 | >50 | ND | ND | WT | |
| MA93 | 5.04 ± 0.431 | 30.3 ± 5.94 | 22.1 ± 3.60 | >50 | p53+ | MLL-AF9 |
| MA93 FLT3-ITD | 2.47 ± 0.137 | 26.2 ± 4.75 | 21.2 ± 2.11 | >50 | p53+ | MLL-AF9, FLT3/ITD |
| MA93 Ras | 20.75 ± 2.625 | >50 | >50 | >50 | p53+ | MLL-AF9, Nras (G12D) |
| RN2 | 11.2 ± 1.48 | >50 | 8.65 ± 0.989 | >50 | p53+ | MLL-AF9, Nras (G12D) |
The indicated cell lines were treated with at least a five-point serial dilution set of compounds for 3 days, and cell numbers determined by either MTS assay (RN2) or CellTiter-Glo (all other lines). Cell numbers for each dose were normalized to those from DMSO-treated samples and used to calculate mean GI50 values, which are shown along with SEMs. The p53 status of each cell line is shown; MA93, MA93 FLT3-ITD, MA93 Ras, and RN2 cells are positive for the expression of p53 protein (p53+), but whether p53 is mutant in these cells is unknown. Mutation information was collected from ATCC, DMSZ, or the Broad Institute Cancer Cell Line Encyclopedia. >50, the top concentration used (50 μM) did not reduce cell number below 50%. ND, not determined. See also Figure S2.
For two representative cell lines, MV4:11 (sensitive) and K562 (insensitive), we performed cellular thermal shift assays (CETSAs) (Jafari et al., 2014) to track the ability of compounds to bind WDR5 in vivo (Figure S2). For both compounds, we observed a significant decrease in target engagement compared to their affinity for WDR5, with half-maximal effective concentration (EC50) values in cells being between 600- and 2000-fold higher than Kd values measured with purified WDR5 in vitro. Nonetheless, we found that the ability of C3 and C6 to bind WDR5 in cells tracks with compound potency and that there are no major differences in how each compound interacts with WDR5 in each cell type. Differential cellular response to these compounds, therefore, is not due to differences in target engagement. These data demonstrate that C3 and C6 inhibit MLLr lines in vitro in a manner that reflects their relative affinities for WDR5, and they suggest that p53 may be involved in the cellular response to these inhibitors.
WIN Site Inhibition Induces p53-Dependent Cell Death
We asked how C6 inhibits MV4:11 cells in culture. A time-course analysis revealed that inhibition of proliferation can be detected within a few days of treatment at the 50% growth inhibition (GI50) concentration (Figure 2A) and that between 2 and 6 days of treatment, there is a progressive decrease in cellular viability (Figure S3A). Analysis of cell-cycle distribution demonstrated that C6 caused a time-dependent increase in cells with a sub-G1 DNA content (Figures 2B and S3B), which is consistent with the induction of programmed cell death. Probing for more sensitive and direct hallmarks of apoptosis, we found that C6 promotes the caspase-mediated cleavage of poly (ADP-ribose) polymerase 1 (PARP-1) (Figure 2C), as well as the appearance of apoptotic cells, as measured by annexin V staining (Figure 2D). Notably, we could detect cleaved PARP-1 within 24 h following treatment, indicating that C6 begins to initiate apoptotic processes soon after exposure.
Figure 2. WIN Site Inhibition Induces Apoptosis and Kills Cells in a p53-Dependent Manner.

(A) MV4:11 cells were treated with DMSO, 2 μM C6, or C6nc; samples collected at the indicated time points; and live cells quantified via trypan blue exclusion. To prevent culture overgrowth, the DMSO- and C6nc-treated samples were replated at day 3 (“replate”) to the original starting density and treatment continued.
(B) Stacked bar graph showing the distribution of cell-cycle phases, determined by flow cytometry, in MV4:11 cells treated with DMSO, 2 μM C6nc, or C6 for the indicated times.
(C) Western blot for cleaved PARP-1 (P-cl), or histone H3, in lysates from MV4:11 cells treated with DMSO, 2 μM C6nc, or C6 for the indicated times.
(D) Bar graph showing the percentage of annexin V+ and propidium iodide-negative (PI−) cells in MV4:11 cells treated with DMSO, 2 μM C6nc, or C6 for the indicated days. Camptothecin (CPT) is a positive control for the induction of apoptosis.
(E) Western blot, showing the effects of DMSO, 2 μM C6, or C6nc (24 h), on p53 and p21 protein levels in MV4:11 cells. Histone H3 is a loading control.
(F) Western blot, showing p53 levels in MV4:11 cells treated with 2 μM C6nc or C6 for 24 h, and expressing either (1) a scrambled shRNA control (scr), (2) shRNA 427 against p53 (sh_427), or (3) shRNA 941 against p53 (sh_941).
(G) Dose-response curves for compound C6 and its negative control, C6nc, in MV4:11 cells expressing the indicated shRNAs. GI50 results from 3-day treatment with C6 are shown to the right of the appropriate curves.
(H) Western blot, showing the effects of DMSO, 3 μM C6, or C6nc (24 h), on p53 and p21 protein levels in Molm13 cells.
(I) Western blot, showing p53 levels in the clones of Molm13 cells that were CRISPR targeted with either an EGFP (clones 2e and 3e) or a p53 (clones 2p and 4p) guide RNA (gRNA). Cells were treated with C6 or C6nc at 3 μM for 24 h before analysis.
(J) Dose-response curves for compound C6 (3-day treatment) in the modified Molm13 cells described in (I). The GI50 values are 7 μM for clones 2e and 3e, 18 μM for clone 2p, and 15 μM for clone 4p.
(A, D, G, and J) Error bars represent SEM.
See also Figure S3.
Because p53 status appears to correlate with sensitivity to our WIN site inhibitors (Table 1), we asked whether p53 is induced by C6 and whether the cellular inhibition we observe in response to C6 is p53 dependent. Western blotting demonstrated that a 24-h treatment of MV4:11 cells with C6 moderately induces p53, as well as the canonical p53 target gene p21 (Figure 2E). To determine whether p53 status affects compound sensitivity, MV4:11 cells were transduced to express one of two short hairpin RNAs (shRNAs) against p53, or a scrambled shRNA control, and treated for 3 days with C6nc or C6. These shRNAs reduce steady-state p53 levels to different extents (Figure 2F), but both decrease the sensitivity to C6 (Figure 2G) and do so in a manner that correlates with the extent of p53 knockdown; the least effective shRNA against p53 (shRNA_427) increased the GI50 of C6 from ~2 μM to ~8 μM, whereas the most potent (shRNA_941) increased the GI50 to 15 μM. To confirm these findings, we used CRISPR-mediated genome editing to create p53 null clones of MV4:11 cells (Figure S3C) and found that these clones also have a reduced sensitivity to C6 (Figure S3D). Finally, we showed that p53 and p21 are also induced by 24-h C6 treatment in Molm13 cells (Figure 2H) and that CRISPR-generated p53 null Molm13 clones (Figure 2I) are less sensitive to C6 than clones in which p53 is intact (Figure 2J). Based on these findings, we conclude that WIN site inhibition induces p53 within 1 day of exposure and that a significant portion of the mechanism of cellular inhibition in response to C6 is p53 dependent.
WIN Site Inhibition Represses WDR5-Bound Genes Involved in Protein Synthesis
To illuminate the mechanism through which cells respond to WIN site inhibition, we performed RNA-sequencing (RNA-seq), examining the effects of a 3-day treatment of MV4:11 cells with C6 or C6nc (Figure S4A). Consistent with its lack of biological activity, C6nc had no significant effect on gene expression levels in these cells (Figure 3A). Compound C6, in contrast, resulted in a number of significant gene expression changes, increasing the expression of 72 genes and decreasing the expression of 462 genes (Figure 3A). Gene Ontology (GO) enrichment analysis failed to identify strong biological clustering among C6-induced genes (Figure S4B), but for repressed genes we identified two highly significant annotation clusters (Figure 3B). Cluster 1 is connected to protein synthesis and is composed of a subset of large and small ribosome protein genes (RPGs), some nuclear encoded mitochondrial RPGs, and translation initiation factors. Cluster 2 is connected to DNA replication and the cell cycle and includes cyclins and cyclin-dependent kinases, as well as DNA replication factors such as proliferating cell nuclear antigen (PCNA) and components of the mini-chromosome maintenance protein (MCM) complex. Gene set enrichment analysis (GSEA) (Subramanian et al., 2005) strengthened these connections, with highly significant (false discovery rate [FDR] q = 0.0) enrichments in pre-ranked Reactome gene sets connected to translation, DNA replication, the cell cycle, and cell-cycle checkpoints (Figure 3C), and GO gene sets connected to the ribosome, translation initiation, and DNA helicase activity (Figure S4C). From this analysis, we conclude that WIN site inhibition decreases the expression of specific sets of genes that are connected to protein synthesis and the cell cycle and DNA replication.
Figure 3. WIN Site Blockade Inhibits WDR5-Bound Genes Linked to Protein Synthesis.

(A) Table shows the number of transcripts significantly (FDR < 0.05) altered by 3 days of treatment of MV4:11 cells with 2 μM C6 or C6nc, compared to DMSO control.
(B) Gene Ontology (GO) enrichment clusters for genes significantly repressed by C6 treatment of MV4:11 cells, as determined by RNA-seq. Numbers in italics represent the number of repressed genes in each category.
(C) Highly significantly enriched (FDR q = 0.0) Reactome gene sets (defined in the Molecular Signatures Database), determined by gene set enrichment analysis (GSEA) of RNA-seq from MV4:11 cells treated with 2 μM C6.
(D) Overlap of genomic binding sites for WDR5 in MV4:11 cells, as determined by ChIP-seq with either the D9E1I or 429A anti-WDR5 antibodies.
(E) Top eight GO enrichment categories for genes bound by WDR5 in DMSO-treated MV4:11 cells.
(F) Distribution of WDR5 binding sites in MV4:11 cells, binned according to the distance from the annotated TSS. Output includes either all of the WDR5 binding events (Set-wide) or only those at RPGs (Ribosome). RGA, region-gene association.
(G) Venn diagram, showing overlap of genes bound by WDR5 (ChIP-seq), with genes induced by C6 treatment (RNA-seq) in MV4:11 cells.
(H) As in (G), except overlap is between the genes bound by WDR5 and those repressed by C6 treatment.
See also Figure S4.
It is reasonable to expect that the gene expression changes that we observe in response to WIN site inhibition are a combination of primary changes resulting from WIN site blockade and secondary changes that occur in response to the primary perturbations. It is also reasonable to expect that WDR5-bound genes will most likely be the primary targets of WIN site inhibitors. To focus our studies, therefore, we performed chromatin immunoprecipitation coupled to next-generation sequencing (chromatin immunoprecipitation sequencing [ChIP-seq]) to determine the location of WDR5 on chromatin in MV4:11 cells. Using a monoclonal antibody against WDR5 (D9E1I; Cell Signaling Technology), we tracked 158 high-confidence binding sites for WDR5 (Table S3), the majority of which were also detected by a different anti-WDR5 antibody (429A; Bethyl Laboratories) (Figure 3D; Table S3). These WDR5-binding sites are predominantly promoter proximal (Table S3), and among WDR5-bound genes we observed a strong biological clustering under GO terms connected to the ribosome (Figure 3E). Indeed, WDR5 is bound to a specific subset of RPGs, corresponding to genes encoding ~40% of the small and ~70% of the large ribosome subunit proteins. Binding of WDR5 to these genes occurs almost always within 500 bp downstream of the transcription start site (TSS; Figure 3F). We also observed WDR5 binding to genes encoding a subset of translation initiation factors (Table S3). This pattern of binding to specific RPGs is observed across disparate cell types (Figure S4D), suggesting that these RPGs are a major—and conserved—class of genes bound by WDR5. Comparing the ChIP-seq and RNA sequencing (RNA-seq) datasets, we observed that there is a strong tendency for WDR5-bound genes to be repressed by C6 treatment. Only 1 WDR5-bound gene is induced by C6 (Figure 3G), in contrast to 59 (37%) that are repressed (Figure 3H). Of the 59 repressed genes, 39 encode subunits of the ribosome, supporting the concept that these RPGs may be direct targets of WIN site blockade. Notably, we did not observe genes connected to the cell cycle or DNA replication (cluster 2) in the WDR5 ChIP-seq data, suggesting that changes in the expression of these genes may be a secondary consequence of WIN site inhibition.
Finally, we asked whether OICR-9429 (Grebien et al., 2015), a chemically distinct WIN site inhibitor, acts similarly to C6. OICR-9429 is less potent than C6, having a 3-day GI50 in MV4:11 cells of 31 μM (Figure S4E), compared to 2 μM for C6 (Table 1). When MV4:11 cells were treated with equal concentrations of OICR-9429 and C6, only C6 inhibited the transcription of RPGs (Figure S4F). When the concentrations were adjusted to reflect the relative GI50 values, however, OICR-9429 selectively inhibited the transcription of WDR5-bound RPGs (Figure S4F) and induced both p53 and p21 (Figure S4G). Thus, despite differences in potencies, repression of RPG transcription and induction of p53 are common actions of WIN site inhibitors.
Together, these findings expose a link between WDR5 and the ribosome protein genes and suggest that this class of genes may be a direct target of WIN site inhibitors. By extension, these findings also suggest that WIN site inhibitors may act in cells by disrupting the integrity of the protein synthesis machinery.
WIN Site Inhibition Promotes Translational Stress and Stimulates p53 Protein Synthesis
To determine whether WIN site blockade affects protein synthesis, we treated MV4:11 cells for 1–6 days with C6, pulsed with O-propargyl-puromycin (OPP) to label nascent polypeptide chains (Liu et al., 2012), and we quantified OPP incorporation by fluorescent OPP tagging and flow cytometry (Signer et al., 2014). As early as 1 day after treatment, C6 caused a measurable reduction in OPP incorporation (Figures 4A and S5A), with mean OPP fluorescence decreasing and shifting toward that observed in the presence of the protein synthesis inhibitor cycloheximide (CHX). The impact of C6 on protein synthesis capacity increased across the time course of the experiment, and at 6 days, roughly half of the cells in the C6-treated population incorporated OPP at levels similar to those of cells treated with CHX. Consistent with diminished translational capacity, C6-treated MV4:11 cells also displayed redistribution of nucleophosmin (NPM1) from the nucleolus to the nucleoplasm (Figures 4B and S5B), a characteristic of nucleolar stress (Russo and Russo, 2017). Thus, aligned with decreased expression in protein synthesis components, C6 imposes a choke on the translational capacity of MV4:11 cells and triggers nucleolar stress.
Figure 4. WIN Site Blockade Induces Translational Stress and Stimulates p53 Synthesis.

(A) Representative flow cytometry histograms showing Alexa Fluor 647-labeled OPP incorporation into nascent polypeptides of MV4:11 cells treated with DMSO, 2 μM C6nc, or C6. As a control for the inhibition of translation, CHX was added to cells 30 min before the addition of OPP.
(B) Quantification of the nucleolus:nuclear ratio of NPM1 in MV4:11 cells treated with 4 μM C6 (or C6nc) for 3 days. ns, no significant difference (p = 0.1). ****p < 0.0001. Data are shown as a box and whisker plot. Box extends from the 25th to 75th percentile with median marked by the middle line, whiskers extend from minimum to maximum point.
(C) MV4:11 cells were treated with DMSO, 2 μM C6, or 2 μM nutlin-3 for 24 h, after which CHX was added and proteins sampled at the indicated time points (CHX; in min). p53 and histone H3 (loading control, shown here for the C6 treatment) were detected by Western blotting.
(D) RT-qPCR analysis of the indicated mRNA levels on polysomal or monosomal fractions collected following the treatment of MV4:11 cells with 5 μM C6 or DMSO for 24 h. Data are shown as a box and whisker plot of relative mRNA changes of indicated genes in each fraction, relative to DMSO. Box extends from the 25th to the 75th percentile, with the median marked by the middle line; whiskers extend from minimum to maximum point; n = 3 experiments.
See also Figure S5.
We were curious to know the mechanism through which p53 is induced in response to C6. Nucleolar stress itself can induce p53, via disruption of the HDM2-p53 interaction that leads to stabilization of the p53 protein (Russo and Russo, 2017), but there are also indications that p53 protein synthesis can be induced when cap-dependent translation is perturbed (Harris et al., 2018). Because DNA damage can induce p53 at the levels of both synthesis and turnover, we first showed that C6 does not induce a robust DNA damage response, as measured by the accumulation of γ-H2AX foci (Figures S5C and S5D). Next, we performed CHX-chase assays to monitor the proteolytic turnover of p53 in response to C6. As a control, we compared the effects of C6 with those of nutlin-3, a small molecule inhibitor of the HDM2-p53 interaction (Nicolae et al., 2014). Here (Figure 4C), as expected, nutlin-3 increased the stability of p53 in response to CHX treatment. Compound C6, in contrast, had no detectable effects on p53 turnover. The induction of p53 that we observe in response to WIN site inhibition, therefore, is unlikely to be due to an increase in the metabolic stability of the protein.
To monitor for the induction of p53 translation, we asked how C6 treatment altered the amount of TP53 mRNA on polysomes versus monosome fractions (Yang et al., 2006). Here, we found that C6 promoted an accumulation of polysome-associated mRNAs for TP53 and a p53 target gene, TP53IPN1 (Figure 4D). The increase in TP53 mRNA on the polysome fraction, amidst a backdrop of decreased translation (Figure 4A), strongly implies that WIN site inhibition induces p53 via a selective induction of TP53 mRNA translation.
WIN Site Inhibitors Rapidly Displace WDR5 from Chromatin and Inhibit RPG Transcription
All of the studies of WIN site inhibitors to date have examined the transcriptional or epigenetic consequences of WIN site blockade over a relatively long time frame (e.g., >48 h). The low temporal resolution of these studies makes it difficult to separate cause from effect, and thus to determine the primary mechanism of action of the compounds. We reasoned that the primary transcriptional effects of WIN site inhibitors should manifest early, and therefore, we looked at transcriptional and epigenetic changes that occur within a few hours of compound treatment.
To monitor transcription, we used precision nuclear run-on sequencing (PRO-seq) (Kwak et al., 2013; Zhao et al., 2016), a global nuclear run-on approach, to ask how the distribution of active RNA polymerases is altered across the genome soon after WIN site blockade. MV4:11 cells were treated with C3 for 0, 15, 30, or 60 min and PRO-seq performed to follow changes in the distribution of active RNA polymerases. This analysis (Figures 5A and 5B) identified a set of 47 transcription units (45 loci) in which WIN site inhibition caused a significant decrease in gene body transcription. There were no instances in which C3 promoted an increase in transcription. In general, transcriptional changes at these repressed genes were significant (padj =0.0007–10−28) and modest (1.5- to 2-fold), and most were captured at the 15-min time point, indicating that C3 acts quickly to influence transcriptional processes. Almost all of the genes repressed by compound treatment are bound by WDR5 (Figure 5A), and a majority (~70%) encode ribosome subunits. Moreover, within the RPGs, we observed a consistent pattern of genes occupied by WDR5, scored as repressed by PRO-seq, and scored as repressed in RNA-seq experiments (Figure S6A), indicating that these genes are a direct and persistent transcriptional target of WIN site blockade.
Figure 5. WIN Site Inhibitors Act Rapidly to Displace WDR5 from Chromatin and Inhibit Transcription at WDR5-Bound Genes.

(A) Heatmap listing genes with significant changes in gene body-associated polymerases in MV4:11 cells treated with 36 μM compound C3, as determined by PRO-seq. The orange bar indicates whether WDR5 is bound to the locus. RPS17 (*) and RPL17(***) are listed twice, because two distinct National Center for Biotechnology Information Reference Sequence Database (RefSeq) IDs were called for those loci. LOC100506548 (**) is the read-through transcription from RPL37.
(B) Heatmaps displaying log2-transformed fold change of PRO-seq read counts in 200 bp bins ± 5 kb around the TSS of loci showing gene body changes after C3 treatment.
(C) ChIP-PCR analysis of WDR5 binding at 5 loci in MV4:11 cells treated with DMSO (DM), or 36 μM of C3 (or C3nc) for 4 h. Chromatin samples were immunoprecipitated with an anti-WDR5 antibody (D9E1l) or an immunoglobulin G (IgG) control. Data are presented as a percentage of the signal for the same amplicon in the input chromatin.
(D) Western blot, showing WDR5 distribution in the soluble (S2), soluble nuclear (S3), or insoluble chromatin (P3) fractions of MV4:11 cells treated for 4 h with DMSO or 36 μM of C3. Histone H3 is a control for the specificity of the insoluble chromatin fraction.
(E) ChIP-PCR analysis of FLAG (FL)-tagged WDR5, wild-type (WT), or a WIN site mutant (F133A), stably expressed in HEK293 cells. Vector cells are the negative control; ChIP was performed with an anti-FLAG antibody.
(F) Scatterplot of normalized average read counts for WDR5 binding peaks in DMSO-, C6nc-, and C6-treated MV4:11 cells. Peaks are ranked based on read counts in DMSO-treated cells.
(C and E) Error bars represent SEM.
See also Figure S6.
To look at accompanying epigenetic changes, we monitored histone H3K4 trimethylation, which is appropriate given that both C3 and C6 are potent inhibitors of MLL1 complex HMT activity (Table 1). After 4 h of C3 treatment, however—well after transcriptional effects are evident (Figure 5A)—there is little, if any, change in the H3K4me3 status of select WDR5-bound genes (Figure S6B). As a control in these experiments, WDR5 was examined under these same conditions, and we were surprised to see that C3 treatment resulted in a >10-fold reduction in WDR5 binding at all five loci (Figure 5C). These changes in chromatin binding were not due to changes in the levels of WDR5 (Figure S6C). Consistent with the ChIP results, treatment with C3 reduced the total amount of chromatin-bound WDR5 (Figure 5D; “P3” fraction), with a commensurate increase in WDR5 in the soluble (S2) and solubilized nuclear fractions (S3). To determine whether displacement of WDR5 from chromatin is a bona fide consequence of WIN site blockade, we engineered HEK293 cells to express FLAG epitope-tagged WDR5; WT, or a mutant in which phenylalanine 133—which makes critical interactions with the guanidinium of the arginine in the WIN motif—is changed to alanine (F133A). These forms of WDR5 were expressed equally, and the F133A mutant retained the ability to interact with RBBP5 (Figure S6D). When we examined chromatin binding by ChIP, however, we could not detect binding of the F133A WDR5 mutant to any of the loci tested (Figure 3E). The parallel effects of chemical and genetic blockade of the WIN site reveal that a prominent role of this site is to link WDR5 to chromatin.
Finally, we extended these analyses to our more potent compound C6 and performed ChIP-seq for WDR5 in MV4:11 cells treated for 4 h with either C6nc or C6 (Figure 5F). Compound C6nc had little impact on WDR5 binding. Compound C6, in contrast, resulted in a robust decrease in all detectable WDR5 binding events, with no measurable effect on WDR5 levels (Figure S6C). Based on these data, we conclude that the primary mechanism of action of our WIN site inhibitors is to rapidly displace WDR5 from chromatin, resulting in a commensurate decrease in the expression of a subset of WDR5 target genes.
DISCUSSION
The discovery of small molecule inhibitors of epigenetic proteins not only opens new opportunities for drug discovery but also allows for the interrogation of the mechanisms through which these proteins work. Here, we discovered potent small molecules that bind tightly to the WIN site of WDR5 and used these to explore the impact of WIN site blockade on the interaction of WDR5 with chromatin, transcriptional patterns, and cellular functions. Our studies reveal that WDR5 is bound to a relatively small cohort of loci, enriched in a specific subset of ribosome protein genes. Chemical perturbation of the WIN site displaces WDR5 from these loci, resulting in a rapid and persistent decrease in the expression of WDR5-bound RPGs, induction of translational stress, increased p53 translation, and activation of p53-dependent apoptosis. These findings demonstrate that WDR5 is a major regulator of ribosome protein gene transcription and forecast that WIN site inhibitors could have broad utility for cancer treatment.
One of the major conclusions from this study is that the WIN site links WDR5 to chromatin. This conclusion is supported by findings with both C3 and C6 and with the F133A WDR5 mutant, which is unable to bind WIN motif-containing peptides (Patel et al., 2008). Although the WIN site binds at least a half-dozen interaction partners (Guarnaccia and Tansey, 2018), none of these partners have been proposed to recruit WDR5 to chromatin. The ability of WIN site blockade to evict WDR5 from its target genes, however, supports the idea that WDR5 is linked to chromatin through the WIN site, either indirectly or by engaging a WIN motif in a chromatin-resident protein. If the latter is correct, then this protein may be one of the characterized WIN site binders, but as there are thousands of proteins encoded in the human genome that carry the core WIN motif (A-R-A/S/T), it is likely that the factor(s) responsible for tethering WDR5 to chromatin is yet to be identified. Clearly, a grasp of the complete repertoire of WIN site binders is needed to fully recognize the mechanism and utility of small molecule WIN site inhibitors.
Critical in defining the primary mechanism of action of WIN site inhibitors is to determine which genes are directly affected by WIN site blockade. Our experiments with both C3 and C6 clearly point to a specific subset of RPGs as targets of WIN site inhibition. The extensive overlap between RPGs identified as targets of C3 in PRO-seq and those identified as targets of C6 in RNA-seq reveals a highly consistent mode of action of these two compounds. The consistency in their mode of action is solidified by the fact that both C3 and C6 displace WDR5 from chromatin and by our observation that a distinct WIN site inhibitor, OICR-9429, shows the same selectivity in RPG inhibition. Coupled with the recurring and highly consistent binding of WDR5 to a select subset of RPGs in different cell types, we conclude that these RPGs are a predominant biological target of WDR5 and thus of WDR5 inhibitors.
The importance of ribosomes and altered ribosome biogenesis to cancer has long been known, but the links between WDR5 and RPGs have not previously been reported. The Cancer Dependency Map initiative (Tsherniak et al., 2017), which correlated results from ~500 genome-wide loss-of-function screens, reported that 6 of the top 10 correlated dependency profiles for WDR5 are RPGs, supporting the notion that WDR5 is meaningfully connected to ribosome homeostasis. Hyperactive ribosome synthesis is a hallmark of many cancers (Pelletier et al., 2018), and WDR5 has the potential to mediate altered RPG expression in this context, either by its own overexpression (e.g., Chen et al., 2015; Dai et al., 2015; Tan et al., 2017) or by working with oncoproteins such as MYC (Carugo et al., 2016; Thomas et al., 2015). What is difficult to reconcile, however, is why only a defined subset of RPGs are under the control of WDR5 and what this means for both normal cellular activities and altered ribosome function in cancer. It is possible that the specific RPGs that are regulated by WDR5 have some common property, as yet unknown, that requires their coordinated expression via WDR5. Alternatively, perhaps the biased distribution of WDR5 across the RPGs acts as a nuclear sensor of oncogenic activity, an early surveillance mechanism that induces ribosome subunit imbalance—and triggers a pro-apoptotic stress response—when WDR5 (or factors that work through WDR5) levels rise in a cancer cell. Regardless of the significance of the WDR5-RPG connection, however, it creates an opportunity to induce a translational choke and trigger p53-dependent apoptosis in cancer cells, as discussed below.
The utility of WIN site inhibition in the context of MLLr cancers is well established, and our findings with C3 and C6 strengthen this connection. Exactly why MLLr cells are sensitive to WIN site blockade needs further study, but likely relates to the ability of MLL-fusion oncoproteins to induce the transcription of genes connected to ribosomal and nucleolar processes, which has recently been recognized as an important and distinct part of their transcriptional repertoire (Garcia-Cuellar et al., 2016). The discrepancy between the affinity of these inhibitors for WDR5 in vitro and the concentrations needed to engage WDR5 in cells and elicit a biological response demonstrates that additional strides need to be made to increase the permeability of these inhibitors and/or their ability to access WDR5 when it is complexed with other proteins. Nonetheless, the mechanism of action we describe for these compounds, which is likely shared by other WIN site inhibitors, does have important therapeutic implications that transcend MLLr cancers.
For example, the overexpression of WDR5 is reported in numerous malignancies, including leukemias (Ge et al., 2016), breast cancer (Dai et al., 2015), and bladder cancer (Chen et al., 2015). For cancers with frank WDR5 overexpression, therefore, the ability of our inhibitors to displace WDR5 from chromatin predicts that the functional impact of WDR5 overexpression in these cancers could be attenuated by pharmacological WIN site blockade. Moreover, the mechanism of p53 induction in response to WIN site inhibition, which is independent of changes in p53 protein stability, may also offer unique therapeutic opportunities, as this is different from the effects of inhibitors of the HDM2-p53 interaction, which have had mixed success in the clinic (Stegh, 2012).
Although in this context WIN site inhibitors kill MLLr cells independent of changes in H3K4 methylation, we note that our WIN site compounds are potent inhibitors of MLL1-driven HMT activity. The half-maximal inhibitory concentration (IC50) value for C6 is ~20 nM compared to 320 nM for MM-401 (Cao et al., 2014), with at least a 250-fold window of selectivity for MLL1 over other MLL/SET complexes. The inhibition of MLL1-mediated H3K4 methylation has been shown to be a viable strategy for killing cancer cells that express mutant forms of C/EBPa (Grebien et al., 2015) and p53 (Zhu et al., 2015). In these cancers, as well as others that are MLL1 dependent, the ability of these inhibitors to specifically target the HMT activity of MLL1 complexes may be exploited for therapeutic gain.
Perhaps the most intriguing application of WIN site inhibitors, however, relates to their ability to inhibit RPG transcription. The concept of targeting ribosome biosynthesis has gained momentum in recent years as a viable strategy to treat cancer (Pelletier et al., 2018), and may hold promise in other diseases of ribosome dysfunction, such as myelodysplastic syndrome (Rinker et al., 2016). Most of the successes in this area have centered on the inhibition of ribosomal RNA transcription (Bruno et al., 2017). While these strategies progress, a complementary approach of targeting RPG synthesis via WIN site blockade could have value. It is possible, for example, that the specific pattern of RPG imbalance caused by WIN site inhibitors has advantages over rRNA inhibition. As opposed to a general inhibition of ribosome biogenesis, WIN site inhibitors will only directly affect the expression of those RPGs to which WDR5 is bound. Thus far, this group of RPGs appears to be conserved, and if this conservation withstands further challenge, it will be possible to predict which RPGs will respond to WIN site blockade. It is clear that ribosome dysgenesis in cancer cells is not random and that specific patterns of RPG alterations occur that can distinguish normal from malignant cells and one type of cancer from another (Dolezal et al., 2018). By systematic analysis of the relationship between altered RPG expression and cellular sensitivity to WIN site inhibition, it may be possible to develop targeted WIN site inhibitor therapies matched to specific patterns of ribosome protein gene alterations in cancer patients.
STAR★METHODS
CONTACT FOR REAGENT AND RESOURCE SHARING
Further information and requests for resources and reagents should be directed to and will be fulfilled by the Lead Contact, William Tansey (william.p.tansey@vanderbilt.edu).
EXPERIMENTAL MODEL AND SUBJECT DETAILS
Cell lines
MV4:11 (male), K562 (female), HL60 (female), Molm13 (male), HEL (male), SET-2 (female), NOMO-1 (female), GDM-1 (female), and RN2 (female) cell lines were cultured in RPMI-1640 media with 10% FBS. THP-1 (male) cells were grown in RPMI-1640 media with 0.05 mM 2-mercaptoethanol and 10% FBS. MA93 Ras (male) and MA93 FLT3/ITD (male) cells were grown in IMDM media with 20% FBS. MA93 (male) cells were grown in IMDM media with 20% FBS, and 10 ng/mL recombinant human SCF/TPO/FLT3L/IL3/IL6. MONO-MAC-6 (male) cells were grown in RPMI with 10% FBS, non-essential amino acids and OPI media supplement. HEK293T (female) cells, and their derivatives, were maintained in DMEM supplemented with 10% FBS. All media was supplemented with 100 IU/ml Penicillin and 100 μg/ml streptomycin. All cell lines were cultured at 37°C with 5% CO2 and split every 2–4 days; suspension cells were maintained at a cell density of between 1 3 105 and 1 × 10⁶ cells/ml.
METHOD DETAILS
Protein Expression and Purification
Human WDR5 (aa: 22–334) was cloned into a modified pET vector (pBG104) with a 6xHis-SUMO tag present at the N terminus. The plasmid was then transformed into E. coli BL21 (DE3) cells. One hundred milliliters of LB starter was used to inoculate a 10 l fermentation culture (BioFlo 415, New Brunswick Scientific), grown at 37°C. Fermentation growth media contained KH2PO4 (4 g/L), K2HPO4 (6 g/L), Na2SO4 (2 g/L), K2SO4 (1 g/L), NaCl (0.5 g/L), Yeast Extract (5 g/L), glycerol (2 ml/L), Antifoam (0.2 ml/L), 5% LB medium, glucose (25 g/L), MgCl2 (2 mM), CaCl2 (0.1 mM), NH4Cl (2.5 g/L), and Kanamycin (50 mg/ml). When the cell density reached OD600 = 2.0, the temperature was lowered to 30°C, and WDR5 expression induced by treatment with 1 mM isopropyl-b-D-thiogalactoside (IPTG) overnight. Cell pellets were collected, dissolved in lysis buffer containing 1XPBS plus 300 mM NaCl, 20 mM imidazole, 5 mM BME, and 10% glycerol, and lysed by homogenization (APV-2000, APV). The lysate was cleared by centrifugation, filtered, and then applied to the Ni-column (140 mL, ProBond, Invitrogen). Bound protein was eluted using an imidazole gradient (0–300 mM). The His-SUMO-tag was cleaved by SUMO protease during dialysis and subsequently eliminated through a second Ni-column. WDR5 protein was then purified by size-exclusion chromatography (HiLoad 26/60, Superdex 75, GE Healthcare) using crystallization buffer consisting of 20 mM HEPES, pH 7.0, 250 mM NaCl, and 5 mM DTT. The purity of protein was checked using SDS–PAGE. Purified WDR5 was then concentrated to 10 mg/mL, and was stored at −80°C.
Protein Crystallization, Data Collection, and Structure Refinement
WDR5 apo- and co-crystals were obtained at 18°C using the hanging drop method. The crystallization condition was 0.1 M Bis-Tris pH 6.0, 0.2 M ammonium acetate, 28% to 32% PEG3350. A soaking method was applied for some of the compounds using WDR5 apo-crystals. Crystals were flash frozen directly in liquid nitrogen. Diffraction data were collected on the Life Sciences Collaborative Access Team (LS-CAT) 21-ID-D and G beamlines at the Advanced Photon Source (APS) at Argonne National Laboratory. Diffraction data were indexed, integrated, and scaled using HKL2000 (Otwinowski and Minor, 1997). Molecular replacement was applied using Phaser44 as implemented in CCP4.45 (Winn et al., 2011) using a published structure (PDB code 3EG6). Refinement of the structural models was performed using PHENIX (Adams et al., 2002) along with rounds of manual model building in COOT (Emsley and Cowtan, 2004). All structure images were prepared with PyMOL. A summary of the final refinement statistics for structures including compounds C1–6 can be found in the Table S2.
FPA and TR-FRET Competition Assays
Fluorescein isothiocyante (FITC) labeled MLL peptide (FITC-GSARAEVHLRKS) and 10-mer-Thr-FAM (ARTEVHLRKS-(Ahx-Ahx)(Lys-(5-FAM))) (Karatas et al., 2010) were purchased from GeneScript and used without additional purification. Anisotropy, fluorescence, and TR-FRET emissions were recorded on a BioTek Cytation 3 instrument.
For the FITC-MLL FPA peptide assays, FITC-MLL peptide (FITC-GSARAEVHLRKS) was used at 50 nM, while WDR5 was added at the Kd value of the protein:peptide interaction (WDR5–WIN Kd = 2.5 μM). Stock compounds were dispensed in 384-well source plates as 30 mM solutions in DMSO. An Echo Liquid Handler was used to distribute the compounds to the assay plates (384-well, black, flat-bottom; Greiner) in a 10-point, 3-fold dilution, scheme in a final volume of 50 μL using a top concentration of 250 mM. Both the top concentration and the dilution scheme were adjusted to fit the potency of the compounds to a lower Ki limit of ~1 μM. For the FITC MLL assay, 2.5 μM WDR5 and 50 nM FITC-MLL peptide, in an assay buffer containing 1X Phosphate Buffered Saline (pH 6.0), 300 mM NaCl, 0.5mM TCEP, and 0.1% CHAPS, were added to all compound-containing wells. To columns 1 and 23 (positive control, 100% inhibition) 2 μl of 50 nM FITC-MLL peptide alone in assay buffer was added. The assay performed with an average Z’ value of 0.5 and was tolerant up to 5% DMSO. For compounds with an IC50 < 2.0 μM and Ki < 1 μM, the 10-mer-Thr-FAM probe and FPA protocol described below was used for enhanced sensitivity.
For the 10-mer-Thr-FAM peptide TR-FRET assay, LanthaScreen Elite Tb-anti His antibody (Tb-Ab) was purchased from Thermo-Fisher and used at 1 nM. The 10-mer-Thr-FAM peptide was used at 150 nM, while WDR5-His-SUMO tag protein was used at 2 nM. The working assay buffer composition was modified to pH 7.2 (1X Phosphate Buffered Saline, 300 mM NaCl, 0.5 mM TCEP, 0.1% CHAPS). Stock compounds were dispensed to a white, flat-bottom OptiPlate plate (PerkinElmer) using an Echo Liquid Handler. A 10-point, 5-fold dilution scheme with a top concentration of 5 μM (0.003 nM low concentration) was used with a final volume of 20 μl. Both the top concentration and the dilution scheme was adjusted to fit the anticipated potency of the compounds. Using the above probe concentration and assay conditions, the calculated lower Ki limit was ~0.060 ± 0.020 nM. Positive control wells (0% displacement) consisted of 10-mer-Thr-FAM probe and WDR5/Tb antibody mix occupying columns 2 and 24, while negative control wells (100% displacement) consisting of the protein/terbium antibody mix alone occupy columns 1 and 23. The assay performed with an average Z’ value of 0.7 and was found to be tolerant to up to 5% DMSO.
For IC50 determinations, plates were covered, shielded from light, and incubated for 1h at room temperature with rocking. For the FPA assay measurements, anisotropy was measured using an excitation wavelength of 480 nm and an emission wavelength of 535 nm. For the TR-FRET assay, measurement plates were excited at a wavelength of 340 nm, and emission wavelengths of 495 and 520 nm were used. The ratio of the 520/495 wavelengths were used to assess the degree of the FRET signal and resulting peptide displacement. TR-FRET plate positive control wells include columns 2 and 24 containing 10-mer-Thr-FAM peptide, His-SUMOWDR5, and Tb-anti-His antibody to measure maximum signal from the FRET response. The change in anisotropy (FPA) or 520 / 495 emission ratio (TR-FRET) was used to calculate an IC50 (inhibitor concentration at which 50% of the bound peptide is displaced) by fitting the inhibition data using XLFit software (Guilford, UK) to single-site binding model. This was converted into a binding inhibition/displacement constant (Ki) using the formula (Nikolovska-Coleska et al., 2004):
where [I]50 is the concentration of the free inhibitor at 50% inhibition, [L]50 is the concentration of the free labeled ligand at 50% inhibition, [P]0 is the concentration of the free protein at 0% inhibition, and Kdpep represents the dissociation constant of the FITC-MLL or 10-mer-Thr-FAM probe.
Surface Plasmon Resonance
SPR measurements were performed at XTAL Biosciences with compounds and purified WDR5 provided by us. SPR measurements were performed using a BiOptix 404pi enhanced surface plasmon resonance (eSPR) instrument. Compounds C3 and C6 were prepared as DMSO soluble stock solutions at 30 mM DMSO. His-SUMO-WDR5(22–334) protein was placed onto two channels (in parallel). The conditioned biosensor NTA-biosensor chip was first charged with Ni2+ to allow for pre-concentration and then chemically activated with EDC/NHS. His-tagged protein ligand at 100 nM in running buffer (PBS, 2 mM DTT, 50 μM EDTA, 0.05% Tween-20, with no DMSO) was covalently attached to the dextran surface via amide coupling at 5 μL/min for 100 s. The His-SUMOWDR5(22–334) protein (PBS + 2mM DTT buffer) was then loaded onto channel 3 and channel 4 of the biosensor chip at 7,000 RU, leaving channels 1 and 2 unbound as reference. A solution of 1 M ethanolamine was injected for 1200 s at 20 μL/min to block any free reactive carboxyls across all channels. For analyte binding, the BiOptix was run in 2×2 mode. Analyte compounds C3 and C6 were first passed over one of these reference channels before coming into contact with the bound protein on channels 3 or 4. An 8-point, 3-fold serial dilution assay was performed in duplicate for compounds C3 and C6 starting at 100 nM and going down to 90 pM. DMSO stocks of compounds were diluted in running buffer with a final 1% DMSO. Association times were increased from 240 to 800 s by decreasing the flow rate to 30 μL/min. An 800 s dissociation phase followed. Saturation was achieved in order to measure steady state binding as well as kinetics. Buffer blanks were inserted after every forth injection. A series of five DMSO standards between 0.5% and 1.5% were included with each run to correct for bulk refractive index. Sensorgrams were analyzed using Scrubber 2 software with a double reference to determine the interaction parameters KD, kon, and koff. The reference channel was first subtracted from the ligand channel. Next the bulk shift was corrected for using the DMSO standards included with each run.
The internal blank injections were then averaged and subtracted from compound injections. Binding data was fit to a 1:1 Langmuir model. Each sensorgram is fit to a standard scale.
Histone Methyltransferase Assays
HMT inhibition activity assays were performed at Reaction Biology Corp. Details are under “Critical Commercial Assays” in the Key Resources Table.
KEY RESOURCES TABLE
| REAGENT or RESOURCE | SOURCE | IDENTIFIER |
|---|---|---|
| Antibodies | ||
| Rabbit polyclonal Anti-gamma H2A.X (phospho S139) | Abcam | Cat# ab11174; RRID:AB_297813 |
| Mouse monoclonal Anti-B23 (NPM) antibody | Sigma | Cat# B0556; RRID:AB_2154872 |
| Alexa Fluor488 goat anti-Rabbit ReadyProbes Reagent | Thermo | Cat# R37116; lot# 1572550; RRID:AB_2556544 |
| Alexa Fluor488 goat anti-mouse IgG | Thermo | Cat# A11001; lot# 1810918; RRID:AB_2534069 |
| Rabbit polyclonal anti-Cleaved PARP (Asp214) antibody | Cell Signaling Technology | Cat# 9541S; lot# 15; RRID:AB_331426 |
| Rabbit polyclonal anti-Histone H3 antibody (western blot loading control) | Cell Signaling Technology | Cat# 9715S; lot# 20 |
| Normal Rabbit IgG antibody (ChIP) | Cell Signaling Technology | Cat# 2729S; lot# 7; RRID:AB_1031062 |
| Rabbit anti-WDR5 DE91I antibody (ChIP and western blot) | Cell signaling Technology | Cat# 13105; lot# 1; RRID:AB_2620133 |
| Rabbit anti-Tri-Methyl-Histone H3 (Lys4) Antibody (ChIP) | Cell Signaling Technology | Cat# 9727S; lot# 2; RRID:AB_561095 |
| Mouse anti-p53 Antibody DO-1 (western blot) | Santa Cruz Biotechnology | Cat# sc-126; lot# B2317; RRID:AB_628082 |
| Rabbit anti-p21 Waf1/Cip1 (12D1) antibody (western blot) | Cell Signaling Technology | Cat# 2947; lot# 9; RRID:AB_823586 |
| anti-p53 antibody, rabbit monoclonal | Cell Signaling Technologies | Cat# 32532S |
| anti-WDR5 antibody, rabbit polyclonal | Bethyl Laboratories, Inc. | Cat# A302–429A; RRID:AB_1944302 |
| anti-GAPDH-HRP | Pierce | Cat# MA5–15738-HRP; RRID:AB_2537659 |
| Goat anti-Rabbit IgG Secondary Antibody HRP | Pierce | Cat# 31463 |
| Anti-rabbit HRP linked IgG antibody | Cell Signaling Technology | Cat# 7074S |
| Anti-FLAG M2 Affinity Gel | Sigma-Aldrich | Cat# A2220; RRID:AB_1006303 |
| LanthaScreen Elite Tb-anti His antibody | Thermo | Cat# PV5895 |
| Protein-A Agarose Beads | Roche | Cat# 11134515001 |
| Chemicals, Peptides, and Recombinant Proteins | ||
| Complete, EDTA-free Protease Inhibitor Cocktail | Roche | Cat# 11873580001 |
| Formaldehyde | Sigma-Aldrich | Cat# 47608 |
| Recombinant Murine IL-3 | PeproTech | Cat# 213–13 |
| AC220 | Selleck Chemicals | Cat# S1526 |
| C3 | This study | VU0660638 |
| C3nc | This study | VU0807192 |
| C6 | This study | VU0808641 |
| C6nc | This study | VU0817566 |
| DMSO | Sigma | Cat# D8418 |
| NuPAGE sample reducing agent (10X) | ThermoFisher | Cat# NP0009 |
| NuPAGE 4X LDS sample buffer | ThermoFisher | Cat# NP0008 |
| Protease inhibitor cocktail | Sigma | Cat# P8340 |
| Tween-20 | Sigma | Cat# P2287 |
| SuperSignal West Dura Extended Duration Substrate | ThermoFisher | Cat# 34076 |
| KAPA SYBR FAST qPCR Master Mix 2X Universal | Kapa Biosystems | Cat# KK4602 |
| WDR5 (aa 22–334) | This study | N/A |
| MLL peptide (FITC-GSARAEVHLRKS) | GenScript | N/A |
| Thr-FAM peptide (ARTEVHLRKS-(Ahx-Ahx)(Lys-(5-FAM))) | GenScript | N/A |
| MuLV reverse transcriptase | Life Tech | Cat# N8080018 |
| O-Propargyl-puromycin (OPP) | Thermo | Cat# C10459 |
| Alexa Flour647-Azide | Thermo | Cat# A10277 |
| Annexin V Binding Buffer | Invitrogen | Cat# V13246 |
| Alexa Flour488-conjugated Annexin V | Thermo | Cat# A13201 |
| Propidium iodide | Sigma | Cat# 4864 |
| Direct-zol RNA MiniPrep kit | Zymo Research | Cat# R2050 |
| Nutlin-3 | Santa Cruz Biotechnology | Cat# Sc-45061 |
| Recombinant human SCF | PeproT ech | Cat# 300–07 |
| Recombinant human TPO | PeproT ech | Cat# 300–18 |
| Recombinant human IL3 | PeproT ech | Cat# 200–03 |
| Recombinant human IL6 | PeproT ech | Cat# 200–06 |
| OPI media supplement HYBRI-MAX | Sigma | Cat# O5003–1VL |
| Cycloheximide | RPI | Cat# C81040–1.0 |
| Camptothecin | Selleck Chemicals | Cat# S1288 |
| Actinomycin D | Sigma | Cat# A1410 |
| DRAQ5 | Thermo | Cat# 62254 |
| Kanamycin | Research Products International | Cat# K22000 |
| OICR-9429 | Selleck Chemicals | Cat# S7833 |
| Isopropyl- β-D-thiogalactoside (IPTG) | Research Products International | Cat# I56000 |
| N-[3-(2,4-dichlorophenoxy)propyl]-4,5-dihydro-1H-Imidazol-2-amine, (C1) | Enamine | Cat# Z1090036110 |
| N-(1-(3-Chlorophenyl)ethyl)-3-(((4,5-dihydro-1H-imidazol-2-yl)amino)methyl)benzamide, (C2) | This study | N/A |
| 3-(((4,5-dihydro-1H-imidazol-2-yl)amino)methyl)-N-(3,5-dimethoxybenzyl)-4-fluorobenzamide, (C3) | This study | N/A |
| 3-(((4,5-dihydro-1H-imidazol-2-yl)amino)methyl)-N-(3,5-dimethoxybenzyl)-2-fluorobenzamide, (C3nc) | This study | N/A |
| 5-(1H-imidazol-1-ylmethyl)furan-2-carboxylic acid, (C4) | Asinex Ltd. | Cat# BAS 06502679 |
| 3-((1H-Imidazol-1-yl)methyl)-N-(3,5-dichlorobenzyl)benzamide, (C5) | This study | N/A |
| N-(3,4-Dichlorobenzyl)-3-(6-fluoro-2-methylpyridin-3-yl)-5-((2-imino-3-methyl-2,3-dihydro-1H-imidazol-1-yl)methyl)benzamide, (C6) | This study | N/A |
| N-(3,4-dichlorobenzyl)-3-(6-fluoro-2-methylpyridin-3-yl)-4-((2-imino-3-methyl-2,3-dihydro-1H-imidazol-1-yl)methyl)benzamide, (C6nc) | This study | N/A |
| Critical Commercial Assays | ||
| CellTiter-Glo Proliferation assay kit | Promega | Cat# G7572 |
| CellTiter 96 AQueous MTS Reagent Powder | Promega | Cat# G1112 |
| Gibson Assembly Cloning Kit | New England Biolabs | Cat# E5510S |
| DNA Ultra II Prep Kit for Illumina | New England Biolabs | Cat# E7645 |
| Click-it Cell Reaction Buffer Kit | Thermo | Cat# C10269 |
| MLL1 HMT Assay | Reaction Biology | Cat# MLL1 |
| MLL2 HMT Assay | Reaction Biology | Cat# MLL2 |
| MLL3 HMT Assay | Reaction Biology | Cat# MLL3 |
| MLL4 HMT Assay | Reaction Biology | Cat# MLL4 |
| Set1A Complex HMT Assay | Reaction Biology | Cat# HMT-15–116 |
| SET1B Complex HMT Assay | Reaction Biology | Cat# HMT-15–117 |
| Deposited Data | ||
| X-ray crystallography | This study | 6DY7, 6EY1, 6E22, 6E1Z, 6DYA, and 6E23 |
| Genomic (Chip-, RNA-, and PRO-Seq) | This study | GSE115377 |
| Experimental Models: Cell Lines | ||
| MV4:11 | ATCC | Cat# CRL-9591; RRID:CVCL_0064 |
| Molm13 | DSMZ | Cat# ACC554; RRID:CVCL_2119 |
| K562 | ATCC | Cat# CCL-243; RRID:CVCL_0004 |
| HEK293 FGH | This study | N/A |
| HEK293 FL-WDR5 | This study | N/A |
| HEK293 FL-F133A WDR5 | This study | N/A |
| SET-2 | DSMZ | ACC-608 |
| HEL | ATCC | TIB-180 |
| NOMO-1 | DSMZ | ACC-542 |
| MA93 | Wei et al., 2008 | N/A |
| MA93 ras | Wunderlich et al., 2013 | N/A |
| MA93 FLT3/ITD | Wunderlich et al., 2013 | N/A |
| RN2 | Zuber et al., 2011 | N/A |
| GDM-1 | ATCC | Cat# ATCC CRL-2627; RRID:CVCL_1230 |
| MONO-MAC-6 | DSMZ | Cat# ACC 124; RRID:CVCL_1426 |
| THP-1 | ATCC | TIB-202 |
| Oligonucleotides | ||
| See Table S4 for oligonucleotide sequences | N/A | N/A |
| Recombinant DNA | ||
| pBabe-PURO | Morgenstern and Land, 1990 | N/A |
| pET6xHis-SUMO-WDR5 | This study | N/A |
| pcDNA3.1-FLT3-C-(K)DYK | GenScript | Cat# OHu20276 |
| pBabe-FLT3-ITD-C-(K)DYK-PURO | This Study | N/A |
| pCL10A1 | Novus Biologicals | Cat# NBP2–29542 |
| pLKO-p53-shRNA-941 | Kim et al., 2007 | Addgene plasmid #25637 |
| pLKO-p53-shRNA-427 | Kim et al., 2007 | Addgene plasmid #25636 |
| Scramble shRNA pLKO.1 | Sarbassov et al., 2005 | Addgene plasmid #1864 |
| pLentiCRISPRv2 | Addgene | Addgene plasmid #14748 |
| pLentiCRISPRv2-TP53 | This study | N/A |
| pLentiCRISPRv2-EGFP | This study | N/A |
| pLKO.3G | Addgene | Addgene plasmid #14748 |
| pLKO.3G-p53-shRNA-941 | This study | N/A |
| pLKO.3G-p53-shRNA-427 | This study | N/A |
| pLKO.3G-shRNA-scramble | This study | N/A |
| pMD2 (VSV-G Env) | Provided by A. Reynolds | N/A |
| pCMV-PAX2 (GAG and POL) | Provided by A. Reynolds | N/A |
| Software and Algorithms | ||
| FlowJo v10 | FlowJo, LLC | https://www.flowjo.com/ |
| BD FACSDDiva 8.0 | BD Biosciences | http://www.bdbiosciences.com/us/instruments/research/software/flow-cytometry-acquisition/bd-facsdiva-software/m/111112/overview |
| Prism 7 | GraphPad | https://www.graphpad.com/scientific-software/prism/ |
| Fiji version 1.0 | Schindelin et al., 2012 | https://fiji.sc/ |
| HKL2000 | HKL Research, Inc. | https://www.hkl-xray.com/download-instructions-hkl-2000 |
| CCP4.45 | CCP4 | https://www.ccp4.ac.uk |
| Phenix | Phenix | https://www.phenix-online.org |
| Coot | MRC Laboratory of Molecular Biology | http://www2.mrc-lmb.cam.ac.uk/personal/pemsley/coot/ |
| PyMol | Schrodinger, LLC | https://pymol.org/2/ |
| XLFit | ID Business Solutions | https://www.idbs.com/excelcurvefitting/ |
Compound Synthesis and Characterization
Compounds C1 and C4 are were purchased from commercial vendors and were derived as hits from the Vanderbilt Fragment Library. Compound 1 (CAS: 1334103-40-0), Compound 4 (CAS: 876709-30-7).
Compound C2 – N-(1-(3-Chlorophenyl)ethyl)-3-(((4,5-dihydro-1H-imidazol-2-yl)amino)methyl)benzamide
3-(N-Boc-aminomethyl)benzoic acid (251 mg, 1.0 mmol) and DIPEA (522 μL, 3.0 mmol) were taken in CH2Cl2 (5 mL) and cooled to 0°C. HATU (570 mg, 1.5 mmol) was added and the mixture stirred for 30 mins before the addition of 1-(3-chlorophenyl)ethanamine (156 μL, 1.1 mmol). The solution was allowed to warm to r.t. and stirred for 16 h. Upon completion, the mixture was diluted with CH2Cl2 (5 mL) and washed with H2O (10 mL), concentrated, and purified by flash column chromatography (12 g, 0 – 40% EtOAc in hexanes) to afford the intermediate tert-Butyl (3-((1-(3-chlorophenyl)ethyl)carbamoyl)benzyl)carbamate as a colorless solid (228 mg, 0.59 mmol, 59%). This was dissolved in CH2Cl2 (3 mL), TFA (1.5 mL) was added and the mixture was stirred at r.t. for 2 h. The mixture was concentrated in vacuo to afford the crude amine intermediate as a TFA salt (assumed quantitative). The amine was dissolved in anhydrous THF (2 mL) under an inert atmosphere and 2-methylthio-2-imiazoline hydroiodide (120 mg, 0.49 mmol) and DIPEA (209 μL, 1.2 mmol) were added. The mixture was stirred at 40°C for 16 h, venting through a scrubber of NaOH. Upon completion, the solution was concentrated, taken in EtOAc and washed with NaOH (2 M), brine, and purified by preparative HPLC. The combined fractions were re-dissolved in EtOAc and washed with sat. aq. K2CO3 and dried (MgSO4) to afford C2 as the free base. 1H NMR (600 MHz, MeOH-d4) H 7.83 – 7.79 (m, 1H), 7.80 – 7.76 (m, 1H), 7.52 – 7.47 (m, 2H), 7.42 – 7.38 (m, 1H), 7.33 – 7.29 (m, 2H), 7.26 – 7.22 (m, 1H), 5.20 (q, J = 7.1 Hz, 1H), 4.45 (s, 2H), 3.71 (s, 4H), 1.56 (d, J = 7.1 Hz, 3H); LCMS (ESI) tR = 0.85 min, m/z = 357.3 [M+H]+; ≥ 95% (215, 254 nm); HMRS (ESI-TOF) calculated for C19H22ClN4O = 357.1477 [M+H]+, observed 357.1477.
Compound C3 – 3-(((4,5-dihydro-1H-imidazol-2-yl)amino)methyl)-N-(3,5-dimethoxybenzyl)-4-fluorobenzamide
To a solution of methyl 4-fluoro-3-methylbenzoate (5.0 g, 29.7 mmol) in CCl4 (60 mL) was added NBS (5.5 g, 30.9 mmol) and AIBN (0.20 g, 1.20 mmol). The mixture was heated to reflux for 18 h, then cooled, filtered and the filtrate was concentrated. The crude material was purified by flash column chromatography to afford methyl 3-(bromomethyl)-4-fluorobenzoate (3.6 g, 14.6 mmol, 49%). A portion of the brominated intermediate (2.0 g, 8.10 mmol) was dissolved in a 90% MeOH/water solution (40 mL) and to which sodium azide (0.78 g, 12.1 mmol) was added. The mixture was then heated to reflux for 2 h. The solution was cooled, concentrated, re-dissolved in CH2Cl2, and extracted with H2O. The organic phase was dried (MgSO4) and concentrated to afford the crude azide intermediate. The intermediate was dissolved in a solution of THF (20 mL), MeOH (5 mL) and water (3 mL) and then treated with LiOH (2.0 M, 2.2 mL, 4.4 mmol) for 2 h at r.t.. The solvent was removed under reduced pressure, diluted with water, and acidified with HCl (1 N) to a pH = 1. The resulting solid was collected by filtration, washed with water, and dried under high vacuum to afford 3-(azidomethyl)-4-fluorobenzoic acid (1.58 g, quant.), which was used without further purification. A portion of the benzoic acid intermediate (195 mg, 1.0 mmol) in DMF (4 mL) was cooled to 0°C before the addition of DIPEA (435 mL, 2.5 mmol) and HATU (399 mg, 1.05 mmol). After 5 mins, (3,5-dimethoxyphenyl)methanamine (166 μL, 1.1 mmol) was added. The mixture was stirred for 18 h, then concentrated. The crude mixture was dissolved in ethyl acetate, extracted with water and dried over MgSO4, filtered, and concentrated. The crude amide intermediate was used without further purification. A solution of crude 3-(azidomethyl)-N-(3,5-dimethoxyphenyl)-2-fluorobenzamide (370 mg, 1.1 mmol) in EtOH (20 mL) was treated with Raney-Ni (0.1 g) and then stirred under an atmosphere of H2 for 2 h. The catalyst was removed by filtration, and the solvent was removed under reduced pressure. The crude mixture was then dissolved in pyridine (5 mL), and 2-methylthio-2-imidazoline hydroiodide (0.31 g, 1.28 mmol) was added. This mixture was heated under mW irradiation at 125°C for 1 h. The solvent was removed under reduced pressure, and the material was purified by preparative HPLC. The combined fractions of product were dissolved in EtOAc and washed with sat. aq. K2CO3. The organic layer was dried (MgSO4), and the solvent was removed under reduced pressure to afford C3 as the free base (220 mg, 0.57 mmol, 57%). 1H NMR (600 MHz, MeOH-d4) δH 7.92 – 7.85 (m, 2H), 7.26 (dd, J = 9.9, 8.4 Hz, 1H), 6.50 (d, J = 2.2 Hz, 2H), 6.37 (t, J = 2.2 Hz, 1H), 4.51 (s, 2H), 4.49 (s, 2H), 3.75 (s, 6H), 3.73 (s, 4H); 19F NMR (376 MHz, MeOH-d4) δF 115.5; 13C NMR (151 MHz, MeOH-d4) δC 167.2, 163.4, 161.8, 161.1, 160.0, 140.9, 130.9, 130.9, 128.9 (d, J = 9.2 Hz), 128.7 (d, J = 4.9 Hz), 124.0, 123.9, 115.4 (d, J = 22.1 Hz), 105.1, 98.4, 54.3, 43.3, 42.8, 40.1, 40.0; LCMS (ESI) tR = 0.90 min, m/z = 387.1 [M+H]+; ≥ 95% (215, 254 nm); HMRS (ESI-TOF) calculated for C20H24FN+4O3 = 387.1827 [M+H]+, observed 387.1828.
Compound C3nc – 3-(((4,5-dihydro-1H-imidazol-2-yl)amino)methyl)-N-(3,5-dimethoxybenzyl)-2-fluorobenzamide
C3nc was synthesized following the same synthetic route as used for Compound 3, starting from methyl 3-(bromomethyl)-2-fluorobenzoate. 1H NMR (600 MHz, MeOH-d4) δH 7.66 (td, J = 7.5, 1.8 Hz, 1H), 7.51 (td, J = 7.5, 1.8 Hz, 1H), 7.30 (t, J = 7.5 Hz, 1H), 6.53 (d, J = 2.3 Hz, 2H), 6.38 (t, J = 2.3 Hz, 1H), 4.51 (br s, 4H), 3.76 (s, 6H), 3.73 (s, 4H); 19F NMR (376 MHz, MeOH-d4) δF 121.6; 13C NMR (151 MHz, MeOH-d4) δC 165.3, 161.2, 159.9, 158.6, 157.0, 140.6, 131.5 (d, J = 4.3 Hz), 129.8 (d, J = 2.9 Hz), 124.5 (d. J = 4.3 Hz), 124.4, 124.3, 123.9, 123.8, 105.0, 98.6, 54.3, 43.2, 42.8, 40.1 (d, J = 5.3 Hz); LCMS (ESI) tR = 0.70 min, m/z = 387.3 [M+H]+; ≥ 95% (215, 254 nm); HMRS (ESI-TOF) calculated for C20H24FN4O3 = 387.1827 [M+H]+, observed 387.1831.
Compound C5 – 3-((1H-Imidazol-1-yl)methyl)-N-(3,5-dichlorobenzyl)benzamide
3-(Chloromethyl)benzoyl chloride (142 μL, 1.0 mmol) was dissolved in CH2Cl2 (5 mL) and cooled to 40°C in an acetonitrile/dry-ice bath before the addition of DIPEA (348 mL, 2.0 mmol) and 3,5-dichlorobenzylamine (133 μL, 1.0 mmol). The mixture was stirred for 1 h, allowing to warm to 0°C, then concentrated in vacuo, and re-dissolved in THF (5 mL). In a separate vial imidazole (82 mg, 1.2 mmol) and NaH (60% dispersion in mineral oil, 100 mg, 2.5 mmol) were taken in THF (2.5 mL) and stirred for 30 mins. The crude aryl chloride was added into the flask and heated to reflux for 18 h. The cooled mixture was diluted with EtOAc and washed with sat. aq. NH4Cl, brine and purified by flash column chromatography (12 g, 0%–10% MeOH in CH2Cl2) to afford the title compound as a pale-yellow solid (188 mg, 0.52 mmol, 52%). 1H NMR (600 MHz, MeOH-d4)H 7.80 (dt, J = 7.7, 1.5 Hz, 1H), 7.79 – 7.75 (m, 2H), 7.48 (t, J = 7.7 Hz, 1H), 7.42 (dt, J = 7.9, 1.4 Hz, 1H), 7.32 (t, J = 1.9 Hz, 1H), 7.30 (d, J = 1.9 Hz, 2H), 7.13 (q, J = 1.4 Hz, 1H), 6.99 (t, J = 1.4 Hz, 1H), 5.29 (s, 2H), 4.52 (s, 2H); 13C NMR (151 MHz, MeOH-d4) δC 168.3, 143.0, 137.7, 137.3, 134.8, 134.6, 130.6, 128.9, 128.1, 128.1, 126.7, 126.6, 126.4, 125.8, 119.5, 119.5, 49.8, 42.2; LCMS (ESI) tR = 0.86 min, m/z = 360.3 [M+H]+ (dichloro splitting visible); ≥ 95% (215, 254 nm); HMRS (ESI-TOF) calculated for C18H16Cl2N3O = 360.0665 [M+H]+, observed 360.0645.
Compound C6 – N-(3,4-Dichlorobenzyl)-3-(6-fluoro-2-methylpyridin-3-yl)-5-((2-imino-3-methyl-2,3-dihydro-1H-imidazol-1-yl)methyl)benzamide
Argon gas was bubbled into a mixture of methyl 3-bromo-5-(hydroxymethyl)benzoate (7.50 g, 30.6 mmol), K2CO3 (10.69 g, 72.5 mmol) and 80% 1,4 dioxane / water (665 mL) for 5 min before the addition of Pd(PPh3)4 (2.68 g, 2.32 mmol) and (6-fluoro-2-methylpyridin-3-yl)boronic acid (6.4 g, 41.5 mmol). The reaction was heated to 80°C for 6 h, then the solvent was removed under reduced pressure. The crude mixture was dissolved in CH2Cl2, extracted with water, dried with MgSO4, filtered, concentrated and purified by flash column chromatography to afford methyl 3-(6-fluoro-2-methylpyridin-3-yl)-5-(hydroxymethyl)benzoate (7.19 g, 26.1 mmol, 83%). This was dissolved in THF (200 mL) / MeOH (50 mL) / water (50 ml) and stirred with LiOH (1.13 g, 54.0 mmol) for 6 h. The mixture was concentrated, diluted with water, and the pH was adjusted to ~1 with HCl (1N). The resulting solid was collected by filtration, washed with water, and dried under vacuum to afford 3-(6-fluoro-2-methylpyridin-3-yl)-5-(hydroxymethyl)benzoic acid (6.20 g, 23.7 mmol, 91%). A portion of the benzoic acid intermediate (4.0 g, 15.3 mmol) in DMF (70 mL) was treated with Et3N (6.30 mL, 45.9 mmol) and cooled to 0°C in an ice/water bath. The mixture was treated with EDC (3.0 g, 16.1 mmol), HOBT (2.46 g, 16.1 mmol), stirred for 5 mins, and then treated with (3,4-dichlorophenyl)methanamine (2.96 g, 16.8 mmol) for 18 h. The DMF was removed under reduced pressure, and the crude mixture was dissolved in EtOAc, extracted with water, dried over MgSO4, filtered, concentrated and purified by flash column chromatography to afford N-(3,4-Dichlorobenzyl)-3-(6-fluoro-2-methylpyridin-3-yl)-5-(hydroxymethyl)benzamide (3.87 g, 9.23 mmol, 60%). This intermediate was dissolved in CH2Cl2 (100 mL) / toluene (200 mL) cooled to 0°C in an ice/water bath and treated drop-wise with PBr3 (1N, 9.7 mL, 9.7 mmol), upon complete addition the mixture was stirred for 18 h. The reaction mixture was treated with water and NaHCO3 (s) until a basic pH was obtained. The organic layer was separated, washed with water, dried over MgSO4, filtered, concentrated and purified by flash column chromatography to afford 3-(bromomethyl)-N-(3,4-dichlorobenzyl)-5-(6-fluoro-2-methylpyridin-3-yl)benzamide (2.81 g, 5.83 mmol, 63%). The bromo intermediate, DIPEA (2.55 mL, 14.5 mmol), and 1-methyl-1H-imidazol-2-amine (1.13 g, 11.60 mmol) were taken in MeCN (150 mL) and heated to 80°C for 18 h. The reaction was cooled, concentrated, and purified by reverse-phase HPLC. The combined fractions of product were dissolved in EtOAc and washed with sat. aq. K2CO3. The organic layer was dried (MgSO4), and the solvent removed under reduced pressure to afford C6 (1.79 g, 3.70 mmol, 63%). 1H NMR (600 MHz, MeOH-d4) δH 7.83 – 7.77 (m, 3H), 7.50 (d, J = 2.1 Hz, 1H), 7.47 (d, J = 8.3 Hz, 1H), 7.44 (t, J = 1.7 Hz, 1H), 7.28 (dd, J = 8.3, 2.1 Hz, 1H), 6.98 (dd, J = 8.4, 2.8 Hz, 1H), 6.89 (d, J = 2.6 Hz, 1H), 6.86 (d, J = 2.5 Hz, 1H), 5.19 (s, 2H), 4.54 (s, 2H), 3.49 (s, 3H), 2.38 (s, 3H); 19F NMR (376 MHz, MeOH-d4) δF 72.2; 13C NMR (151 MHz, MeOH-d4) δC 167.5, 163.1, 161.5, 154.5, 147.2, 143.1 (d, J = 8.2 Hz), 139.7 (d, J = 26.2 Hz), 135.9, 135.2, 131.9, 131.0, 130.6, 130.3, 129.3, 127.5, 127.2, 125.7, 117.0, 115.0, 106.5 (d, J = 37.1 Hz), 42.2, 31.7, 21.3; LCMS (ESI) tR = 0.91 min, m/z = 498.3 [M+H]+ (dichloro splitting visible); ≥ 95% (215, 254 nm); HMRS (ESI-TOF) calculated for C25H23Cl2FN5O = 498.1258 [M+H]+, observed 498.1266.
Compound C6nc – N-(3,4-dichlorobenzyl)-3-(6-fluoro-2-methylpyridin-3-yl)-4-((2-imino-3-methyl-2,3-dihydro-1H-imidazol-1-yl)methyl)benzamide
Compound C6nc was synthesized following the same synthetic route as for Compound 6, starting from methyl 3-bromo-4-(hydroxymethyl)benzoate. 1H NMR (600 MHz, MeOH-d4) δH 8.00 (dd, J = 8.1, 2.0 Hz, 1H), 7.74 (d, J = 1.9 Hz, 1H), 7.59 (t, J = 8.2 Hz, 1H), 7.52 – 7.49 (m, 2H), 7.47 (d, J = 8.3 Hz, 1H), 7.28 (dd, J = 8.3, 2.1 Hz, 1H), 6.97 (dd, J = 8.2, 2.6 Hz, 1H), 6.86 (d, J = 2.6 Hz, 1H), 6.56 (d, J = 2.6 Hz, 1H), 4.88 (s, 2H), 4.54 (s, 2H), 3.44 (s, 3H), 2.19 (s, 3H); 19F NMR (357 MHz, MeOH-d4) δF −71.0; 13C NMR (151 MHz, MeOH-d4) δC 167.3, 163.5, 161.9, 155.2 (d, J = 13.7 Hz), 146.1, 142.6 (d, J = 8.0 Hz), 139.6, 138.4, 135.7, 134.8, 131.9, 131.2 (d, J = 4.6 Hz), 130.6, 130.2, 130.2, 129.5, 129.4, 129.3, 127.7, 127.1, 117.3, 114.6, 106.4 (d, J = 37.1 Hz), 42.2, 31.7, 21.0; LCMS (ESI) tR = 0.93 min, m/z = 498.3 [M+H]+ (dichloro splitting visible); ≥ 95% (215, 254 nm); HMRS (ESI-TOF) calculated for C25H23Cl2FN5O = 498.1258 [M+H]+, observed 498.1275.
Proliferation Assays
Cell proliferation was assayed using the Promega CellTiter-Glo Luminescent Kit. White, opaque, flat-bottomed 96-well plates were used. 5,000 cells were seeded per well for all cell lines, except 2,000 cells were seeded for MA93, MA93Ras, and MA93 FLT3/ITD to prevent overgrowth. Cells were treated with 0.1% DMSO vehicle only and at least five two-fold dilutions of WDR5 inhibitors with a top concentration of 50 μM. Final DMSO concentration was 0.1% in all compound treatment experiments. Each concentration of inhibitor was tested in triplicate wells and at least two biological replicates were performed. The total volume of cells with inhibitor was 100 μl per well. 200 μl of sterile PBS was added to all of the empty wells around the edge of the plate to prevent evaporation. Plates were incubated at 37°C for 72 hours. After 72 hours, the plates were allowed to reach room temperature before adding 50 μl of CellTiter-Glo reagent per well. Plates were incubated at room temperature, covered from light, for 30 minutes before the luminescence was measured using the CellTiter-Glo protocol on a GloMax plate reader. MTS assay (Promega CellTiter 96 AQueous Non-Radioactive Cell Proliferation Assay kit) was used to measure proliferation of RN2 cells. 2,500 cells were seeded into clear, flat-bottomed 96-well plates and treated with inhibitors as stated above. After a 72-hour incubation, 20 μl of MTS solution was added per well and plates were incubated at 37°C for 1.25 hours, then absorbance at 490 nm measured using a Bio-Rad iMark Microplate reader. For both CellTiter-Glo and MTS assays, the raw luminescence values were normalized to the DMSO vehicle only wells and PRISM software was used to generate GI50 values. Error bars on proliferation curves represent standard errors of the mean.
Growth and Viability Time Course
MV4:11 cells were plated at a density of 1 × 10⁵ cells/ml and treated with 0.1% DMSO only, 2 μM C6 or 2 μM C6nc. After 1, 2, 3, and 6 days, cells were stained with trypan blue and counted using an automated cell counter. Viability and cell density was measured three times for each sample at each time point, then averaged. On day 3, cells were spun down and resuspended in fresh media with fresh compound added. DMSO and C6nc-treated cells were replated to 1 × 10⁵ cells/ml to prevent overgrowth. The time course was repeated with three biological replicates and error bars represent the standard error of the mean.
Cellular Thermal Shift Assay (CETSA)
CETSA was performed as described (Jafari et al., 2014). To determine the melting temperature of WDR5, K562 or MV4:11 cells were dispensed into PCR tubes at a density of ~1,000,000 cells/tube in 99 μl of DMEM. One microliter of DMSO was added to each tube and the cell suspension mixed by vortexing. Cells were then subjected to 3 minutes of heat in a 96-well thermal cycler at temperatures of 46, 50, 54, 58, 62, 66, 70, 74, 78, 82, 86, and 90°C. Immediately after heating, cells were snap frozen in a CoolSafe Chamber (USA Scientific) surrounded by dry ice. To perform the isothermal dose-response of compounds against WDR5, K562 or MV4:11 cells were dispensed into PCR tubes at a density of ~1,000,000 cells/tube in 99 μl of DMEM. One microliter of compound, or DMSO, was added to each tube, mixed by vortexing, and incubated at 37°C for one hour. Cells were then heated at 79°C for 3 minutes in a 96-well thermal cycler. Immediately after heating, cells were snap frozen prior to lysate preparation. To prepare cell lysates, frozen cells were subjected to six rapid freeze-and-thaw cycles. After the first thaw, 1 μl of protease inhibitor cocktail (Sigma) was added to the cell lysates. Cell lysates were centrifuged at 4°C and 20,000 × g for 20 minutes. Samples were prepared by transferring 60 μl of supernatant into 20 μl of NuPAGE 4X LDS sample buffer (ThermoFisher) with 5 μl NuPAGE Sample Reducing Agent (10X) (ThermoFisher) and then heated for 15 minutes at 95°C. Note that in this experiment, cells without the 3-minute heating served as 100% stabilization and used for normalization purpose. Protein lysates were separated on a NuPAGE Novex 4%–12% Bis-Tris gel (ThermoFisher) and transferred onto PVDF membrane using an iBlot 2 Dry Blotting System (ThermoFisher). Membranes were blocked overnight with 5% nonfat dry milk (BIO-RAD) in PBST–Phosphate Buffered Saline (ThermoFisher) with 0.5% Tween-20 (Sigma). Membranes were then incubated for 1 hour with 1:1,000 of rabbit monoclonal anti-WDR5 (D9E1I) antibody, washed three times for 15 minutes in PBST, incubated with 1: 1,000 anti-rabbit HRP linked IgG. After washing three times for 15 minutes in PBST, blots were incubated with SuperSignal West Dura Extended Duration Substrate (ThermoFisher). The chemiluminescence signals were captured by BIO-RAD CHEMDOC Imaging System, quantified by ImageQuant TL (GE Healthcare) and analyzed using Prism (GraphPad). Error bars on proliferation curves represent standard errors of the mean. Two independent biological replicates were performed.
Quantifying Relative Protein Synthesis Rates
Protein synthesis rates were measured by pulsing cells with O-propargyl-puromycin (OPP) (Signer et al., 2014). Briefly, MV4:11 cells were treated for 1, 2, 3 or 6 days with 2 μM of C6nc, 2 μM C6 or 0.1% DMSO vehicle control. At each time point, 2 million cells were collected per sample and pulsed with 50 μM OPP for 1 hour at 37 C. For a positive control for inhibition of protein synthesis, 100 mg/ml of cycloheximide was added to DMSO treated cells and incubated at 37°C for 30 minutes prior to addition of OPP. Cells were then washed with ice-cold phosphate-buffered saline (PBS) and fixed in 500 μL of PBS with 1% paraformaldehyde (PFA) for 15 minutes on ice, then washed again in PBS. Cells were permeabilized with 500 μL of PBS + 3% FBS + 0.1% saponin for 5 minutes then washed in PBS + 3% FBS. The Click-it Cell Reaction Buffer Kit (Thermo C10269) was used to conjugate 500 nM Alexa Flour647-Azide (Thermo A10277) to OPP following the manufacturer’s instructions. Samples were washed in PBS + 3% FBS, then resuspended in 1 mL PBS. To control for background staining, a sample of DMSO treated cells was subjected to the same staining procedure, but no OPP was added. Relative Alexa647 fluorescence was quantified using a Becton Dickinson (BD) LSR II flow cytometer and analyzed using FlowJo software. At least 10,000 events were recorded per sample. Doublets were excluded prior to analysis. The time course was repeated in biological triplicate with error representing standard error of the mean. Flow Cytometry experiments were performed in the Vanderbilt University Flow Cytometry Shared Resource.
Cell Cycle Analysis
Cell cycle analyses were performed as described (Kim and Sederstrom, 2015), with slight modification. MV4:11 cells were treated for 0, 1, 2, 3 or 6 days with 2 μM C6, 2 μM C6nc, or 0.1% DMSO vehicle control. Fresh media and compound was added on day three. At each time point, one million cells were collected per sample and washed once with PBS then resuspended in 500 μl of PBS. Cells were fixed by adding cells drop-wise to 4.5 mL ice cold 70% ethanol while vortexing, then incubated for at least two hours at 20°C. Cells were washed in FACS buffer (PBS with 2% FBS, 1 mM EDTA) then stained with 500 μl PI Staining Solution (PBS with 10 μg/mL propidium iodide, 100 μg/mL RNase, 2 mM MgCl2) for 20 minutes at room temperature, protected from light. Propidium iodide fluorescence was measured using a BD LSR II Flow Cytometer and cell cycle distribution was analyzed using BD FACSDIVA software. At least 10,000 events were recorded per sample. Doublets were excluded prior to analysis of cell cycle distribution. The time course was repeated with three biological replicates and error bars represent the standard error of the mean. Flow Cytometry experiments were performed in the Vanderbilt University Flow Cytometry Shared Resource.
Induction of Apoptosis
MV4:11 cells were treated for 0, 1, 2, 3 or 6 days with 2 μM C6, 2 μM C6nc, or 0.1% DMSO only. Fresh media and compound was added on day 3. As a positive control for apoptosis induction, cells were treated with 2 μM Camptothecin for 4 hours. 5×10⁵ cells were collected per sample and resuspended in 100 μl of 1× Annexin V Binding Buffer (Invitrogen V13246). 0.5 μl of Alexa Flour488-conjugated Annexin V (Thermo A13201) was added per sample, then incubated for 15 minutes. Cells were resuspended in 400 μl fresh 1× Annexin V Binding Buffer + 10 ng of propidium iodide and incubated for 10 minutes. Samples were then kept on ice and Alexa Flour488 and propidium iodide fluorescence was measured using a BD LSR II Flow Cytometer and the percentage of apoptotic cells was analyzed using FlowJo software. At least 10,000 events were recorded per sample. After doublet exclusion, an unstained control sample was used to set the quadrant gating. The time course was repeated with three biological replicates and error bars represent the standard error of the mean. Flow Cytometry experiments were performed in the Vanderbilt University Flow Cytometry Shared Resource.
Immunofluorescence and Confocal Microscopy
General procedures for immunofluorescence were taken from (Nicolae et al., 2014). For nucleophosmin (NPM) staining, cells were treated for 72 hours with 4 μM C6, 4 μM C6nc or 0.1% DMSO only. For ɣ-H2AX staining, cells were treated for 24 hours with 4 μM C6, 4 μM C6nc or 0.1% DMSO only. As a positive control for DNA damage, cells were treated for 1 hour with 2 μM camptothecin. As a positive control for nucleolar stress, cells were treated with 5 nM actinomycin D for 6 hours (Burger et al., 2010). Cells were washed once in PBS, then 100,000 cells/sample were attached to slides via a Cytospin for 3 minutes at 800 rpm. Cells were fixed with 4% paraformaldehyde for 10 minutes at room temperature, followed by extraction with 0.3% Triton X-100 for 10 minutes on ice. Slides were blocked with 5% BSA + 0.1% Triton X-100 in PBS for 30 minutes at room temperature. Primary antibody was added (1:5,000 Abcam ab11174 for ɣ-H2AX, and 1:2,000 Sigma B0556 for NPM) in PBS with 3% BSA and incubated overnight at 4°C. After washing in PBS, secondary antibody [1 drop Alexa Fluor488 goat anti-Rabbit ReadyProbes Reagent (Thermo R37116) in 3 mL PBS for ɣ-H2AX or 1:2,000 Alexa Fluor488 goat anti-mouse IgG (Thermo A11001) in 3% BSA in PBS for NPM] was added and incubated for 1 hour at room temperature. Slides were washed in PBS, then nuclei were counterstained with 20 μM DRAQ5 in PBS for 10 mins at 37°C. Slides were mounted with ProLong Diamond Antifade mountant. Images were collected using a Leica TCS SP5 scanning confocal microscope. Nuclear ɣ-H2AX staining intensity was quantified for all cells in 5 representative fields of view imaged with the same laser power and gain settings with Fiji software (Schindelin et al., 2012) and plotted in Prism with error bars representing the standard deviation. The ratio of nuclear to nucleoplasmic NPM staining in individual cells from two biological replicates was quantified using Fiji and plotted in Prism with error bar representing the standard deviation. Prism was used to perform a oneway ANOVA with a post hoc Dunnett’s test in order to compare the mean of each treatment to that of the DMSO-only treated control sample for both the mean nuclear gamma-H2AX signal and ratio of nucleolar to nucleoplasmic NPM staining quantifications. Level of significance was determined using a 95% confidence interval.
Generation of Cell Lines Expressing Exogenous WDR5
pFlag-C2, which is a derivative of pcDNA3.1-Puro (+) encoding a FLAG tag for N-terminal fusions (Thomas et al., 2015), was used as the backbone to insert sequences encoding either (i) amino acids 1–94 of Saccharomyces cerevisiae GAL4 fused to the HA epitope, or full-length human WDR5. Generation of the F133A mutant was accomplished using whole plasmid PCR with Q5 polymerase and primers WDR5–11 and WDR5–12 (Table S4). For production of stable transfectants, 40 μg of each plasmid was linearized by Pvu I digest and transfected into HEK293 cells using the calcium phosphate method. After two days Puromycin was added to the media at 1 μg/ml. Selection was complete, compared to cells transfected with pBluescript II SK(+), after approximately three weeks.
Lentiviral Production and Transductions
pLKO-p53-shRNA-941 and pLKO-p53-shRNA-427 plasmids were a gift from Todd Waldman [Addgene plasmid # 25637 and # 25636 respectively; (Kim et al., 2007). Scrambled shRNA pLKO.1 plasmid was a gift from David Sabatini [Addgene plasmid # 1864; (Sarbassov et al., 2005). pLKO.3G was a gift from Christophe Benoist & Diane Mathis (Addgene plasmid # 14748). To allow for GFP+ cell sorting instead of puromycin selection of transduced cells, shRNA sequences from pLKO-p53-shRNA-941, pLKO-p53-shRNA-427, and scrambled shRNA pLKO.1 were cloned into the pLKO.3G vector using SpeI and NdeI restriction enzymes (NEB). to create plasmids pLKO.3G-p53-shRNA-941, pLKO.3G-p53-shRNA-427, and pLKO.3G-shRNA-scrambled plasmids, respectively. These plasmids were transfected into HEK293T cells along with the pCMV-Pax2 and pMD2 packaging vectors using the calcium phosphate method. pCMV-Pax2 was a gift from Jonathan Epstein (Addgene plasmid # 36052) and pMD2.G was a gift from Didier Trono (Addgene plasmid # 12259). Virus-containing media was harvested 24 and 48 hours post-transfection and filtered through a 0.45 μm filter. For viral transduction, one million MV4:11 cells were resuspended in 2 mL RMPI-1640 + 10% FBS + 1% penicillin/streptomycin. 8 μg/ml polybrene and 1 mL of filtered virus was added to the cells and incubated for 20 minutes. Cells were centrifuged at 800 × g for 30 minutes then gently resuspended and plated in a 6-well plate. Cells were incubated overnight at 37°C. The transduction procedure was repeated two more times. GFP+ cells were sorted using a BD FACSAria III with a 100 μm nozzle. Cell sorting was performed in the Vanderbilt University Flow Cytometry Shared Resource. shRNA mediated knock-down of p53 in sorted GFP+ cells was validated via western blot.
Generation of p53 null MV4:11 and Molm13 cell lines
Lentiviral production and transduction was completed as stated for shRNA knock-down experiments, above. plentiCRISPRv2, a gift from Feng Zhang (Addgene plasmid # 52961), was modified to express a gRNA against p53 (GAGCGCTGCTCAGATAGCGA; pLentiCRISPRv2–TP53) or EGFP (GAGCTGGACGGCGACGTAAA; pLentiCRISPRv2–EGFP). Two days after transduction, cells were selected with 2 mg/ml of puromycin for eight days. After selection with puromycin, the resistant cell populations were cloned by single cell sorting into a 96-well plate using a BD FACSAria III. Clones were validated for p53 knockout by western blot and Tracking of Indels by Decomposition (TIDE) sequencing analysis (Brinkman et al., 2014). Proliferation assays and p53 induction blots were done as for the p53 shRNA knockdown.
Chromatin Immunoprecipitation
Chromatin immunoprecipitation (ChIP) assays were performed as described (Thomas et al., 2015). Cells were treated with inhibitors, as indicated, then washed in PBS and cross-linked with 0.75%–1% formaldehyde at room temperature for 10 minutes. The reaction was quenched with 125 mM glycine for 10 minutes at room temperature, after which cells were washed with ice cold PBS. Cells were lysed in Formaldehyde Lysis Buffer (50 mM HEPES pH 7.5, 140 mM NaCl, 1 mM EDTA, 1% Triton, 1% SDS, and Complete Protease Inhibitor cocktail) using 250 μl of buffer per 1×10⁷ cells, on ice, for 10 minutes. Chromatin was sheared by 25-minute sonication (BioRuptor) to yield a mean chromatin size of ~250 bp, and debris cleared by centrifugation. Sheared chromatin was diluted 10-fold in Formaldehyde Lysis Buffer without SDS before immunoprecipitation overnight at 4°C using the appropriate antibody and Protein A agarose. Chromatin from 6 million cells was used per reaction. Immune complexes were washed sequentially with Low Salt Wash buffer (20 mM Tris pH 8.0, 150 mM NaCl, 2 mM EDTA, 1% Triton), High Salt Wash Buffer (20 mM Tris pH 8.0, 500 mM NaCl, 2 mM EDTA, 1% Triton), LiCl Wash buffer (25 mM LiCl, 1 mM EDTA, 1% Triton) and twice with TE (pH 8.0). Protein–DNA complexes were de-crosslinked overnight at 65°C in Elution Buffer (TE, 0.1% SDS, 40 μg Proteinase K). Proteinase K was heat inactivated for 20 minutes 95°C then 150 μl of TE was added. 1 μl of DNA was used in a 15 μl PCR reaction using KAPA SYBR FAST qPCR Master Mix 2X Universal and quantified on an Eppendorf Realplex2 Mastercycler in triplicate. ChIP signals were calculated as percent input. ChIP experiments were completed in biological triplicate with error bars representing the standard error of the mean.
Chromatin Immunoprecipitation–Sequencing
MV4:11 cells were grown to 106 cells/ml and treated for 4 hours with 0.1% DMSO, 2 μM C6, or 2 μM C6nc. Cells were concentrated to 4 × 10⁶ cells/ml in PBS and cross-linked with 1% formaldehyde for 10 minutes at room temperature followed by quenching with 125 mM glycine for 10 minutes. Cells were washed with ice-cold PBS and lysed in 250 μl 1% SDS FA Buffer (50 mM HEPES, pH 7.5; 140 mM NaCl; 1 mM EDTA; 1% Triton X-100; 1% SDS; 1× Roche Protease Inhibitor, EDTA-Free) per 107 cells and incubated on ice for 10 minutes. Chromatin was sheared with a Bioruptor (Diagenode, UCD-200) on highest setting, alternating between 30 s on/30 s off, to achieve an average fragment size of ~250 nucleotides; cellular debris was then cleared through centrifugation for 10 minutes at 16k g at 4°C. Sheared chromatin was diluted ten-fold with 0% SDS FA Buffer to achieve a final concentration of 0.1% SDS and IgG or appropriate anti-WDR5 antibody added. Samples were rotated overnight at 4°C. Protein-A agarose beads (Roche, 11 134 515 001) were washed three times with 1% FA Buffer and blocked for 20 minutes on rotator with 10 μg BSA and 100 μl 1% SDS FA Buffer per 15 μl bed volume of Protein-A agarose beads. 100 μl blocked bead slurry was added to each sample and rotated for 4 hours at 4°C. Beads were washed by rotating beads for 5 minutes at room temperature with 1 mL of the following buffers: once with Low Salt Buffer, once with High Salt Buffer; once with LiCl Wash Buffer; and twice with TE. Washed chromatin-bound beads were suspended in 50 μl TE, 5 μl 1% SDS, and 1 μl Proteinase K and incubated overnight at 65°C. The following day, 300 μl TE was added and protein removed by phenol chloroform extraction. DNA was precipitated by adding 36 μl 3 M NaOAc, pH 5.2, 10 μg glycogen, and 1 mL 100% ethanol and centrifugation for 10 minutes at 16k g at 4°C. DNA pellets were washed once with 70% ethanol and air-dried. DNA pellets were suspended in 100 μl TE and used for next generation sequencing (NGS) library preparation. Indexed libraries were made using the DNA Ultra II Library Prep Kit for Illumina (New England BioLabs, Inc., E7645). Library quality was assessed using the 2100 Bioanalyzer (Agilent) and libraries were quantitated using KAPA Library Quantification Kits (KAPA Biosystems). Pooled libraries were subject to 50 bp single-end sequencing according to the manufacturer’s protocol (Illumina HiSeq 3000). Sequencing was performed by the Vanderbilt Technologies for Advanced Genomics (VANTAGE) Shared Resource. Bcl2fastq2 Conversion Software (Illumina) was used to generate de-multiplexed Fastq files.
Subcellular Fractionation
These assays were performed as described (Méndez and Stillman, 2000). MV4:11 cells were treated for 4 hours with 36 μM C3 or 0.1% DMSO only. 1 ×10⁷ cells were collected and washed twice in PBS. Cells were resuspended in 200 μl Buffer A [10 mM HEPES, pH 7.9, 10 mM KCl, 1.5 mM MgCl2, 0.34 M sucrose, 10% glycerol, 1 mM DTT (added fresh), 1× protease inhibitor cocktail (added fresh)] and incubated on ice for 8 minutes. Samples were centrifuged at 1,300 × g at 4°C for 5 minutes. The supernatant (S1 fraction) and pellet (P1 fraction) were separated and S1 was clarified by high-speed centrifugation at 4°C for 10 minutes. The resulting supernatant (S2 fraction) was collected and the pellet (P2 fraction) was discarded. The P1 fraction was washed once with 500 μl Buffer A and centrifuged 1 minute at 1,300 × g. The P1 fraction was lysed by resuspending in 100 μl Buffer B [3 mM EDTA, 0.2 mM EGTA, protease inhibitor cocktail (added just before use)] and incubating for 30 minutes on ice, followed by centrifugation at 1,700 × g at 4C for 5 minutes. The resulting supernatant (S3 fraction) was separated from the chromatin-enriched pellet (P3 fraction). P3 was washed once with 500 μl Buffer B and resuspended in 100 μl SDS sample buffer and boiled for 10 minutes. 5% of each fraction was run on an 8% SDS-PAGE gel and protein distribution probed by western blotting.
Polysome fractionation
Polysome enrichment experiments were performed as previously described (Yang et al., 2006). Briefly, 15 × 106 MV4:11 cells were plated with either 5 μM C6 or DMSO control for 24 hours and then lysed in Polysomal Buffer (10 mM MOPS, pH 7.2, 250 mM NaCl 2.5 mM MgOAc, 0.5% NP-40, 200 ug/ml heparin; containing 50 mg/ml cyclohexamide, 1 mM PMSF, 20 units of Superase Inhibitor, and protease inhibitor cocktail for 10 min on ice. Debris were cleared by centrifugation. A portion of the supernatant representing the total RNA was served as the total RNA for extraction. Polysomes in the supernatant were recovered by centrifugation (100,000 × g) for 1 hr in a TLA 120.1 rotor. Pelleted polysomes were resuspended in polysomal buffer and all supernatant remaining served as the monsomal fraction. RNA from total, polysomal, and monosomal fractions were extracted using Trizol-LS (Thermo Scientific) followed by purification and DNase treatment using Direct-zol RNA miniPrep (Zymol). All extracted RNA was subjected to reverse transcription using MuLV reverse transcriptase as described below. Differences in mRNA levels between fractions were quantified using an Eppendorf Realplex2 Mastercycler using the Ct method. For each fraction, mRNAs of interest were normalized to GAPDH and then the percent of the total RNA for monosomal or polysomal fractions was calculated. These final values representing the percent monosomal or polysomal mRNA were then made relative to DMSO treatment.
Cycloheximide (CHX) Chase
MV4:11 cells were treated for 24 hours with 2 μM C6, 2 μM Nutlin-3 or DMSO only. After 24 hours, two million cells were collected for each treatment as the “time 0” sample. To the remainder of the sample, CHX was added to a final concentration of 50 μg/ml. At time points of 15, 30, 60, 120, and 180 minutes, two million cells for each treatment were collected, snap frozen in liquid nitrogen, and stored at −80°C until processing. Cell pellets were lysed in 200 μl of Kischkel buffer (50 mM Tris pH 8.0, 150 mM NaCl, 5 mM EDTA, 1% Triton X-100, protease inhibitor cocktail, 1 mM PMSF), extracts sonicated and then cleared by centrifugation. Laemmli Sample buffer was added and samples were boiled for 10 mins before running on a 4%–20% mini-PROTEAN TGX gel (BioRad) and transferring to PVDF membrane. Membranes were blocked in 5% milk in TBST for 20 minutes then probed with appropriate antibodies.
RT-qPCR Quantification of mRNA Expression
Cells were lysed in 500 μl Trizol, after which total RNA was extracted using the Zymo Research Direct-zol RNA MiniPrep kit with on-column DNase digestion. After extraction, 1 μg of RNA was reverse transcribed using MuLV reverse transcriptase (Life Tech N8080018) in 20 μl reaction, then diluted three-fold with nuclease-free water. 1 μl of cDNA was used in a 15 μl qPCR reaction using KAPA SYBR FAST qPCR Master Mix 2X Universal and quantified on an Eppendorf Realplex2 Mastercycler in triplicate. Relative mRNA expression of genes of interest was quantified using the CT method, normalized to signals from GAPDH. mRNA expression studies were completed in triplicate with error bars representing the standard error of the mean.
PRO-Seq
30 million MV4:11 cells were treated with compound C3 and harvested after either 15, 30, or 60 minutes. As a reference control, cells were treated with 0.1% DMSO for 60 minutes. Cells were washed twice with cold PBS, resuspended in 10 mL of cold swelling buffer (10 mM Tris-Cl pH 7.5, 2 mM MgCl2, 3 mM CaCl2, 300 mM Sucrose, protease inhibitors), and incubated on ice for 5 minutes. After incubation, cells were pelleted by centrifugation, resuspended in 2 mL cell lysis buffer (swelling buffer + 10% glycerol + 0.1% Triton X-100) and incubated on ice for 5 minutes. Cells were then Dounce-homogenized 50 times, after which 5 mL of lysis buffer was added and nuclei collected by centrifugation. The nuclei were washed once with 5 mL lysis buffer, followed by one wash with 1 mL freezing buffer (50 mM Tris-Cl pH 8.3, 40% glycerol, 5 mM MgCl2, 0.1 EDTA), resuspended in freezing buffer at density of 2 × 10⁷ nuclei/100 μl, and stored at −80°C until nuclear run-on assays could be performed.
Nuclear run-on assays were performed as described (Kwak et al., 2013). Briefly, nuclei were thawed on ice and 2 × 10⁷/100 μL nuclei added to an equal volume of pre-warmed 2× nuclear run-on reaction mix (10 mM Tris-Cl pH 8.0, 300 mM KCl, 1% Sarkosyl, 5 mM MgCl2, 1 mM DTT, 375 μM ATP, biotin-11-CTP, GTP and UTP, and 0.8 U/μl SuperaseIN). Run-on reactions were performed for three minutes at 30°C, and then terminated by addition of three volumes of TRIzol LS. RNA was extracted and precipitated in isopropanol, followed by a 75% ethanol wash. Extracted RNA was fragmented by base hydrolysis using 0.2 M NaOH on ice for 10 minutes. After incubation, the reaction was neutralized by addition of one volume of 1 M Tris-Cl, pH 6.8. Thirty microliters of Dynabeads® MyOne Streptavidin T1 magnetic beads (Invitrogen) were then added to collect biotinylated RNA fragments, and incubated on a nutator for 20 minutes at room temperature according to the manufacturer’s instructions. After incubation, beads were sequentially washed with high salt (2M NaCl, 50 mM Tris-Cl pH 7.4, 0.5% Triton X-100), medium salt (300 mM NaCl, 10 mM Tris-Cl pH 7.4, 0.1% Triton X-100), and low salt (5 mM Tris-Cl pH 7.4, 0.1% Triton X-100) wash buffers. RNA was eluted from the beads by two TRIzol extractions followed by isopropanol precipitation and a 75% ethanol wash.
3’ RNA adaptor ligation was carried out in a 10 μL reaction containing 10 pmol of 3’ RNA adaptor, 10 U T4 RNA ligase I (NEB), 10 nmol of ATP, and SuperaseIN, at 20°C for 6 hours. Adaptor-ligated biotinylated RNA was purified by Streptavidin bead binding and RNA extraction as described above. The 5’ ends of RNA fragments were repaired by incubation with Tobacco Acid Pyrophosphatase (TAP, Epicenter), followed by Polynucleotide Kinase (PNK, NEB) treatment according to manufacturer’s instructions. RNA was extracted using TRIzol and precipitated with isopropanol followed by a 75% ethanol wash. 5’ RNA adaptor ligation was carried out in a 10 μL reaction containing 10 pmol of 5’ RNA adaptor, 10 U T4 RNA ligase I, 10 nmol ATP, and SuperaseIN, at 20°C for 6 hours. Adaptor-ligated biotinylated RNA fragments were purified by Streptavidin bead binding and TRIzol extraction as described above, and then reverse-transcribed using 25 pmol RP1 primer (for TRU-seq sequencing). An aliquot of cDNA was serially diluted and used for standard PCR amplification to determine optimal PCR cycle number. The final library amplification was carried out by using 12.5 pmol RPI-index primers (for TRU-seq barcodes, Illumina) and Phusion polymerase (NEB). Libraries were run on PAGE gel and and library fragments between 140 and 300 bp was excised. The libraries were purified and submitted to the Vanderbilt Technologies for Advanced Genomics (VANTAGE) for sequencing on an Illumina HiSeq 2000.
RNA-Seq
Cells were treated for 72 hours with 2 μM C6, 2 μM C6nc or 0.1% DMSO only. Cells were washed in PBS then lysed in 500 μl Trizol. RNA was isolated using the Zymo Research Direct-zol RNA MiniPrep kit with on-column DNase digestion following the manufacturer’s instructions. Library preparation with rRNA depletion and paired-end 150 base pair sequencing on an Illumina HiSeq was performed by GENEWIZ. Prior to sequencing, RNA integrity was assessed by 2100 Bioanalyser (Agilent) and concentration was assayed by Qubit. RNA-Seq for MV4:11 cells treated with C6nc, C6 and DMSO was completed with 5 biological replicates.
p53/p21 Induction Western Blots
Cells were treated for 24 hours with C6nc and C6 (2 μM for MV4:11 and 3 μM for Molm13), or 2 μM Nutlin-3, or a 0.1% DMSO only vehicle control. Four million cells were washed in PBS then lysed for 10 minutes on ice in 200 μl Kischkel buffer (50 mM Tris pH 8.0, 150 mM NaCl, 5 mM EDTA, 1% Triton X-100, protease inhibitor cocktail, 1 μM PMSF). Whole cell extracts were sonicated for 15 s then clarified by centrifugation. Laemmli Sample buffer was added and samples were boiled for 10 minutes before running on a 4%–20% mini-PROTEAN TGX gel (BioRad) and transferring to PVDF membrane. Membranes were blocked in 5% milk in TBST for 20 minutes then probed with appropriate antibodies.
Induction of PARP1 cleavage
MV4:11 cells were treated for 1, 2, 3 or 6 days with 2 μM C6nc and C6, or 0.1% DMSO only. Four million cells were washed in PBS then lysed for 10 minutes on ice in 200 μl Kischkel buffer (50 mM Tris pH 8.0, 150 mM NaCl, 5 mM EDTA, 1% Triton X-100, Protease inhibitor cocktail, 1 μM PMSF). Whole cell extracts were sonicated for 15 s then clarified by centrifugation. Laemmli Sample buffer was added and samples were boiled for 10 minutes before running on a 4%–20% mini-PROTEAN TGX gel (BioRad) and transferring to PVDF membrane. Membranes were blocked in 5% milk in TBST for 20 minutes then probed with appropriate antibodies.
QUANTIFICATION AND STATISTICAL ANALYSIS
ChIP-Seq Data Analysis
ChIP-Seq reads were aligned to the human genome using Bowtie2 (Langmead et al., 2009). Peaks in each sample were called using MACS2 with q-value of 0.01 (Feng et al., 2012). Peaks were annotated using the Homer command annotatePeaks (http://homer.ucsd.edu/homer/). Consensus peaks in each condition were identified using DiffBind (Stark and Brown, 2011); peaks occurring at least two replicates in each condition were included. Peaks identified in at least one condition were combined into a final peak set to identify differential peaks across conditions. Read counts were normalized to the total mapped reads, and differential peaks were determined by DESeq2 (Love et al., 2014), which calculated the log2 fold changes, Wald test p values, and adjusted p values (False Discovery Rate, FDR) by the Benjamini-Hochberg procedure. Significantly changed peaks were assessed with FDR < 0.05.
RNA-Seq Data Analysis
RNA-Seq reads were aligned to the human reference genome hg19 using STAR (Dobin et al., 2013) and quantified by featureCounts (Liao et al., 2014). Read counts were normalized by the Relative Log Expression (RLE) method. Differential analysis were performed by DESeq2 (Love et al., 2014), which determined the log2 fold changes, Wald test p values, and adjusted p value (FDR) by the Benjamini-Hochberg procedure. The significantly changed genes were assessed with a FDR < 0.05.
PRO-Seq Analyses
Low quality reads were trimmed from raw reads using Trimmomatic-0.32 (Bolger et al., 2014). Reverse complements were generated using “fastx_reverse_complement” from FASTX-Toolkit. Reverse-complemented reads were aligned to the human genome hg19 using Bowtie2 [version 2.2.4; (Langmead and Salzberg, 2012). Reads mapped to rRNA loci and reads with mapping quality of less than 10 were removed. The reads were normalized by the RLE implemented in the DESeq2 (Love et al., 2014). NRSA (http://bioinfo.vanderbilt.edu/NRSA/), a tool to provide a comprehensive analysis on nascent transcriptional profiles for known genes and novel enhancers, was used to estimate RNA polymerase abundance in proximal-promoter and gene body regions of genes, to calculate pausing index and pausing index alterations, and to detect enhancers and quantify eRNA changes. Briefly, the promoter-proximal region is defined by examining each 50 bp window with a 5 bp sliding step along the coding strand spanning ± 500 bp from known TSSs. The 50 bp region with the largest number of reads is considered as the promoter-proximal region and its read density is calculated (Core et al., 2008). The gene body is defined as the region from +1 kb downstream of a TSS to its transcription termination site (TTS). Pausing index for each gene is calculated as the ratio of promoter-proximal density over gene body density. Significance of pausing is evaluated by Fisher’s exact test (Core et al., 2008). NRSA first calls novel transcripts using HOMER, and then identifies intergenic, bidirectional transcripts as eRNA pairs (Hah et al., 2011, 2013). NRSA detects enhancers by integrating those eRNA pairs. Enhancers are considered to be novel if their centers do not fall in any enhancer region based on the FANTOM5 database (Lizio et al., 2015). DESeq2 (Love et al., 2014) was implemented to detect significant transcriptional changes for promoter-proximal, gene body regions, and enhancers, accounting for the batch effect. Transcriptional changes were assessed with a FDR < 0.05 and a fold change ≥ 1.5 were considered significant.
DATA AND SOFTWARE AVAILABILITY
All genomic datasets (for ChIP-Seq, RNA-Seq, and PRO-Seq) have been deposited at the Gene Expression Omnibus (GEO) with accession number GEO: GSE115377. X-ray crystal structures have been deposited at the Protein Data Bank (PDB) with accession codes PDB: 6DY7, 6EY1, 6E22, 6E1Z, 6DYA, and 6E23.
Supplementary Material
Highlights.
WDR5 is a regulator of ribosome protein gene transcription
The WIN site of WDR5 tethers it to chromatin
Potent small molecule inhibitors of the WIN site displace WDR5 from chromatin
WIN site inhibitors induce nucleolar stress and p53-dependent apoptosis
ACKNOWLEDGMENTS
We thank the Vanderbilt High-Throughput Screening Core facility for compound management and the Vanderbilt University Biomolecular NMR facility for the use of Bruker nuclear magnetic resonance (NMR) spectrometers. This facility receives support from an NIH SIG grant (1S-10RR025677–01). The VU Flow Cytometry Shared Resource is supported by the Vanderbilt Ingram Cancer Center (CA68485) and the Vanderbilt Digestive Disease Research Center (DK058404). The VU VANTAGE Shared Resource is supported by the Vanderbilt Ingram Cancer Center, the Vanderbilt Digestive Disease Research Center, and the Vanderbilt Vision Research Center (EY008126). We thank contributing and supporting members of Leidos Biomedical Research at Frederick National Laboratories for Cancer Research and the NCI Chemical Biology Consortium. Use of the Advanced Photon Source, an Office of Science User Facility operated for the US Department of Energy Office of Science by the Argonne National Laboratory, was supported by the US Department of Energy (contract no. DE-AC02–06CH11357). Use of the Life Sciences Collaborative Access Team Sector 21 was supported by the Michigan Economic Development Corporation and Michigan Technology Tri-Corridor grant (no. 085P1000817). This project has been funded in part with federal funds from the National Cancer Institute/NIH, under Chemical Biology Consortium Contract no. HHSN261200800001E. This work was supported by the NCATS Division of Pre-Clinical Innovation Intramural Program. This work was also supported by grants from the Robert J. Kleberg, Jr., and Helen C. Kleberg Foundation (to W.P.T. and S.W.F.); Alex’s Lemonade Stand Foundation (to W.P.T.); St. Baldrick’s Foundation (to W.P.T.); Edward P. Evans Foundation (to W.P.T.); the NCI/NIH (CA200709 to W.P.T.); the NCI/NIH (CA211305 to L.R.T.); the Integrated Biological Systems Training in Oncology Training Program (T32 CA119925 to E.R.A.); the Rally Foundation for Childhood Cancer Research Fellowship (to A.M.W.); Open Hands Overflowing Hearts co-funded research fellowship (to A.M.W.); the American Association for Cancer Research Basic Cancer Research Fellowship (to A.M.W.); and a Ruth L. Kirschstein Predoctoral Individual National Research Service Award (F31 CA210429 to A.M.F.).
Footnotes
SUPPLEMENTAL INFORMATION
Supplemental Information includes six figures and four tables and can be found with this article online at https://doi.org/10.1016/j.celrep.2019.02.047.
DECLARATION OF INTERESTS
S.W.F., S.R.S., W.P.T., E.T. Olejniczak, J.P., J.W., K. Jeon, and R.D.G. were granted US Patent 10,160,763, “WDR5 Inhibitors and Modulators,” on December 25, 2018.
REFERENCES
- Adams PD, Grosse-Kunstleve RW, Hung LW, Ioerger TR, McCoy AJ, Moriarty NW, Read RJ, Sacchettini JC, Sauter NK, and Terwilliger TC (2002). PHENIX: building new software for automated crystallo-graphic structure determination. Acta Crystallogr. D Biol. Crystallogr 58, 1948–1954. [DOI] [PubMed] [Google Scholar]
- Alicea-Velázquez NL, Shinsky SA, Loh DM, Lee JH, Skalnik DG, and Cosgrove MS (2016). Targeted Disruption of the Interaction between WD-40 Repeat Protein 5 (WDR5) and Mixed Lineage Leukemia (MLL)/SET1 Family Proteins Specifically Inhibits MLL1 and SETd1A Methyltransferase Complexes. J. Biol. Chem 291, 22357–22372. [DOI] [PMC free article] [PubMed] [Google Scholar]
- Bennett RL, and Licht JD (2018). Targeting Epigenetics in Cancer. Annu. Rev. Pharmacol. Toxicol 58, 187–207. [DOI] [PMC free article] [PubMed] [Google Scholar]
- Bolger AM, Lohse M, and Usadel B (2014). Trimmomatic: a flexible trimmer for Illumina sequence data. Bioinformatics 30, 2114–2120. [DOI] [PMC free article] [PubMed] [Google Scholar]
- Brinkman EK, Chen T, Amendola M, and van Steensel B (2014). Easy quantitative assessment of genome editing by sequence trace decomposition. Nucleic Acids Res 42, e168. [DOI] [PMC free article] [PubMed] [Google Scholar]
- Bruno PM, Liu Y, Park GY, Murai J, Koch CE, Eisen TJ, Pritchard JR, Pommier Y, Lippard SJ, and Hemann MT (2017). A subset of platinum-containing chemotherapeutic agents kills cells by inducing ribosome biogenesis stress. Nat. Med 23, 461–471. [DOI] [PMC free article] [PubMed] [Google Scholar]
- Burger K, Mühl B, Harasim T, Rohrmoser M, Malamoussi A, Orban M, Kellner M, Gruber-Eber A, Kremmer E, Hölzel M, and Eick D (2010). Chemotherapeutic drugs inhibit ribosome biogenesis at various levels. J. Biol. Chem 285, 12416–12425. [DOI] [PMC free article] [PubMed] [Google Scholar]
- Cao F, Townsend EC, Karatas H, Xu J, Li L, Lee S, Liu L, Chen Y, Ouillette P, Zhu J, et al. (2014). Targeting MLL1 H3K4 methyltransferase activity in mixed-lineage leukemia. Mol. Cell 53, 247–261. [DOI] [PMC free article] [PubMed] [Google Scholar]
- Carugo A, Genovese G, Seth S, Nezi L, Rose JL, Bossi D, Cicalese A, Shah PK, Viale A, Pettazzoni PF, et al. (2016). In Vivo Functional Platform Targeting Patient-Derived Xenografts Identifies WDR5-Myc Association as a Critical Determinant of Pancreatic Cancer. Cell Rep 16, 133–147. [DOI] [PubMed] [Google Scholar]
- Chen X, Xie W, Gu P, Cai Q, Wang B, Xie Y, Dong W, He W, Zhong G, Lin T, and Huang J (2015). Upregulated WDR5 promotes proliferation, self-renewal and chemoresistance in bladder cancer via mediating H3K4 trimethylation. Sci. Rep 5, 8293. [DOI] [PMC free article] [PubMed] [Google Scholar]
- Core LJ, Waterfall JJ, and Lis JT (2008). Nascent RNA sequencing reveals widespread pausing and divergent initiation at human promoters. Science 322, 1845–1848. [DOI] [PMC free article] [PubMed] [Google Scholar]
- Dai X, Guo W, Zhan C, Liu X, Bai Z, and Yang Y (2015). WDR5 Expression Is Prognostic of Breast Cancer Outcome. PLoS One 10, e0124964. [DOI] [PMC free article] [PubMed] [Google Scholar]
- Dobin A, Davis CA, Schlesinger F, Drenkow J, Zaleski C, Jha S, Batut P, Chaisson M, and Gingeras TR (2013). STAR: ultrafast universal RNA-seq aligner. Bioinformatics 29, 15–21. [DOI] [PMC free article] [PubMed] [Google Scholar]
- Dolezal JM, Dash AP, and Prochownik EV (2018). Diagnostic and prognostic implications of ribosomal protein transcript expression patterns in human cancers. BMC Cancer 18, 275. [DOI] [PMC free article] [PubMed] [Google Scholar]
- Emsley P, and Cowtan K (2004). Coot: model-building tools for molecular graphics. Acta Crystallogr. D Biol. Crystallogr 60, 2126–2132. [DOI] [PubMed] [Google Scholar]
- Feng J, Liu T, Qin B, Zhang Y, and Liu XS (2012). Identifying ChIP-seq enrichment using MACS. Nat. Protoc 7, 1728–1740. [DOI] [PMC free article] [PubMed] [Google Scholar]
- Garcia-Cuellar MP, Büttner C, Bartenhagen C, Dugas M, and Slany RK (2016). Leukemogenic MLL-ENL Fusions Induce Alternative Chromatin States to Drive a Functionally Dichotomous Group of Target Genes. Cell Rep 15, 310–322. [DOI] [PubMed] [Google Scholar]
- Ge Z, Song EJ, Kawasawa YI, Li J, Dovat S, and Song C (2016). WDR5 high expression and its effect on tumorigenesis in leukemia. Oncotarget 7, 37740–37754. [DOI] [PMC free article] [PubMed] [Google Scholar]
- Grebien F, Vedadi M, Getlik M, Giambruno R, Grover A, Avellino R, Skucha A, Vittori S, Kuznetsova E, Smil D, et al. (2015). Pharmacological targeting of the Wdr5-MLL interaction in C/EBPa N-terminal leukemia. Nat. Chem. Biol 11, 571–578. [DOI] [PMC free article] [PubMed] [Google Scholar]
- Guarnaccia AD, and Tansey WP (2018). Moonlighting with WDR5: A Cellular Multitasker. J. Clin. Med 7, E21. [DOI] [PMC free article] [PubMed] [Google Scholar]
- Hah N, Danko CG, Core L, Waterfall JJ, Siepel A, Lis JT, and Kraus WL (2011). A rapid, extensive, and transient transcriptional response to estrogen signaling in breast cancer cells. Cell 145, 622–634. [DOI] [PMC free article] [PubMed] [Google Scholar]
- Hah N, Murakami S, Nagari A, Danko CG, and Kraus WL (2013). Enhancer transcripts mark active estrogen receptor binding sites. Genome Res 23, 1210–1223. [DOI] [PMC free article] [PubMed] [Google Scholar]
- Harris BRE, Wang D, Zhang Y, Ferrari M, Okon A, Cleary MP, Wagner CR, and Yang DQ (2018). Induction of the p53 Tumor Suppressor in Cancer Cells through Inhibition of Cap-Dependent Translation. Mol. Cell. Biol 38, e00367–17. [DOI] [PMC free article] [PubMed] [Google Scholar]
- Jafari R, Almqvist H, Axelsson H, Ignatushchenko M, Lundbäck T, Nordlund P, and Martinez Molina D (2014). The cellular thermal shift assay for evaluating drug target interactions in cells. Nat. Protoc 9, 2100–2122. [DOI] [PubMed] [Google Scholar]
- Karatas H, Townsend EC, Bernard D, Dou Y, and Wang S (2010). Analysis of the binding of mixed lineage leukemia 1 (MLL1) and histone 3 peptides to WD repeat domain 5 (WDR5) for the design of inhibitors of the MLL1-WDR5 interaction. J. Med. Chem 53, 5179–5185. [DOI] [PMC free article] [PubMed] [Google Scholar]
- Kim KH, and Sederstrom JM (2015). Assaying Cell Cycle Status Using Flow Cytometry. Curr. Protoc. Mol. Biol 111, 28.6.1–28.6.11. [DOI] [PMC free article] [PubMed] [Google Scholar]
- Kim JS, Lee C, Bonifant CL, Ressom H, and Waldman T (2007). Activation of p53-dependent growth suppression in human cells by mutations in PTEN or PIK3CA. Mol. Cell. Biol 27, 662–677. [DOI] [PMC free article] [PubMed] [Google Scholar]
- Kwak H, Fuda NJ, Core LJ, and Lis JT (2013). Precise maps of RNA polymerase reveal how promoters direct initiation and pausing. Science 339, 950–953. [DOI] [PMC free article] [PubMed] [Google Scholar]
- Langmead B, and Salzberg SL (2012). Fast gapped-read alignment with Bowtie 2. Nat. Methods 9, 357–359. [DOI] [PMC free article] [PubMed] [Google Scholar]
- Langmead B, Trapnell C, Pop M, and Salzberg SL (2009). Ultrafast and memory-efficient alignment of short DNA sequences to the human genome. Genome Biol 10, R25. [DOI] [PMC free article] [PubMed] [Google Scholar]
- Liao Y, Smyth GK, and Shi W (2014). featureCounts: an efficient general purpose program for assigning sequence reads to genomic features. Bioinformatics 30, 923–930. [DOI] [PubMed] [Google Scholar]
- Liu J, Xu Y, Stoleru D, and Salic A (2012). Imaging protein synthesis in cells and tissues with an alkyne analog of puromycin. Proc. Natl. Acad. Sci. USA 109, 413–418. [DOI] [PMC free article] [PubMed] [Google Scholar]
- Lizio M, Harshbarger J, Shimoji H, Severin J, Kasukawa T, Sahin S, Abugessaisa I, Fukuda S, Hori F, Ishikawa-Kato S, et al. ; FANTOM Consortium (2015). Gateways to the FANTOM5 promoter level mammalian expression atlas. Genome Biol 16, 22. [DOI] [PMC free article] [PubMed] [Google Scholar]
- Love MI, Huber W, and Anders S (2014). Moderated estimation of fold change and dispersion for RNA-seq data with DESeq2. Genome Biol 15, 550. [DOI] [PMC free article] [PubMed] [Google Scholar]
- Mazurek A, Park Y, Miething C, Wilkinson JE, Gillis J, Lowe SW, Vakoc CR, and Stillman B (2014). Acquired dependence of acute myeloid leukemia on the DEAD-box RNA helicase DDX5. Cell Rep 7, 1887–1899. [DOI] [PMC free article] [PubMed] [Google Scholar]
- Méndez J, and Stillman B (2000). Chromatin association of human origin recognition complex, cdc6, and minichromosome maintenance proteins during the cell cycle: assembly of prereplication complexes in late mitosis. Mol. Cell. Biol 20, 8602–8612. [DOI] [PMC free article] [PubMed] [Google Scholar]
- Morgenstern JP, and Land H (1990). Advanced mammalian gene transfer: high titre retroviral vectors with multiple drug selection markers and a complementary helper-free packaging cell line. Nucleic Acids Res 18, 3587–3596. [DOI] [PMC free article] [PubMed] [Google Scholar]
- Nicolae CM, Aho ER, Vlahos AH, Choe KN, De S, Karras GI, and Moldovan GL (2014). The ADP-ribosyltransferase PARP10/ARTD10 interacts with proliferating cell nuclear antigen (PCNA) and is required for DNA damage tolerance. J. Biol. Chem 289, 13627–13637. [DOI] [PMC free article] [PubMed] [Google Scholar]
- Nikolovska-Coleska Z, Wang R, Fang X, Pan H, Tomita Y, Li P, Roller PP, Krajewski K, Saito NG, Stuckey JA, and Wang S (2004). Development and optimization of a binding assay for the XIAP BIR3 domain using fluorescence polarization. Anal. Biochem 332, 261–273. [DOI] [PubMed] [Google Scholar]
- Otwinowski A, and Minor W (1997). Processing of X-ray Diffraction Data Collected in Oscillation Mode Volume 276 (Academic Press; ). [DOI] [PubMed] [Google Scholar]
- Patel A, Vought VE, Dharmarajan V, and Cosgrove MS (2008). A conserved arginine-containing motif crucial for the assembly and enzymatic activity of the mixed lineage leukemia protein-1 core complex. J. Biol. Chem 283, 32162–32175. [DOI] [PubMed] [Google Scholar]
- Pelletier J, Thomas G, and Volarević S (2018). Ribosome biogenesis in cancer: new players and therapeutic avenues. Nat. Rev. Cancer 18, 51–63. [DOI] [PubMed] [Google Scholar]
- Rinker EB, Dueber JC, Qualtieri J, Tedesco J, Erdogan B, Bosompem A, and Kim AS (2016). Differential expression of ribosomal proteins in myelodysplastic syndromes. J. Clin. Pathol 69, 176–180. [DOI] [PubMed] [Google Scholar]
- Russo A, and Russo G (2017). Ribosomal Proteins Control or Bypass p53 during Nucleolar Stress. Int. J. Mol. Sci 18, 140. [DOI] [PMC free article] [PubMed] [Google Scholar]
- Sarbassov DD, Guertin DA, Ali SM, and Sabatini DM (2005). Phosphor-ylation and regulation of Akt/PKB by the rictor-mTOR complex. Science 307, 1098–1101. [DOI] [PubMed] [Google Scholar]
- Schindelin J, Arganda-Carreras I, Frise E, Kaynig V, Longair M, Pietzsch T, Preibisch S, Rueden C, Saalfeld S, Schmid B, et al. (2012). Fiji: an open-source platform for biological-image analysis. Nat. Methods 9, 676–682. [DOI] [PMC free article] [PubMed] [Google Scholar]
- Signer RA, Magee JA, Salic A, and Morrison SJ (2014). Haematopoietic stem cells require a highly regulated protein synthesis rate. Nature 509, 49–54. [DOI] [PMC free article] [PubMed] [Google Scholar]
- Stark R, and Brown GD (2011). DiffBind: differential binding analysis of ChIP-seq peak data http://bioconductor.org/packages/release/bioc/vignettes/DiffBind/inst/doc/DiffBind.pdf.
- Stegh AH (2012). Targeting the p53 signaling pathway in cancer therapy - the promises, challenges and perils. Expert Opin. Ther. Targets 16, 67–83. [DOI] [PMC free article] [PubMed] [Google Scholar]
- Subramanian A, Tamayo P, Mootha VK, Mukherjee S, Ebert BL, Gillette MA, Paulovich A, Pomeroy SL, Golub TR, Lander ES, and Mesirov JP (2005). Gene set enrichment analysis: a knowledge-based approach for interpreting genome-wide expression profiles. Proc. Natl. Acad. Sci. USA 102, 15545–15550. [DOI] [PMC free article] [PubMed] [Google Scholar]
- Tan X, Chen S, Wu J, Lin J, Pan C, Ying X, Pan Z, Qiu L, Liu R, Geng R, and Huang W (2017). PI3K/AKT-mediated upregulation of WDR5 promotes colorectal cancer metastasis by directly targeting ZNF407. Cell Death Dis 8, e2686. [DOI] [PMC free article] [PubMed] [Google Scholar]
- Thomas LR, Wang Q, Grieb BC, Phan J, Foshage AM, Sun Q, Olejniczak ET, Clark T, Dey S, Lorey S, et al. (2015). Interaction with WDR5 promotes target gene recognition and tumorigenesis by MYC. Mol. Cell 58 440–452. [DOI] [PMC free article] [PubMed] [Google Scholar]
- Tsherniak A, Vazquez F, Montgomery PG, Weir BA, Kryukov G, Cowley GS, Gill S, Harrington WF, Pantel S, Krill-Burger JM, et al. (2017). Defining a Cancer Dependency Map. Cell 170, 564–576.e16. [DOI] [PMC free article] [PubMed] [Google Scholar]
- Wang F, Jeon KO, Salovich JM, Macdonald JD, Alvarado J, Gogliotti RD, Phan J, Olejniczak ET, Sun Q, Wang S, et al. (2018). Discovery of Potent 2-Aryl-6,7-Dihydro-5 H-Pyrrolo[1,2- a]imidazoles as WDR5 WIN-site Inhibitors Using Fragment-Based Methods and Structure-Based Design. J. Med. Chem 61, 5623–5642. [DOI] [PMC free article] [PubMed] [Google Scholar]
- Wei J, Wunderlich M, Fox C, Alvarez S, Cigudosa JC, Wilhelm JS, Zheng Y, Cancelas JA, Gu Y, Jansen M, et al. (2008). Microenvironment determines lineage fate in a human model of MLL-AF9 leukemia. Cancer Cell 13, 483–495. [DOI] [PMC free article] [PubMed] [Google Scholar]
- Winn MD, Ballard CC, Cowtan KD, Dodson EJ, Emsley P, Evans PR, Keegan RM, Krissinel EB, Leslie AG, McCoy A, et al. (2011). Overview of the CCP4 suite and current developments. Acta Crystallogr. D Biol. Crystallogr 67, 235–242. [DOI] [PMC free article] [PubMed] [Google Scholar]
- Wu MZ, Tsai YP, Yang MH, Huang CH, Chang SY, Chang CC, Teng SC, and Wu KJ (2011). Interplay between HDAC3 and WDR5 is essential for hypoxia-induced epithelial-mesenchymal transition. Mol. Cell 43, 811–822. [DOI] [PubMed] [Google Scholar]
- Wunderlich M, Mizukawa B, Chou FS, Sexton C, Shrestha M, Saunthararajah Y, and Mulloy JC (2013). AML cells are differentially sensitive to chemotherapy treatment in a human xenograft model. Blood 121, e90–e97. [DOI] [PMC free article] [PubMed] [Google Scholar]
- Yang DQ, Halaby MJ, and Zhang Y (2006). The identification of an internal ribosomal entry site in the 5′-untranslated region of p53 mRNA provides a novel mechanism for the regulation of its translation following DNA damage. Oncogene 25, 4613–4619. [DOI] [PubMed] [Google Scholar]
- Zhao Y, Liu Q, Acharya P, Stengel KR, Sheng Q, Zhou X, Kwak H, Fischer MA, Bradner JE, Strickland SA, et al. (2016). High-Resolution Mapping of RNA Polymerases Identifies Mechanisms of Sensitivity and Resistance to BET Inhibitors in t(8;21) AML. Cell Rep 16, 2003–2016. [DOI] [PMC free article] [PubMed] [Google Scholar]
- Zhu J, Sammons MA, Donahue G, Dou Z, Vedadi M, Getlik M, Barsyte-Lovejoy D, Al-awar R, Katona BW, Shilatifard A, et al. (2015). Gain-of-function p53 mutants co-opt chromatin pathways to drive cancer growth. Nature 525, 206–211. [DOI] [PMC free article] [PubMed] [Google Scholar]
- Zuber J, McJunkin K, Fellmann C, Dow LE, Taylor MJ, Hannon GJ, and Lowe SW (2011). Toolkit for evaluating genes required for proliferation and survival using tetracycline-regulated RNAi. Nat. Biotechnol 29, 79–83. [DOI] [PMC free article] [PubMed] [Google Scholar]
Associated Data
This section collects any data citations, data availability statements, or supplementary materials included in this article.
Supplementary Materials
Data Availability Statement
All genomic datasets (for ChIP-Seq, RNA-Seq, and PRO-Seq) have been deposited at the Gene Expression Omnibus (GEO) with accession number GEO: GSE115377. X-ray crystal structures have been deposited at the Protein Data Bank (PDB) with accession codes PDB: 6DY7, 6EY1, 6E22, 6E1Z, 6DYA, and 6E23.