

Watch a video presentation of this article
Alcoholic liver disease (ALD), either alone or in association with obesity or viral hepatitis, is one of the most common liver diseases worldwide. Three major challenges limit recognition of ALD: underreporting by patients of alcohol consumption, a lack of good biomarkers for alcohol consumption, and a diverse clinical presentation. These are the reasons why ALD is routinely underestimated by both physicians and health statistics.1, 2 The diagnosis of ALD relies on a combination of clinical, laboratory, elastographic, and imaging findings. Although ALD follows the typical sequence of chronic liver diseases, including alcoholic fatty liver, steatohepatitis, fibrosis, and eventually cirrhosis, early recognition of severe steatohepatitis and/or alcoholic cirrhosis may save lives, prevent complications, and lead to healthy follow‐up programs. The recent introduction of novel elastographic techniques such as transient elastography (TE) has improved the ability to assess the manifestation and progression of fibrosis in patients with ALD. This is an important step forward because conventional approaches such as imaging and routine blood tests are known to overlook nearly 40% of patients with advanced fibrosis. Nevertheless, liver biopsy remains an important confirmatory test in selected patients, to assess the relative contribution of ALD to liver damage, and to better estimate the prognosis.
Abbreviations.
AFP, alpha‐fetoprotein; ALD, alcoholic liver disease; ARFI, acoustic radiation force impulse imaging; CAP, controlled attenuation parameter; CDT, carbohydrate‐deficient transferrin; CT, computed tomography; GGT, gamma‐glutamyltransferase; GOT, glutamic oxaloacetic transaminase; GPT, glutamic pyruvic transaminase; HCC, hepatocellular carcinoma; INR, international normalized ratio; LS, liver stiffness; MCV, mean corpuscular volume; MRE, magnetic resonance elastography; MRI, magnetic resonance imaging; SWE, shear wave elastography; TE, transient elastography; US, ultrasound; V, shear wave velocity.
Clinical Approach
Documenting the patients alcohol consumption (often called 'the drinking history') is the first step to establishing ALD as the cause of liver disease. Then, different clinical stages of ALD, such as fatty liver, alcoholic steatohepatitis, fibrosis, and eventually cirrhosis, should be ascertained1 (Fig. 1). Reported alcohol consumption greater than 20 g/day for females and greater than 30 g/day for males is a prerequisite, although a genetic background or other comorbidities can certainly lower this threshold. Except for the direct measurement of alcohol in serum as a sign of acute alcohol intake within the last 20 hours, no single laboratory marker can definitively establish chronic alcohol consumption as the etiology of liver disease. Two biomarkers of recent alcohol intake are in clinical use: ethyl glucuronide, which gives an estimate of drinking in the previous 3 days and, more widely, carbohydrate‐deficient transferrin or 'CDT' which estimates consumption in the previous 4–21 days. However, CDT has only a moderate sensitivity of 60% with a daily alcohol consumption of 50 g or more. The diagnosis of ALD sometimes requires a more extended clinically experienced view at the patient's symptoms. Thus, consequences of alcohol may manifest first in the brain (Wernicke‐Korsakoff syndrome), in the peripheral nerves (polyneuropathy), or as alcoholic cardiomyopathy (to name only a few). Likewise, rib fractures are common on X‐ray images and may be even more diagnostic for ALD than an elevated gamma‐glutamyltransferase (GGT) level. Some other clinical symptoms more specific for ALD include parotid enlargement, Dupuytren's contracture, and especially those signs associated with feminization.
Figure 1.
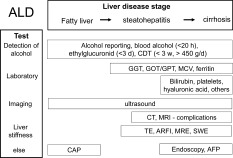
General noninvasive approach to patients with suspected ALD. The various tests help to establish alcohol as the cause and the stage of progression of the disease.
Diagnosis of ALD by Blood Tests
Blood tests such as mean corpuscular volume (MCV), GGT, glutamic oxaloacetic transaminase (GOT), also known as aspartate aminotransferase (AST), and glutamic pyruvic transaminase (GPT) are routinely available, and typically, patterns can be described for patients with ALD that depend on the stage of progression of liver disease. GGT is one of the best markers of ALD with a combined sensitivity and specificity > 70%. An elevation of GGT is due not to liver damage but to the induction of enzymatic activity. GGT loses its alcohol specificity in more advanced stages. GOT is typically elevated to a level 2 to 6 times the upper limit of normal in severe alcoholic hepatitis, whereas GOT levels greater than 300 IU/L are rarely seen. In approximately 70% of patients, the GOT/GPT (or AST/ALT) ratio is higher than 2. The blood count also shows typical features in patients with ALD. An increased MCV seems to be an equally sensitive indicator of ALD as elevated transaminases. Low platelet counts are associated with cirrhosis complicated by portal hypertension, and elevated leukocyte levels are a prognostically‐relevant sign of acute alcoholic steatohepatitis. The combination of these routine blood tests further increases their diagnostic accuracy for ALD, with a sensitivity and specificity > 90% for GGT, MCV, immunoglobulin A, CDT, and the GOT/GPT ratio. Direct bilirubin levels are also being increasingly noted in ALD patients with either cirrhosis or severe steatohepatitis. Table 1 shows the percentage of elevated routine blood tests, together with some common ultrasound (US) parameters, drawn from our Heidelberg cohort of patients with ALD (n: 235). The fibrosis profile of this population was 61.7%, 10%, 10%, and 18.1% for F0, F1/F2, F3, and F4 cirrhosis, respectively. Changes in iron status are also very common and can be easily mistaken for hereditary iron overload disease. In the Heidelberg population, serum ferritin levels were greater than normal (>400 ng/mL) in 37% and greater than 1000 ng/mL in 16% (see Table 1). Transferrin saturation was also often elevated (>45%) in 36% and was >60% in more than 20% of patients. It is, therefore,essential in some cases to ask the patient to abstain from alcohol for at least 4 weeks because liver iron parameters will decrease or even normalize when alcohol is held.
Table 1.
Percentage of Elevated Typical Routine Laboratory Tests and US Parameters for the Actual Heidelberg Cohort of ALD patients (n = 235)
| Parameter | All (%) | No or low fibrosis (F0‐2) (%) | Advanced fibrosis (F3‐4) (%) |
|---|---|---|---|
| Laboratory | |||
| GGT >60 IU/L | 75.0 | 61.9 | 95.2 |
| GOT/GPT >1 | 81.3 | 77.1 | 92.9 |
| GOT >50 IU/L | 60.1 | 51.4 | 88.1 |
| GPT >50 IU/L | 46.5 | 41.6 | 66.7 |
| Ferritin >400 ng/mL | 37.3 | 28.6 | 66.7 |
| Transferrin saturation >45% (%) | 36.1 | 27.8 | 55.3 |
| Bilirubin >1.3 mg/dL | 15.8 | 5.7 | 26.2 |
| US | |||
| Sonographic signs of cirrhosis (%) | 19.6 | 1.0 | 40.0 |
| Splenomegaly (>11 cm) (%) | 11.4 | 0.0 | 15.0 |
| Ascites (%) | 25.7 | 17.6 | 32.3 |
Serum Markers and Hepatic Imaging Studies
A large number of noninvasive biomarkers of fibrosis have been explored in the last 2 decades.3 Some rely on biochemical parameters together with other clinical features. The so‐called FibroTest has been evaluated in ALD and has been shown to reach a diagnostic accuracy of 0.8.3 Other proposed markers include the enhanced liver fibrosis test and caspase cleaved fragments of cytokeratin 18. However, these serum markers have not been well studied with respect to interfering steatohepatitis, nor have they found frequent usage in clinical practice. In a recent direct comparative study, measurements of liver stiffness (LS) were superior for all fibrosis stages in comparison to several serum markers. In the Heidelberg cohort, LS was also superior in comparison to various serum markers (not published). Interestingly, the best single serum marker was hyaluronate, confirming the previous studies of Pares et al.4; it had a Pearson correlation coefficient of 0.7 (P < 10E−11, n = 70) with the histological fibrosis score and was less affected by inflammation.
Imaging techniques such as US, magnetic resonance imaging (MRI), and computed tomography (CT) allow the detection of fatty liver and the assessment of advanced liver disease and its complications [e.g., hepatocellular carcinoma (HCC)]. The major role of imaging techniques is to exclude other causes of abnormal liver tests in a patient who abuses alcohol, such as obstructive cholestasis, and infiltrative and neoplastic diseases of the liver. Newer US‐based techniques such as controlled attenuation parameter (CAP) are more reproducible and quantitative with an area under the receiver operating characteristic curve up to 90% for fatty liver.5 Although promising, the histological validation of CAP to detect alcoholic steatosis is still pending.
Assessment of the Fibrosis Stage via LS
The assessment of LS has significantly improved the diagnosis of fibrosis.6, 7 Most clinical data on LS have been obtained with TE (FibroScan), which was the first technique to be introduced and is the most widely used. However, no Food and Drug Administration approval exists yet for the United States. Alternative techniques such as acoustic radiation force impulse imaging (ARFI; Siemens) and shear wave elastography (SWE; Supersonic Imaging) have already been approved by the Food and Drug Administration, but only a few liver‐related studies are available. Magnetic resonance elastography (MRE) is another promising technique, but it is performed at very few centers. Although ARFI, SWE, and MRE seem to be comparable to TE with respect to accuracy, more studies are expected in the future that will better define the strengths, individual indications, and limitations of each technical approach. All conclusions made here refer to LS in general and are independent of the technique used. However, caution should be taken not to mix up units of LS obtained with the different technical approaches. All three approaches calculate the stiffness from the shear wave velocity (V) and are roughly interlinked by the following equation:
where V is measured in meters per second. Although TE data are given in kilopascals, ARFI uses meters per second, and SWE delivers the data in both meters per second and kilopascals. Table 2 compares typical cutoff values for F3 and F4 fibrosis obtained with the four major techniques: TE, ARFI, SWE, and MRE.
Table 2.
Typical Cutoff Values for F3 and F4 Fibrosis Obtained With Different Elastographic Techniques (TE, MRE, ARFI, and SWE)
| Normal Liver | Fibrosis (F3) | Cirrhosis (F4) | |
|---|---|---|---|
| TE (kPa) | <6.0 | 8.0 | 12.5 |
| MRE (kPa) | <6.0 | 8.0 | 15.0 |
| ARFI (m/second) | <1.5 | 1.8 | 2.0 |
| SWE (kPa) | <6.0 | 10.0 | 14.0 |
In ALD patients, LS is an excellent surrogate marker of advanced fibrosis (F3) and cirrhosis (F4) and is superior to serum markers.8 LS values less than 6 kPa are considered normal. Although severe steatosis may partly lower LS, it rarely has an impact on fibrosis scoring by LS. LS values of 8 and 12.5 kPa represent generally accepted cutoff values for F3 and F4 fibrosis for TE. Because of the rather narrow gray range from 6 to 8 kPa and potential interference from positioning, breathing, or eating, for example, the discrimination of stages F1 and F2 is not feasible for clinical purposes. Finally, LS highly correlates with portal pressure, and esophageal varices and HCC are likely at values > 20 kPa.6, 7
Several clinically relevant conditions, such as inflammation, liver congestion, or mechanic cholestasis may increase LS in the absence of fibrosis (Fig. 2). Because all these conditions can be present in patients with ALD, LS should always be interpreted in the context of clinical, imaging, and laboratory findings. That is, the patient should abstain at last 2 weeks from alcohol if GOT levels are higher than 100 U/L.9 Our presently used algorithm is shown in Fig. 3. These data have been confirmed by others.10 Figure 4 shows changes in the fibrosis score according to LS in a second independent study cohort (n = 235) from our center undergoing sequential LS measurements before and after alcohol detoxification. Approximately 5% of our cohort actually had increased LS values during alcohol withdrawal, perhaps because of clandestine drinking,11 or hitherto unknown biological causes such as cardiomyopathy. A final overall workup plan practiced daily at the Salem Medical Center is shown in Fig. 5. In cases of elevated LS and GOT levels > 100 U/mL, the patients should abstain from alcohol for at least 2 weeks, and LS should be redetermined. This approach allows a definitive noninvasive assessment of the fibrosis stage in approximately 95%. In a recent elastography screening study of more than 1000 apparently healthy people, 7.5% had pathologically increased LS > 8 kPa, with 36% of cases eventually found to be due to ALD.12 Therefore, it is anticipated that these novel noninvasive screening tools will improve the early recognition and follow‐up of patients with ALD.
Figure 2.
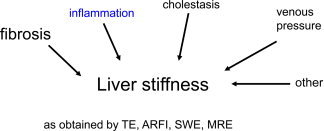
LS can be significantly increased by various clinical conditions coexisting in patients with ALD, regardless of the fibrosis stage. These conditions need to be defined in each patient and can be easily defined with routine laboratory tests and US examinations.
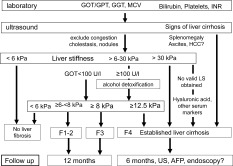
Figure 3.
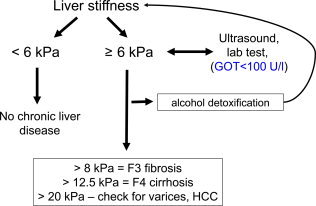
Diagnostic algorithm used at Salem Medical Center (Heidelberg, Germany) to assess the fibrosis stage by TE in a noninvasive manner. In the absence of LS‐elevating conditions such as congestion, cholestasis, and inflammation (alcoholic steatohepatitis), the assessment of fibrosis via LS is very accurate (area under the receiver operating characteristic curve > 0.95). For the correct interpretation of LS, TE should be performed right after an abdominal US examination, and actual transaminase levels are required. When the GOT level is elevated (>100 U/L), patients should abstain from alcohol for at least 2 weeks, and LS should be reassessed. The cutoff values are related to LS as measured by TE.
Figure 4.
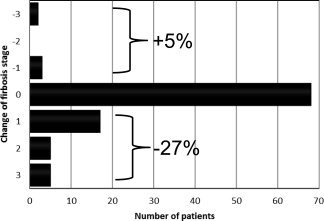
Changes in the fibrosis stage as determined by LS in patients with ALD in the Heidelberg cohort (n = 235) during alcohol detoxification. Alcohol withdrawal and the resolution of alcoholic steatohepatitis resulted in a decrease in the LS‐based fibrosis score in 27%. This needs to be considered when one is assessing the fibrosis stage in ALD patients via LS.
Figure 5.
Complete noninvasive diagnostic work flow for patients with ALD (including follow‐up recommendations). This scheme actually allows correct and valid fibrosis allocation for 95% of patients. The role of serum markers for the remaining 5% not measurable by LS remains to be settled.
Potential conflict of interest: Nothing to report.
References
- 1. Seitz HK, Mueller S. Alcoholic liver disease In: Dancygier H, ed. Clinical Hepatology: Principles and Practice of Hepatobiliary Diseases. Heidelberg, Germany: Springer; 2009: 1111–1152. [Google Scholar]
- 2. European Association for the Study of the Liver . EASL clinical practical guidelines: management of alcoholic liver disease. J Hepatol 2012; 57: 399–420. [DOI] [PubMed] [Google Scholar]
- 3. Naveau S, Gaude G, Asnacios A, Agostini H, Abella A, Barri‐Ova N, et al. Diagnostic and prognostic values of noninvasive biomarkers of fibrosis in patients with alcoholic liver disease. Hepatology 2009; 49: 97–105. [DOI] [PubMed] [Google Scholar]
- 4. Pares A, Deulofeu R, Gimenez A, Caballeria L, Bruguera M, Caballeria J, et al. Serum hyaluronate reflects hepatic fibrogenesis in alcoholic liver disease and is useful as a marker of fibrosis. Hepatology 1996; 24: 1399–1403. [DOI] [PubMed] [Google Scholar]
- 5. Sasso M, Beaugrand M, de Ledinghen V, Douvin C, Marcellin P, Poupon R, et al. Controlled attenuation parameter (CAP): a novel VCTE™ guided ultrasonic attenuation measurement for the evaluation of hepatic steatosis: preliminary study and validation in a cohort of patients with chronic liver disease from various causes. Ultrasound Med Biol 2010; 36: 1825–1835. [DOI] [PubMed] [Google Scholar]
- 6. Mueller S, Sandrin L. Liver stiffness: a novel parameter for the diagnosis of liver disease. Hepatic Med 2010; 2: 49–67. [DOI] [PMC free article] [PubMed] [Google Scholar]
- 7. Castera L, Pinzani M. Biopsy and non‐invasive methods for the diagnosis of liver fibrosis: does it take two to tango? Gut 2010; 59: 861–866. [DOI] [PubMed] [Google Scholar]
- 8. Nguyen‐Khac E, Chatelain D, Tramier B, Decrombecque C, Robert B, Joly JP, et al. Assessment of asymptomatic liver fibrosis in alcoholic patients using FibroScan: prospective comparison with seven non‐invasive laboratory tests. Aliment Pharmacol Ther 2008; 28: 1188–1198. [DOI] [PubMed] [Google Scholar]
- 9. Mueller S, Millonig G, Sarovska L, Friedrich S, Reimann FM, Pritsch M, et al. Increased liver stiffness in alcoholic liver disease: differentiating fibrosis from steatohepatitis. World J Gastroenterol 2010; 16: 966–972. [DOI] [PMC free article] [PubMed] [Google Scholar]
- 10. Trabut JB, Thepot V, Nalpas B, Lavielle B, Cosconea S, Corouge M, et al. Rapid decline of liver stiffness following alcohol withdrawal in heavy drinkers. Alcohol Clin Exp Res 2012; 36: 1407–1411. [DOI] [PubMed] [Google Scholar]
- 11. Gelsi E, Dainese R, Truchi R, Marine‐Barjoan E, Anty R, Autuori M, et al. Effect of detoxification on liver stiffness assessed by FibroScan® in alcoholic patients. Alcohol Clin Exp Res 2011; 35: 566–570. [DOI] [PubMed] [Google Scholar]
- 12. Roulot D, Costes JL, Buyck JF, Warzocha U, Gambier N, Czernichow S, et al. Transient elastography as a screening tool for liver fibrosis and cirrhosis in a community‐based population aged over 45 years. Gut 2011; 60: 977–984. [DOI] [PubMed] [Google Scholar]