

Watch a video presentation of this article
Watch the interview with the author
The development of decompensated disease and complications of portal hypertension portends a poor prognosis for patients with cirrhosis. In comparison with the general population, patients with cirrhosis and compensated disease have a 5‐fold increase in mortality, and patients with cirrhosis and decompensated disease have a 10‐fold increase in mortality.1 Survival is lower at 1 (75% versus 87%) and 5 years (45% versus 67%) for persons with decompensated cirrhosis versus persons with compensated cirrhosis.1 The development of hyponatremia, ascites, and renal failure represents an unfortunate marker of disease severity in the natural history of cirrhosis.
Ascites
The development of ascites portends poor survival. Among alcoholics studied in the Danish National Health registry (1993‐2005), the 1‐year survival rates were 80% (variceal bleeding), 71% (ascites), 51% (ascites and variceal bleeding), and 36% (hepatic encephalopathy alone or in combination).2 The presence of an infection, that is, spontaneous bacterial peritonitis (SBP), indicates a poorer outcome. In a recent meta‐analysis,3 the overall median mortality rate for infected patients was 38%. In a subset of studies of SBP, the median mortality rate was 44% (1‐year survival = 34%). Therefore, the prevention of infection remains a mainstay for decreasing mortality in patients with ascites. This includes primary prophylaxis for patients with cirrhosis who present with gastrointestinal bleeding and secondary prophylaxis for patients with a prior episode of SBP. In patients with a new diagnosis of ascites, a diagnostic paracentesis is imperative and serves as an important tool for predicting outcomes. Patients with low‐protein ascites (<1.5 mg/dL) and specifically those with either severe liver disease (Child‐Pugh score > 9 points and serum bilirubin level > 3 mg/dL) or renal dysfunction (serum creatinine level > 1.2 mg/dL, blood urea nitrogen level > 25 mg/dL, or serum sodium level < 130 mEq/L) benefit from primary antibiotic prophylaxis to prevent SBP (7% versus 61%), hepatorenal syndrome (HRS; 28% versus 41%), and 1‐year mortality (40% versus 52%)4 (Fig. 1).
Figure 1.

Primary prophylaxis for the prevention of SBP among patients with cirrhosis or significant renal dysfunction. Reprinted with permission from Gastroenterology.4 Copyright 2007, Elsevier.
Hyponatremia
Hyponatremia is an independent predictor of 3‐month and 1‐year mortality for patients with liver disease.5 Hyponatremia is likely a marker for advanced renal dysfunction associated with cirrhosis that is not accurately captured by creatinine‐based measures.6 Even after adjustments for Model for End‐Stage Liver Disease (MELD) scores, a 1 mmol/L decrease in the serum sodium concentration between 125 and 140 mmol/L is associated with a 5% to 10% increase in mortality.5
Renal Failure
Renal failure is common among patients with cirrhosis and is often due to several causes.7 In comparison with patients without renal failure, patients with cirrhosis and renal dysfunction have a significantly increased risk of death (odds ratio = 7.6, confidence interval = 5.4‐10.8).8 The median survival rate for patients with cirrhosis and renal failure is 42% at 1 month and 37% at 1 year.8 Although renal failure itself is associated with a poor prognosis, recent data suggest that the cause of renal failure may help to predict the outcome. In a single‐center study,9 the survival rate at 3 months was 73% for patients with cirrhosis and intrinsic renal disease, 46% for patients with volume‐related renal failure, 31% for patients with infection‐related renal failure, and 15% for patients with HRS (Fig. 2). The cause of renal failure was an independent predictor of mortality after adjustments for the MELD score and serum sodium. In a separate single‐center study,10 the cause of renal failure was an important predictor of renal dysfunction and mortality 1 year after liver transplantation (Fig. 3). Patients with acute tubular necrosis (ATN) had the highest cumulative incidence of chronic kidney disease; the incidence of chronic kidney disease at 5 years was higher for patients with ATN versus patients with HRS (56% versus 16%). The presence of ATN at the time of liver transplantation was associated with a 7‐fold increase in mortality 1 year after transplantation (odds ratio = 6.7, confidence interval = 1.97‐22.8).10 The presence of ATN in unselected patients undergoing renal biopsy at the time of liver transplantation is a predictor of worse renal function 1 year after liver transplantation.11
Figure 2.
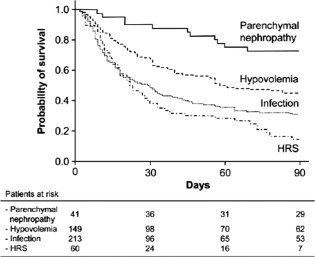
Etiology of renal failure as a predictor of mortality among patients with cirrhosis. Reprinted with permission from Gastroenterology.9 Copyright 2011, Elsevier.
Figure 3.

Etiology of pre–liver transplant renal failure as a predictor of mortality after liver transplantation. Reprinted with permission from Liver Transplantation.10 Copyright 2012, American Association for the Study of Liver Diseases.
In addition, the method of renal function measurement is important. The inclusion of serum creatinine is suboptimal for patients with cirrhosis.6, 12 The measured glomerular filtration rate (e.g., by iothalamate clearance measurement) is better at assessing prognosis.12 The role of cystatin C in the assessment of renal dysfunction in patients with cirrhosis is currently being evaluated. Furthermore, the role of urinary biomarkers as predictors of early renal dysfunction continues to evolve.
Prognostic Models (Table 1)
Table 1.
Prognostic Scores for the Assessment of Patients With Cirrhosis
| Child‐Pugh Score* | |||
|---|---|---|---|
| 1 Point | 2 Points | 3 Points | |
| Total bilirubin (mg/dL) | ≤2 | 2–3 | >3 |
| Serum albumin (g/dL) | >3.5 | 2.8–3.5 | <2.8 |
| INR | <1.7 | 1.7–2.3 | > 2.3 |
| Ascites | None | Mild | Moderate to severe |
| Hepatic encephalopathy | None | Grade I‐II | Grade III‐IV |
| MELD Score†, 13 | |||
| MELD score = 3.8 × loge Bilirubin + 11.2 × loge INR + 9.6 × loge Creatinine + 6.4 | |||
| MELD‐Na Score‡, 5 | |||
| MELD‐Na score = MELD score − Na − [0.025 × MELD × (140 − Na)] + 140 | |||
| Refit MELD Score§, 14 | |||
| Refit MELD score = 4.082 × loge Bilirubin + 8.485 × loge Creatinine + 10.671 × loge INR + 7.432 | |||
| Refit MELD‐Na Score∥, 14 | |||
| Refit MELD‐Na score = 4.258 × loge Bilirubin + 6.792 × loge Creatinine + 8.290 × loge INR + 0.652 × (140 − Na) − 0.194 × (140 − Na) × Bilirubin# + 6.327 | |||
Abbreviations: INR, international normalized ratio; Na, serum sodium concentration.
The Child‐Pugh stage is determined as follows: (A) 5 to 6 points, (B) 7 to 9 points, and (C) 10 to 15 points.
The bilirubin and creatinine levels are measured in milligrams per deciliter.
The lower and upper boundaries for Na are 125 and 140 mmol/L, respectively.
The lower boundary for bilirubin is 1 mg/dL. The lower and upper boundaries for creatinine are 0.8 and 3 mg/dL, respectively. The lower and upper boundaries for INR are 1 and 3, respectively. Renal replacement therapy is equal to 3 mg/dL.
The lower boundary for bilirubin is 1 mg/dL. The lower and upper boundaries for creatinine are 0.8 and 3 mg/dL, respectively. The lower and upper boundaries for INR are 1 and 3, respectively. Renal replacement therapy is equal to 3 mg/dL. The lower and upper boundaries for bilirubin# are 1 and 20 mg/dL, respectively.
The Child‐Pugh score continues to be an important tool for predicting the prognosis of patients with decompensated liver disease and ascites. The median 1‐year survival rate is 95% for Child A cirrhosis, 80% for Child B cirrhosis, and 45% for Child C cirrhosis.15 Besides its subjective nature, the lack of inclusion of variables that assess renal function is a limitation of the Child‐Pugh score.
The MELD score is a commonly used metric of underlying disease severity.16 The benefits of the MELD score lie in its simplicity, use of a continuous scale, and incorporation of easily available and objective laboratory parameters. The MELD score has a high concordance for predicting the risk of death within 3 months (c statistic = 0.83) and 1 year (c statistic = 0.75). The individual complications of portal hypertension (e.g., ascites) do not significantly enhance the prognostic information.16 The MELD score captures the importance of renal failure as a marker of advanced liver disease. However, an obvious limitation is its inclusion of serum creatinine as reflective of renal dysfunction. A multivariate model that incorporates the calculated glomerular filtration rate and/or serum sodium is superior to the MELD score.6
As mentioned previously, serum sodium is likely a marker for advanced renal dysfunction that is not accurately captured by creatinine‐based measures and adds prognostic value [Model for End‐Stage Liver Disease with sodium (MELD‐Na)]. The incorporation of the MELD‐Na score (c statistic = 0.88) as a predictor of mortality for persons with advanced liver disease implies that 88 out of 100 times, the MELD‐Na score can accurately predict that the patient with a higher score in a pair of patients with cirrhosis has the higher risk of death within 3 months.
Recently, attempts have been made to reweigh the components of the MELD score with a contemporary data set, and they have improved the predictive ability of MELD‐based scores consistently to a c statistic > 0.87.14, 17 Further validation is awaited.
Summary
The development of hyponatremia, ascites, and renal failure represents an unfortunate milestone in the natural history of cirrhosis. First, patients with low‐protein ascites and severe liver disease or renal dysfunction have a poor prognosis and may benefit from primary antibiotic prophylaxis. Second, serum sodium is a marker for advanced renal dysfunction that is not accurately captured by serum creatinine–based measures and adds prognostic value. Third, the cause of renal failure independently predicts mortality after adjustments for the MELD score and serum sodium. Direct measurements of renal function are better than creatinine‐based estimates of renal function and prognosis. The role of urinary markers continues to evolve. Fourth, prognostic scores used in the assessment of patients with cirrhosis include the Child‐Pugh score, MELD score, MELD‐Na score, and newer iterations that refit the coefficients of the MELD score.
Potential conflict of interest: Nothing to report.
References
- 1. Fleming KM, Aithal GP, Card TR, West J. All‐cause mortality in people with cirrhosis compared with the general population: a population‐based cohort study. Liver Int 2012; 32: 79–84. [DOI] [PubMed] [Google Scholar]
- 2. Jepsen P, Ott P, Andersen PK, Sorensen HT, Vilstrup H. Clinical course of alcoholic liver cirrhosis: a Danish population‐based cohort study. Hepatology 2010; 51: 1675–1682. [DOI] [PubMed] [Google Scholar]
- 3. Arvaniti V, D'Amico G, Fede G, Manousou P, Tsochatzis E, Pleguezuelo M, et al. Infections in patients with cirrhosis increase mortality four‐fold and should be used in determining prognosis. Gastroenterology 2010; 139: 1246–1256. [DOI] [PubMed] [Google Scholar]
- 4. Fernandez J, Navasa M, Planas R, Montoliu S, Monfort D, Soriano G, et al. Primary prophylaxis of spontaneous bacterial peritonitis delays hepatorenal syndrome and improves survival in cirrhosis. Gastroenterology 2007; 133: 818–824. [DOI] [PubMed] [Google Scholar]
- 5. Kim WR, Biggins SW, Kremers WK, Wiesner RH, Kamath PS, Benson JT, et al. Hyponatremia and mortality among patients on the liver‐transplant waiting list. N Engl J Med 2008; 359: 1018–1026. [DOI] [PMC free article] [PubMed] [Google Scholar]
- 6. Lim YS, Larson TS, Benson JT, Kamath PS, Kremers WK, Therneau TM, et al. Serum sodium, renal function, and survival of patients with end‐stage liver disease. J Hepatol 2010; 52: 523–528. [DOI] [PMC free article] [PubMed] [Google Scholar]
- 7. Gines P, Schrier RW. Renal failure in cirrhosis. N Engl J Med 2009; 361: 1279–1290. [DOI] [PubMed] [Google Scholar]
- 8. Fede G, D'Amico G, Arvaniti V, Tsochatzis E, Germani G, Georgiadis D, et al. Renal failure and cirrhosis: a systematic review of mortality and prognosis. J Hepatol 2012; 56: 810–188. [DOI] [PubMed] [Google Scholar]
- 9. Martin‐Llahi M, Guevara M, Torre A, Fagundes C, Restuccia T, Gilabert R, et al. Prognostic importance of the cause of renal failure in patients with cirrhosis. Gastroenterology 2011; 140: 488–496. [DOI] [PubMed] [Google Scholar]
- 10. Nadim MK, Genyk YS, Tokin C, Fieber J, Ananthapanyasut W, Ye W, et al. Impact of etiology of acute kidney injury on outcomes following liver transplantation: acute tubular necrosis versus hepatorenal syndrome. Liver Transpl 2012; 18: 539–548. [DOI] [PubMed] [Google Scholar]
- 11. Asrani SK, Kim WR, Heimbach JH, Rosen CB, Berndt MM, Wiesner RH, et al. Acute tubular necrosis is present in the majority of patients undergoing liver transplantation [abstract]. Hepatology 2011; 54: 159A. [Google Scholar]
- 12. Francoz C, Prie D, Abdelrazek W, Moreau R, Mandot A, Belghiti J, et al. Inaccuracies of creatinine and creatinine‐based equations in candidates for liver transplantation with low creatinine: impact on the Model for End‐Stage Liver Disease score. Liver Transpl 2010; 16: 1169–1177. [DOI] [PubMed] [Google Scholar]
- 13. Kamath PS, Wiesner RH, Malinchoc M, Kremers W, Therneau TM, Kosberg CL, et al. A model to predict survival in patients with end‐stage liver disease. Hepatology 2001; 33: 464–470. [DOI] [PubMed] [Google Scholar]
- 14. Leise MD, Kim WR, Kremers WK, Larson JJ, Benson JT, Therneau TM. A revised Model for End‐Stage Liver Disease optimizes prediction of mortality among patients awaiting liver transplantation. Gastroenterology 2011; 140: 1952–1960. [DOI] [PMC free article] [PubMed] [Google Scholar]
- 15. D'Amico G, Garcia‐Tsao G, Pagliaro L. Natural history and prognostic indicators of survival in cirrhosis: a systematic review of 118 studies. J Hepatol 2006; 44: 217–231. [DOI] [PubMed] [Google Scholar]
- 16. Kamath PS, Kim WR. The Model for End‐Stage Liver Disease (MELD). Hepatology 2007; 45: 797–805. [DOI] [PubMed] [Google Scholar]
- 17. Sharma P, Schaubel DE, Sima CS, Merion RM, Lok AS. Re‐weighting the Model for End‐Stage Liver Disease score components. Gastroenterology 2008; 135: 1575–1581. [DOI] [PubMed] [Google Scholar]