Watch a video presentation of this article
Watch the interview with the author
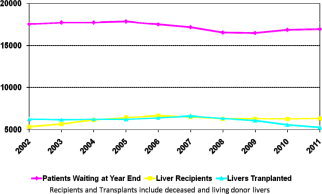
There is a critical mismatch in liver transplant supply and demand (Fig. 1). In order to manage this scarce resource, the transplant community in the United States has used the Model for End‐Stage Liver Disease (MELD) score as the backbone of its adult liver transplantation allocation and distribution system since February 2002. The MELD score was implemented in response to the Organ Procurement and Transplantation Network (OPTN) Final Rule, a Department of Health and Human Services mandate to de‐emphasize waiting time and focus on disease severity and waiting list mortality risk.1 The MELD score uses objective parameters to estimate the short‐term risk of death in patients who are on the transplant list. Compared with the previous system, which used the Child‐Turcotte‐Pugh score2 and patient location (i.e., outpatient, hospital floor, or intensive care unit) to prioritize liver allocation, the MELD‐based system was thought to be far more difficult to manipulate and less dependent upon waiting times for organ allocation. There was immediate evidence of a positive impact of the MELD score implementation, with fewer listings of low MELD patients and shorter waiting time on the liver transplant list in the first year of the post‐MELD era.3 Despite the listing of sicker patients, however, there was no reduction in posttransplantation patient or graft survival.4
Figure 1.

Discrepancy between candidates on the liver transplant waiting list and liver transplants.
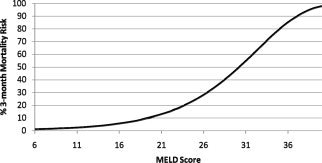
The MELD equation uses the international normalized ratio, creatinine, and total bilirubin to determine a score from 6 to 40 (capped by United Network for Organ Sharing) and predicts 3‐month mortality risk5 (Fig. 2):
where INR is the international normalized ratio.
Figure 2.

Three‐month waiting list mortality risk by MELD score.
The objectivity and ease of laboratory measurement of its variables make the MELD score an attractive organ allocation tool. After listing, every patient is placed on the list based upon their calculated or exception MELD score, which is periodically updated while awaiting transplantation. Patients whose calculated MELD score is not reflective of their risk of death or who drop out from the transplant list can be considered for exception points. Some disease states (hepatocellular carcinoma, hepatopulmonary syndrome, primary hyperoxaluria, familial amyloid polyneuropathy, cystic fibrosis with progressive pulmonary deterioration, portopulmonary syndrome, and cholangiocarcinoma receiving an approved chemoradiation protocol) can receive standardized MELD exception points provided they fit within predetermined criteria. Other considerations (e.g., hyponatremia and frequent cholangitis in primary sclerosing cholangitis) do not qualify for standard MELD exception points but are reviewed by each region's review board. The justifications for MELD exception points for many of these conditions were reviewed by a national concensus conference (MELD Exception Study Group and Conference, MESSAGE), which agreed on guidelines that are not used by all regions or all regional reviewers.6
Liver Transplantation Allocation and Distribution
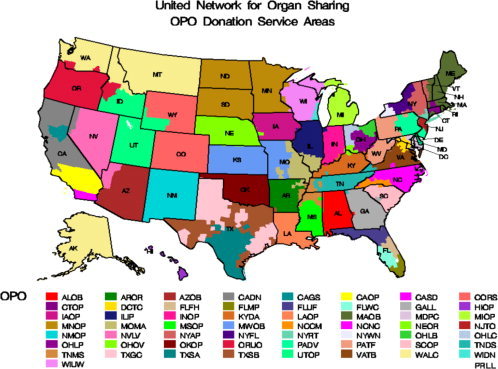
Prioritization on the transplant waiting list is ordered by increased risk of death as determined by the MELD score (either calculated or exception MELD score, whichever is highest) with the exception of status 1a patients (acute liver failure, primary graft dysfunction, or hepatic artery thrombosis within 1 week of transplantation) and status 1b patients (children with chronic liver disease and life‐threatening complications), who are prioritized first. For more information on the current allocation system, please see the Organ Procurement and Transplantation Network (OPTN) website (policy 3.6).7 The United States liver organ distribution is organized into 58 federally approved Donation Service Areas, each served by an Organ Procurement Organization (Fig. 3). With the exception of status 1A and 1B candidates, local candidates are prioritized over regional and national candidates.8 The priority MELD score cutoff for nonlocal candidates receiving an adult deceased donor liver offer preferentially over a local candidate is under continual revision to provide the most equitable sharing between regions that have inherently different demographics and degrees of illness. Currently, the “Share 15 Regional” policy establishes that cutoff at a MELD score of 15. If there are no local candidates above a MELD score of 15, the liver is offered regionally to candidates with scores of 15 or higher. The MELD score of 15 was chosen because of a seminal study showing that the balance between the risk of death on the transplant list versus risk of death with transplant surgery reverses around a MELD score of 15, with scores lower than 15 favoring staying on the transplant list and higher scores favoring accepting the risk of the surgery.9
Figure 3.

Organ Procurement Organization (OPO) donation service area map.
Despite its improvement over previous allocation systems, the MELD score's weaknesses are widely recognized and reported. All of the MELD variables are subject to one or more of the following biases: laboratory variation,10, 11inaccuracy due to surrogate measurement and differential effects between men and women,12 and lack of specificity to liver disease.13 These biases may cause changes in an individual patient's MELD score that are not reflective of the patient's liver disease and therefore inappropriately change that patient's MELD‐determined transplant priority. Despite these inherent weaknesses, the MELD score has created an evidence‐based gold standard to assess risk equivalency in end‐stage liver disease.
Recent Changes and Future Directions
Conversations within the transplant community are currently taking place to determine the next steps in MELD score, allocation, and distribution. The goal is to improve liver transplant equitability in the United States without sacrificing the objectivity and accessibility of the MELD score. The stated strategy involves small, incremental changes over time. In terms of allocation, the leading consideration is the MELDNa score—an equation similar to the MELD score that incorporates sodium and has shown better predictive ability than the MELD score, especially in low MELD scores.14, 15 A proposal to incorporate the MELDNa score into the United States allocation system was submitted for public comment in Spring 2013. Efforts to refit the MELD score variables with new coefficients in cohorts larger than those of the original MELD studies have resulted in higher predictive ability, both with and without sodium in the score,16, 17 but this is currently not under consideration for implementation.
There have also been several efforts to change the distribution system to reduce geographic disparities. Two of these efforts, Share 15 National and Share 35 Regional were implemented in June 2013. In Share 15 National, adult deceased donor livers are offered nationally to status 1 patients and patients with MELD 15 or higher before local/regional/national patients with MELD scores less than 15 (Table 1). In Share 35 Regional, regional patients with MELD scores above 35 receive offers before local patients below a MELD score of 35. At each MELD score of 35 to 40, local candidates retain priority over regional patients. The threshold of a MELD score of 35 was chosen because of modeling studies suggesting equivalent wait list outcomes of status 1 patients and patients with a MELD score above 35.18
Table 1.
United States Adult Deceased Donor Liver Distribution Policy
| Share 15 | Share 15 National | Share 15 National with Share 35 Regional |
|---|---|---|
| Local status 1A | Local status 1A | Local status 1A |
| Regional status 1A | Regional status 1A | Regional status 1A |
| Regional status 1B | Regional status 1B | Regional status 1B |
| Local MELD score ≥15 | Local MELD score ≥15 | Candidates with MELD/PELD scores ≥35 in descending order of MELD score, with local candidates ranked above regional candidates at each level of MELD score |
| Regional MELD score ≥15 | Regional MELD score ≥15 | Local MELD score ≥15 |
| Local MELD score <15 | National status 1A | Regional MELD score ≥15 |
| Regional MELD score <15 | National status 1B | National status 1A |
| National status 1A | National MELD score ≥15 | National status 1B |
| National status 1B | Local MELD score <15 | National MELD score ≥15 |
| National MELD | Regional MELD score <15 | Local MELD score <15 |
| National MELD score <15 | Regional MELD score <15 | |
| National MELD score <15 |
Offers for livers are prioritized from top to bottom and are only offered to a lower priority candidate if there are no accepting candidates in previous rows. Share 15 was the distribution strategy until recently. Share 15 National and Share 35 Regional were implemented in Spring 2013.
Conclusion
The MELD score drastically changed the liver transplant allocation system in the United States. It was a positive adjustment in the history of liver transplantation, though the system still has significant shortcomings in interregional equitability. Research and debate is ongoing in the liver transplant community regarding what changes to make in the future to improve equitable use of this scarce resource.
This work was funded in part by grants from the Agency for Healthcare Research and Quality (DK076565) and the National Institute of Diabetes and Digestive and Kidney Diseases (DK076565) for SWB and from the National Institutes of Health (5T32DK07038) for JPW.
Potential conflict of interest: Nothing to report.
References
- 1. U.S. Government Printing Office . Electronic code of federal regulations. http://www.ecfr.gov/cgi‐bin/text‐idx?c=ecfr&tpl=/ecfrbrowse/Title42/42cfr121_main_02.tpl. Accessed March 7, 2013.
- 2. Wiesner R, Edwards E, Freeman R, Harper A, Kim R, Kamath P, et al. Model for end‐stage liver disease (MELD) and allocation of donor livers. Gastroenterology 2003; 124: 91–96. [DOI] [PubMed] [Google Scholar]
- 3. Freeman RB, Wiesner RH, Edwards E, Harper A, Merion R, Wolfe R. Results of the first year of the new liver allocation plan. Liver Transpl 2004; 10: 7–15. [DOI] [PubMed] [Google Scholar]
- 4. Wiesner R, Lake JR, Freeman RB, Gish RG. Model for end‐stage liver disease (MELD) exception guidelines. Liver Transpl 2006; 12(12 suppl 3): S85–S87. [DOI] [PubMed] [Google Scholar]
- 5. Kamath PS, Wiesner RH, Malinchoc M, Kremers W, Therneau TM, Kosberg CL, et al. A model to predict survival in patients with end‐stage liver disease. Hepatology 2001; 33: 464–470. [DOI] [PubMed] [Google Scholar]
- 6. Freeman RB Jr, Gish RG, Harper A, Davis GL, Vierling J, Lieblein L, et al. Model for end‐stage liver disease (MELD) exception guidelines: results and recommendations from the MELD Exception Study Group and Conference (MESSAGE) for the approval of patients who need liver transplantation with diseases not considered by the standard MELD formula. Liver Transpl 2006; 12(12 suppl 3): S128–S136. [DOI] [PubMed] [Google Scholar]
- 7. HRSA/OPTN . Policy management: policies. http://optn.transplant.hrsa.gov/policiesAndBylaws/policies.asp. Accessed March 7, 2013.
- 8. Coombes JM, Trotter JF. Development of the allocation system for deceased donor liver transplantation. Clin Med Res 2005; 3: 87–92. [DOI] [PMC free article] [PubMed] [Google Scholar]
- 9. Merion RM, Schaubel DE, Dykstra DM, Freeman RB, Port FK, Wolfe RA. The survival benefit of liver transplantation. Am J Transpl 2005; 5: 307–313. [DOI] [PubMed] [Google Scholar]
- 10. Cholongitas E, Marelli L, Kerry A, Senzolo M, Goodier DW, Nair D, et al. Different methods of creatinine measurement significantly affect MELD scores. Liver Transpl 2007; 13523–529. [DOI] [PubMed] [Google Scholar]
- 11. Trotter JF, Olson J, Lefkowitz J, Smith AD, Arjal R, Kenison J. Changes in international normalized ratio (INR) and model for endstage liver disease (MELD) based on selection of clinical laboratory. Am J Transpl 2007; 7: 1624–1628. [DOI] [PubMed] [Google Scholar]
- 12. Cholongitas E, Marelli L, Kerry A, Goodier DW, Nair D, Thomas M, et al. Female liver transplant recipients with the same GFR as male recipients have lower MELD scores—a systematic bias. Am J Transpl 2007; 7: 685–692. [DOI] [PubMed] [Google Scholar]
- 13. Bambha KM, Biggins SW. Inequities of the Model for End‐Stage Liver Disease: an examination of current components and future additions. Curr Opin Organ Transpl 2008; 13: 227–233. [DOI] [PubMed] [Google Scholar]
- 14. Kim WR, Biggins SW, Kremers WK, Wiesner RH, Kamath PS, Benson JT, et al. Hyponatremia and mortality among patients on the liver‐transplant waiting list. New Engl J Med 2008; 359: 1018–1026. [DOI] [PMC free article] [PubMed] [Google Scholar]
- 15. Biggins SW, Kim WR, Terrault NA, Saab S, Balan V, Schiano T, et al. Evidence‐based incorporation of serum sodium concentration into MELD. Gastroenterology 2006; 130: 1652–1660. [DOI] [PubMed] [Google Scholar]
- 16. Sharma P, Schaubel DE, Sima CS, Merion RM, Lok AS. Re‐weighting the model for end‐stage liver disease score components. Gastroenterology 2008; 135: 1575–1581. [DOI] [PubMed] [Google Scholar]
- 17. Leise MD, Kim WR, Kremers WK, Larson JJ, Benson JT, Therneau TM. A revised model for end‐stage liver disease optimizes prediction of mortality among patients awaiting liver transplantation. Gastroenterology 2011; 140: 1952–1960. [DOI] [PMC free article] [PubMed] [Google Scholar]
- 18. Washburn K, Pomfret E, Roberts J. Liver allocation and distribution: possible next steps. Liver Transpl 2011; 17: 1005–1012. [DOI] [PubMed] [Google Scholar]


