

Watch a video presentation of this article
Watch the interview with the author
Abbreviations
- ADC
apparent diffusion coefficient
- DWI
diffusion‐weighted imaging
- MRI
magnetic resonance imaging
- RF
radiofrequency
Introduction
Over the past decade, magnetic resonance imaging (MRI) has emerged as a powerful clinical tool for liver imaging due to new pulse sequences and new liver‐specific contrast agents. However, the multitude of pulse sequences and contrast agents that have made liver MRI so successful have also made it increasingly complex. This article provides a brief overview of liver MRI pulse sequences and contrast agents for referring physicians.
Basics of MRI
Magnetic resonance imaging consists of three essential components: a main magnetic field, an excitation pulse using radiofrequency (RF) waves to generate signal, and reception of the generated signal. The main magnetic field (1.5 or 3 Tesla) is generated by superconducting coils in the MRI scanner in which the patient is placed. The MRI signal used for most clinical MRI originates from protons bound to water and fat molecules. Each proton acts as a weak magnetic dipole. Once the patient is placed in the MRI scanner, these dipoles line up along the main magnetic field (longitudinal magnetization). An oscillating RF wave is then used to generate an excitation pulse that aligns a proportion of the magnetization perpendicular to the direction of the main field, forming transverse magnetization. The transverse magnetization precesses around the main magnetic field, which generates the signals used for imaging.1 The excited protons then return (i.e., “relax”) to the equilibrium state along the main magnetic field.
The contrast between different tissues is determined by the rate at which the excited protons relax to the equilibrium state. Each tissue returns to its equilibrium state by independent processes of T1 (longitudinal) and T2 (transverse) relaxation. Image contrast can be weighted by the effects of these relaxation parameters, which heavily depend on the tissue type. T1‐weighted imaging generates contrast between tissues with different T1 relaxation times by altering the amount of longitudinal relaxation (Fig. 1A). Tissues with high protein content, blood products, or melanin have a short T1 and appear bright on T1‐weighted images. T2‐weighted imaging exploits differences in T2 relaxation to alter the amount of transverse magnetization. This creates contrast between tissues with different T2 values (Fig. 2A). Tissues with high water content such as fluid, tumors, edema, and infection appear bright on T2‐weighted imaging, whereas tissues with high iron content, such as hemorrhages containing hemosiderin, appear dark.
Figure 1.
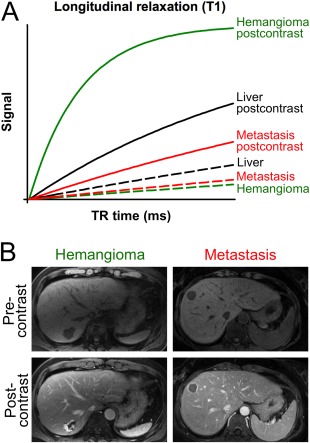
Contrast of typical liver lesions in T1‐weighted images before and after contrast injection. (A) Signal intensity curves of liver, hemangioma, and metastasis before (dotted line) and after (solid line) contrast injection. Note that both hemangioma and metastasis have signal intensities slightly lower than the liver parenchyma before contrast injection. After contrast injection, the signal intensity of the metastasis remains far below the liver (except for an enhancing rim), whereas the signal intensity of the hemangioma is far above the liver, allowing for facilitated distinction. (B) Image example of a hemangioma in a 68‐year‐old male and of a metastasis in a 35‐year‐old female. Note the characteristic peripheral nodular enhancement in the hemangioma and the typical rim enhancement with central hypointensity corresponding to central necrosis in the metastasis.
Figure 2.
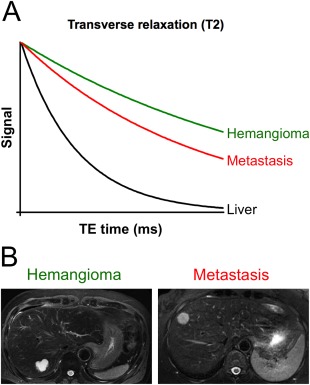
Contrast of typical liver lesions in T2‐weighted images. (A) Signal intensity curves of liver, hemangioma, and metastasis. (B) Image example of a hemangioma and metastasis in the same patients as in Figure 1B (68‐year‐old male and 35‐year‐old female). Note the characteristic very bright (“light bulb”) signal of the hemangioma, whereas the metastasis appears only slightly brighter than normal liver parenchyma.
Types of MR images
A comprehensive liver MRI protocol allows evaluation of the liver parenchyma, vasculature, and biliary system. This is established by a combination of different MR imaging sequences. Each sequence serves different purposes for visualization and characterization of normal tissues and/or pathological lesions. A basic MRI protocol includes a localizer, T2‐weighted single‐shot fast spin‐echo, T1‐weighted gradient‐echo in‐ and opposed‐phase, fat‐suppressed T2‐weighted fast spin‐echo, and diffusion‐weighted and multiphase dynamic postcontrast T1‐weighted gradient‐echo sequences.2, 3 The individual sequences are usually acquired during breath‐holds (∼20 seconds) or by using respiratory triggering techniques (∼2–3 minutes). The total MRI protocol time is typically 15 to 30 minutes for a contrast‐enhanced MRI of the liver. In the following section, we briefly outline the rationale for each imaging sequence.
The Basic Liver Imaging Protocol Without Contrast Agents
The localizer provides a rapid overview of the liver and is used to plan the actual diagnostic pulse sequences as well as check the position of the patient and the receive coil.
T2‐weighted single‐shot fast spin‐echo imaging provides motion‐insensitive high‐contrast anatomic images on which blood, bile ducts, and pancreatic ducts appear bright.3
T1‐weighted gradient‐echo imaging enables tissue characterization based on T1 relaxation times (Fig. 1A) and chemical shift imaging, often known as in‐ and opposed‐phase imaging. Fat protons and water protons precess at different frequencies. In tissues containing water and fat, at certain imaging time points (echo times) the magnetization of water and fat protons is aligned and adds up (in‐phase imaging = high signal), and at certain echo times the magnetization vectors of water and fat are 180° out of phase and cancel (opposed‐phase imaging = low signal). This phenomenon can be used to identify intracellular lipid in neoplasms such as adenomas or hepatocellular carcinomas and also to detect and quantify hepatic steatosis.
T2‐weighted imaging is performed for lesion detection and characterization. Many liver lesions have high signal intensities compared to the normal liver parenchyma, which facilitates detection. Moreover, benign lesions such as cysts and hemangiomas appear very bright (“light bulb”) compared to normal liver parenchyma, whereas solid hepatocellular or metastatic lesions only appear slightly brighter (Fig. 2B). The use of fat suppression is recommended to improve the conspicuity of subtle findings.3 Magnetic resonance cholangiopancreatography is simply a very heavily T2‐weighted sequence that suppresses all tissues except fluid in bile ducts, pancreatic ducts, and cystic structures.4
Diffusion‐weighted imaging (DWI) allows quantification of the ability of water molecules to diffuse freely in the extracellular space.5 The apparent diffusion coefficient (ADC) value can be calculated and provides a measure of proton diffusion in tissue. High ADC values, reflecting low restriction of diffusion (low cellular density), are more likely to represent benign lesions. Lesions with low ADC values, reflecting high restriction of diffusion (high cellular density), are more likely to be malignant.6 Currently, the main advantage of DWI is high sensitivity for even the detection of small lesions in the liver such as metastases.
Contrast‐Enhanced MRI
Magnetic resonance imaging contrast agents improve the detection and characterization of focal liver lesions when combined with T1‐weighted imaging.7 Most MRI contrast agents are gadolinium‐based, which shorten the T1‐relaxation time of water protons (Fig. 1A). During contrast‐enhanced liver MRI, a multiphase dynamic image study is performed by rapidly injecting the contrast agent at a rate of ∼2 milliliter/seconds.3 Multiple sequential breath‐hold T1‐weighted images are acquired, including precontrast images followed by a late arterial phase (timed using bolus detection methods), followed by a portal venous (∼70 seconds after injection) and a delayed phase (∼2–5 minutes). This approach exploits the dual blood supply to the liver and dramatically improves liver lesion detection and characterization. For example, enhancement during the arterial phase and the subsequent hypointense appearance compared during the portal venous or delayed phase (washout) is highly characteristic of hepatocellular carcinoma (Fig. 3).8 Focal nodular hyperplasia is also well enhanced during the arterial phase, but remains isointense or slightly hyperintense during subsequent phases.3 Hemangiomas demonstrate peripheral nodular enhancement that becomes successively more confluent, whereas metastases typically show rim enhancement with central hypointensity corresponding to central necrosis or fibrosis (Fig. 1B).2, 3
Figure 3.
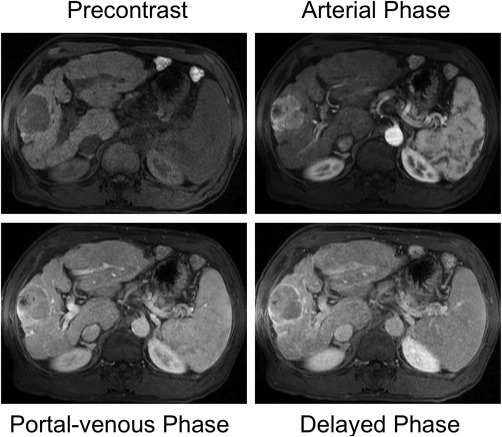
Dynamic contrast‐enhanced T1‐weighted imaging in a 73‐year‐old male with alcohol‐induced liver cirrhosis and hepatocellular carcinoma. The hepatocellular carcinoma shows typical enhancement during the arterial phase and subsequent washout during the portal venous phase and delayed phase.
Liver‐specific hepatobiliary contrast agents have recently been developed and offer a unique contrast behavior for liver imaging through the use of a delayed hepatobiliary phase.7, 9 These agents are taken up into hepatocytes through the organic anion biliary transport system, which leads to enhancement of normal liver parenchyma. Lesions of nonhepatocyte origin (benignant or malign) show no enhancement and thus are easily detected as dark lesions relative to the bright liver parenchyma.8 Two hepatobiliary contrast agents are currently available, gadoxetic acid (Eovist; Bayer Healthcare, Wayne, NJ) and gadobenate dimeglumine (Multihance; Bracco Diagnostics, Princeton, NJ). The hepatocyte uptake of gadoxetic acid is significantly greater than for gadobenate dimeglumine (∼ 50% versus 4%‐5%, respectively) and peaks earlier (∼20 minutes versus 1–2 hours, respectively).10
Safety of MRI
Magnetic resonance imaging is an extremely safe, noninvasive imaging technique that uses no ionizing radiation. However, clinicians should be aware of certain risks.11 The most obvious risk is created by the strong magnetic field, which is always on. Therefore, MRI scanning may not be safe for patients with certain types of metal implants or electronic devices such as cardiac pacemakers. MRI‐based contrast agents are also very safe and have a proven track record as well as a much higher safety profile than iodinated contrast agents used for computed tomography, with a lower rate of adverse events and no known nephrotoxicity. Contraindications of MRI and MR contrast agents are discussed in further detail at http://www.mrisafety.com or in the American College of Radiology white paper on MRI safety.11
Conclusion
Magnetic resonance imaging is a highly accurate and very safe imaging modality for evaluating the liver. An experienced radiologist with specific training in abdominal MRI is needed to determine the appropriate MRI sequences and type of contrast agent and to interpret the imaging features of liver lesions for a confident diagnosis of focal and diffuse liver disease.
Potential conflict of interest: Nothing to report.
References
- 1. Currie S, Hoggard N, Craven IJ, Hadjivassiliou M, Wilkinson ID. Understanding MRI: basic MR physics for physicians. Postgrad Med J 2013;89:209‐223. [DOI] [PubMed] [Google Scholar]
- 2. Fowler KJ, Brown JJ, Narra VR. Magnetic resonance imaging of focal liver lesions: approach to imaging diagnosis. Hepatology 2011;54:2227‐2237. [DOI] [PubMed] [Google Scholar]
- 3. Wile GE, Leyendecker JR. Magnetic resonance imaging of the liver: sequence optimization and artifacts. Magn Reson Imaging Clin N Am 2010;18:525‐547, xi. [DOI] [PubMed] [Google Scholar]
- 4. Yam BL, Siegelman ES. MR imaging of the biliary system. Radiol Clin North Am 2014;52:725‐755. [DOI] [PubMed] [Google Scholar]
- 5. Galea N, Cantisani V, Taouli B. Liver lesion detection and characterization: role of diffusion‐weighted imaging. J Magn Reson Imaging 2013;37:1260‐1276. [DOI] [PubMed] [Google Scholar]
- 6. Miller FH, Hammond N, Siddiqi AJ, Shroff S, Khatri G, Wang Y, Merrick LB, et al. Utility of diffusion‐weighted MRI in distinguishing benign and malignant hepatic lesions. J Magn Reson Imaging 2010;32:138‐147. [DOI] [PubMed] [Google Scholar]
- 7. Van Beers BE, Pastor CM, Hussain HK. Primovist, eovist: what to expect? J Hepatol 2012;57:421‐429. [DOI] [PubMed] [Google Scholar]
- 8. Zech CJ, Bartolozzi C, Bioulac‐Sage P, Chow PK, Forner A, Grazioli L, Huppertz A, et al. Consensus report of the Fifth International Forum for Liver MRI. AJR Am J Roentgenol 2013;201:97‐107. [DOI] [PubMed] [Google Scholar]
- 9. Frydrychowicz A, Lubner MG, Brown JJ, Merkle EM, Nagle SK, Rofsky NM, Reeder SB. Hepatobiliary MR imaging with gadolinium‐based contrast agents. J Magn Reson Imaging 2012;35:492‐511. [DOI] [PMC free article] [PubMed] [Google Scholar]
- 10. Seale MK, Catalano OA, Saini S, Hahn PF, Sahani DV. Hepatobiliary‐specific MR contrast agents: role in imaging the liver and biliary tree. Radiographics 2009;29:1725‐1748. [DOI] [PubMed] [Google Scholar]
- 11. Expert Panel on MR Safety , Kanal E, Barkovich AJ, Bell C, Borgstede JP, Bradley WG Jr, Froelich JW, et al. ACR guidance document on MR safe practices: 2013. J Magn Reson Imaging 2013;37:501‐530. [DOI] [PubMed] [Google Scholar]