Watch a video presentation of this article
Watch the interview with the author
Abbreviations
- 3D
three‐dimensional
- FDA
US Food and Drug Administration
- HVPG
hepatic venous pressure gradient
- MRI
magnetic resonance imaging
- NAFLD
nonalcoholic fatty liver disease.
Introduction
Magnetic resonance imaging (MRI) is an established, noninvasive imaging method that uses no ionizing radiation. It is used in all regions of the body and is widely regarded as the best noninvasive imaging method to assess focal liver lesions. In addition, MR imaging has a well‐established role for the qualitative assessment of many features of diffuse liver disease, including hepatic steatosis, iron overload, end‐stage fibrosis, and hemodynamics.
In recent years, several important technical developments have led to emerging quantitative MRI methods for the diagnosis and treatment monitoring of diffuse liver disease. In this article, we describe the current state‐of‐the‐art techniques as well as the remaining challenges for the quantitative imaging of hepatic steatosis, iron overload, and fibrosis, as well as changes of hepatic blood flow. For a general introduction into magnetic resonance imaging, we direct you to our review entitled “Primer on Magnetic Resonance Imaging of the Liver” which was published in volume 4, issue 5 of CLD. link: http://onlinelibrary.wiley.com/enhanced/doi/10.1002/cld.440
Liver Fat Quantification
Nonalcoholic fatty liver disease (NAFLD) is the most common cause of chronic liver disease. In some cases, isolated steatosis can progress to inflammation and fibrosis (i.e., nonalcoholic steatohepatitis), cirrhosis, portal hypertension, and even hepatocellular carcinoma.
Biopsy is the current gold standard for the quantitative assessment of hepatic steatosis, the hallmark histological feature of NAFLD; however, it is invasive; expensive; and perhaps most important, suffers from sampling variability. For these reasons, there is a growing and unmet need for a noninvasive, quantitative assessment of steatosis.
MRI is highly sensitive to signal differences between water and fat. Extensive recent technical development has led to methods that quantify fat accurately and noninvasively.1 MRI has been proven to be more accurate for quantifying fat than other radiologic techniques, such as ultrasound and computed tomography (CT). Further, MRI can assess fat over the entire volume of the liver, which is advantageous because steatosis commonly has a heterogeneous distribution. Whole‐liver fat quantification can be performed within a single, 20‐second breath‐hold. Results of the steatosis measurement can be color‐coded and visualized as fat‐fraction maps (Fig. 1). Quantitative MRI has been shown to be a viable adjunct to biopsy for the accurate quantification of small changes in liver fat in longitudinal interventional studies.2 Further studies are needed to evaluate the prognostic value of MR‐based measurements of steatosis.
Figure 1.

Quantification of liver fat accumulation using fat‐fraction MR imaging. Fat‐fraction maps in (A) a healthy subject (steatosis grade 0) and patients with biopsy confirmed (B) steatosis grade 1, (C) steatosis grade 2, and (D) steatosis grade 3. Measurements displayed adjacent to circular regions of interest indicate the estimated fat fractions (%). The results of these noninvasive measurements correlate well with the steatosis degree as determined by biopsy.
Liver Iron Quantification
Hepatic iron overload is the histological hallmark of hereditary hemochromatosis and transfusional hemosiderosis and also can occur in chronic hepatopathies. Iron overload can result in liver damage, with the eventual development of fibrosis, cirrhosis, liver failure, and hepatocellular carcinoma. Magnetic resonance imaging is extremely sensitive to the presence of iron in tissue. Iron affects the decay rate of the MR signal, which can be quantified by measuring relaxation parameters (MR relaxometry). These relaxation parameters, particularly R2 and R2*, enable the assessment of liver iron levels and have been calibrated and validated in biopsy correlation studies. These techniques provide a metric of liver iron concentration, typically in units of mg Fe/g dry tissue. Of these techniques, FerriScan (Resonance Health, Claremont, Australia) is a R2‐based method that is US Food and Drug Administration (FDA)‐approved and commercially available. The main disadvantages of this approach are limited liver coverage, a long scan time (10–20 minutes), and a per‐click fee.3 R2* relaxometry methods are particularly promising due to the higher sensitivity to low levels of tissue iron and speed: whole‐liver coverage can be obtained in a single 20‐second breath‐hold.4 R2* relaxometry maps can be displayed as color‐coded images (Fig. 2). The remaining challenge for the widespread application of R2*‐based liver‐iron quantification is validation of reproducibility in large‐scale multicenter studies.
Figure 2.

Quantification of liver‐iron overload using MR relaxometry. R2* maps in a (A) healthy subject (1 mg Fe/g dry tissue), (B) a patient with intermediate (10 mg Fe/g dry tissue), and (C) high (16 mg Fe/g dry tissue) iron overload. Measurements overlaid on the R2* maps indicate the estimated R2* values (s−1) in the circular regions of interest. The results of these noninvasive measurements correlate well with histologic iron grades.
Liver Fibrosis Quantification
Chronic diffuse liver disease, including NAFLD, alcoholic liver disease, iron overload, viral hepatitis, autoimmune hepatopathies, and other causes of hepatocyte injury can progress to liver fibrosis, cirrhosis, and the eventual development of hepatocellular carcinoma. Accurate assessment of fibrosis is essential for the management of these patients, not only for prognosis but also for therapeutic algorithms—particularly for viral hepatitis and NAFLD/nonalcoholic steatohepatitis.
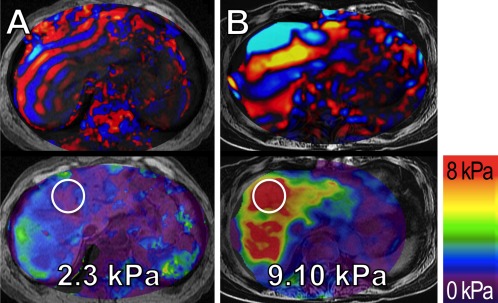
Liver biopsy is widely used to stage the extent of fibrosis, but its utility for longitudinal monitoring of fibrosis is limited because of the subjective reading with high interobserver variance.5 Emerging MR elastography methods are based on the use of motion‐encoding gradients that impart phase information into the underlying MR images. A transducer placed on the patients' upper abdominal wall during the MR scan generates shear waves, typically vibrating at 60 to 90Hz. Through the acquisition of multiple images acquired during the mechanical vibration, the propagation of shear waves can be visualized in the liver. Complete liver coverage within a few breath‐holds can provide color‐coded shear stiffness maps used to quantify tissue stiffness (Fig. 3).
Figure 3.

Quantification of hepatic fibrosis using MR elastography in two patients with known hepatitis C. Snap shots of wave propagation (upper panels) and liver stiffness maps (lower panels) in (A) a 66‐year‐old male without histological signs of fibrosis (grade F0) and (B) a 70‐year‐old female with severe liver cirrhosis (grade F4) as confirmed by biopsy. Note the longer wavelength of the shear waves in the patient with liver cirrhosis as compared to the shorter wavelength in the patient without cirrhosis.
Measurements overlaid on the liver stiffness maps indicate the shear stiffness (kPa) measured from the circular regions of interest in these MR elastograms.
Emerging MR‐based elastography methods are now FDA‐approved and available from several MRI manufacturers. The accuracy of MR elastography for staging liver fibrosis using the METAVIR system yields generally greater than 0.95 of area under a receiver‐operating characteristics curve6 as compared to 0.85 to 0.93 by ultrasound‐based methods.7 A further disadvantage of ultrasound‐based methods is that they do not provide spatial localization of stiffness measurements and sample a relatively small region of the liver. This leads to a potential sampling variability that is similar to biopsy. However, multicenter validation studies are still needed to develop a uniform strategy for noninvasive liver fibrosis staging with MR elastography.
Liver Blood Flow Quantification
Portal hypertension is an end‐stage complication of cirrhosis that dramatically alters the hemodynamics of the liver. Complex alterations in the hemodynamics of the hepatic and the mesenteric circulation are the principal characteristics of this disease, often with complications of portosystemic venous collaterals, splenomegaly, and portal vein thrombosis. Characterization of the hepatic venous pressure gradient (HVPG) through transjugular hepatic wedge pressure measurements is the widely used and best‐validated biomarker for quantifying the severity of portal hypertension. Unfortunately, wedge pressure measurements are invasive and operator‐dependent. In addition, HVPG provides global characterization of portal hypertension with no information on nature and distribution of flow alterations through collaterals. Therefore, a comprehensive, noninvasive diagnostic approach that allows for hemodynamic assessment of the mesenteric and portal circulation in a single examination would be highly desirable.
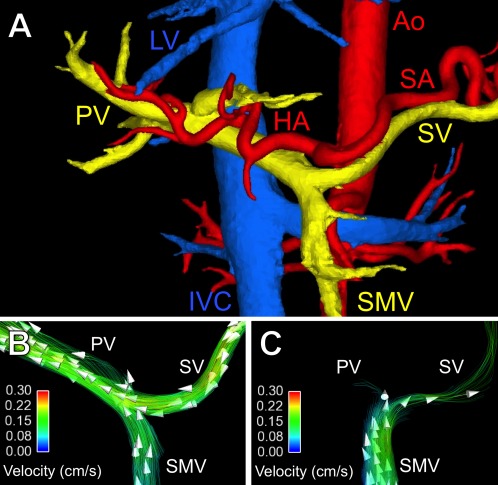
Emerging time‐resolved 3D MRI velocity mapping (4D flow MRI) methods have shown great promise as a comprehensive tool for anatomic and hemodynamic assessment of portal hypertension.8 A single, 10‐minute, free‐breathing 4D‐flow MRI scan provides comprehensive characterization of complex mesenteric and portal blood flow.9 In addition to anatomical visualization, streamline and particle‐trace visualization techniques can be used to represent quantitative blood flow (Fig. 4). Also, cut planes across vessels can be used to measure flow within any vessel contained in the acquisition volume. Further studies are needed to validate the full clinical utility of 4D‐flow MRI techniques in portal hypertension, including their use in monitoring changes in hepatic blood flow after therapeutic intervention such as beta‐blockage, transjugular intrahepatic portosystemic shunt, and portal vein embolization.
Figure 4.

Anatomical visualization and quantification of hepatic blood flow using 4D‐flow MR imaging. (A) Segmentation of phase contrast angiograms in a healthy adult. Arterial vessels are indicated in red, venous vessels in blue, and the portal vasculature in yellow. Hemodynamics of the portal blood flow in (B) the same healthy adult and (C) a patient with portal hypertension due to liver cirrhosis. Streamline colors illustrate the flow velocity and arrowheads the flow direction. Note the hepatopetal flow in the splenic vein (SV), superior mesenteric vein (SMV), and portal vein (PV) in the healthy adult. In the patient with liver cirrhosis and portal hypertension, there is only minimal flow in the PV and hepatofugal flow in the splenic vein. Ao = aorta, HA = hepatic artery, SA = splenic artery, IVC = inferior vena cava, LV = liver veins.
Conclusion
Emerging quantitative MRI biomarkers of hepatic steatosis, iron overload, fibrosis, and hemodynamics show tremendous promise for noninvasive quantitative assessment of important features of diffuse liver disease. All of these biomarkers methods are relatively new and at various stages of clinical availability. Some of these biomarkers are FDA‐approved and widely available (fat‐ and R2‐based iron quantification) and others (R2*‐based iron quantification) are gaining wider acceptance. Some methods (4D flow MRI) are currently available only at dedicated academic centers. Further clinical experience and research will be needed to determine both their individual and combined utility in the diagnosis and management of diffuse liver disease.
Potential conflict of interest: Nothing to report.
References
- 1. Reeder SB, Cruite I, Hamilton G, Sirlin CB. Quantitative assessment of liver fat with magnetic resonance imaging and spectroscopy. J Magn Reson Imaging 2011;34:spcone. [DOI] [PMC free article] [PubMed] [Google Scholar]
- 2. Noureddin M, Lam J, Peterson MR, et al. Utility of magnetic resonance imaging versus histology for quantifying changes in liver fat in nonalcoholic fatty liver disease trials. Hepatology 2013;58:1930‐1940. [DOI] [PMC free article] [PubMed] [Google Scholar]
- 3. St Pierre TG, Clark PR, Chua‐anusorn W, et al. Noninvasive measurement and imaging of liver iron concentrations using proton magnetic resonance. Blood 2005;105:855‐861. [DOI] [PubMed] [Google Scholar]
- 4. Wood JC, Enriquez C, Ghugre N, et al. MRI R2 and R2* mapping accurately estimates hepatic iron concentration in transfusion‐dependent thalassemia and sickle cell disease patients. Blood 2005;106:1460‐1465. [DOI] [PMC free article] [PubMed] [Google Scholar]
- 5. Bedossa P, Burt AD, Gouw AS, et al. Utility and appropriateness of the FLIP algorithm and SAF score in the evaluation of biopsies of nonalcoholic fatty liver disease. Hepatology 2014;60:565‐575. doi: 10.1002/hep.27173. [DOI] [PubMed] [Google Scholar]
- 6. Wang QB, Zhu H, Liu HL, Zhang B. Performance of magnetic resonance elastography and diffusion‐weighted imaging for the staging of hepatic fibrosis: a meta‐analysis. Hepatology 2012;56:239‐247. [DOI] [PubMed] [Google Scholar]
- 7. Chon YE, Choi EH, Song KJ, et al. Performance of transient elastography for the staging of liver fibrosis in patients with chronic hepatitis B: a meta‐analysis. PLoS One 2012;7:e44930. [DOI] [PMC free article] [PubMed] [Google Scholar]
- 8. Stankovic Z, Csatari Z, Deibert P, et al. Normal and altered three‐dimensional portal venous hemodynamics in patients with liver cirrhosis. Radiology 2012;262:862‐873. [DOI] [PubMed] [Google Scholar]
- 9. Roldan‐Alzate A, Frydrychowicz A, Niespodzany E, Landgraf BR, Johnson KM, Wieben O, Reeder SB. In vivo validation of 4D flow MRI for assessing the hemodynamics of portal hypertension. J Magn Reson Imaging 2013;37:1100‐1108. [DOI] [PMC free article] [PubMed] [Google Scholar]


