Abstract
Perivascular spaces (PVS) in the human brain are related to various brain diseases. However, it is difficult to quantify them due to their thin and blurry appearance. In this paper, we introduce a deep-learning-based method, which can enhance a magnetic resonance (MR) image to better visualize the PVS. To accurately predict the enhanced image, we propose a very deep 3D convolutional neural network that contains densely connected networks with skip connections. The proposed networks can utilize rich contextual information derived from low-level to high-level features and effectively alleviate the gradient vanishing problem caused by the deep layers. The proposed method is evaluated on 17 7T MR images by a twofold cross-validation. The experiments show that our proposed network is much more effective to enhance the PVS than the previous PVS enhancement methods.
Keywords: Perivascular spaces, MRI enhancement, deep convolutional neural network, densely connected network, skip connections
1. INTRODUCTION
Perivascular spaces (PVS) are thin fluid-filled spaces surround arteries and veins in the human brain. The PVS regulate fluid motion and drainage in the central nervous system. The correlation between the PVS, aging and brain diseases has been studied since the 19th century and there have been reports indicating that the increase of PVS number or PVS thickness is associated with various brain diseases [1]. For example, the enlarged PVS is known to be associated with lacunar stroke subtype and white matter hyperintensities that cause small vessel diseases [2], [3]. Also, in patients with multiple sclerosis, a greater number of PVS are identified in magnetic resonance (MR) images than in controls [4], [5], and also thickening of these PVS is associated with cognitive decline [6]. Furthermore, a greater number of PVS are often found in patients with Alzheimer’s disease or mild cognitive impairment than in healthy subjects [7], [8]. Accordingly, several studies have been conducted to use the PVS as a biomarker of neurovascular, neurodegenerative diseases [9] and inflammatory activity [10] by quantifying the relationship between the thickness, length, distribution of PVS and each of specific diseases.
However, manual labeling of PVS for quantitative analysis is very time consuming since the PVS are small and thin tubular structures and are distributed throughout the whole white matter region. Furthermore, the PVS are not often clearly visible in MR images acquired by traditional 1.5T, 3T or even by 7T MR scanners. Thus, most of the studies did not extract all the PVS, but instead classified the severity into a few levels or counted the number of PVS in representative 2D slices [9], [10]. Recently, Bouvy et al. [11] and Zong et al. [12] proposed novel acquisition parameters of 7T MR scanner to make the PVS more visible, but it is still difficult to find the parameters that can improve only the PVS while reducing the noise in the background.
Accordingly, instead of carefully searching for certain specific parameters of MR scanner, several studies have been proposed to enhance the PVS by using image processing methods after MR images are acquired. For example, Uchiyama et al. [13] used the white top hat transform to highlight tubular structures and proved that this enhancement is effective to detect the PVS. Hou et al. [14] proposed a method that can improve the intensity of thin tubular structures using a nonlinear mapping function in Haar domain, and then removes noise in background by using block matching filtering. Although these methods can help extract the PVS by enhancing the intensity of PVS, heuristic parameter tuning such as determining the filter type, size, or thresholds in nonlinear mapping functions was required depending on the target image.
To address these limitations, in this paper, we propose a deep learning based PVS enhancement method that does not require heuristic parameter tuning and additional processing steps for denoising. Specifically, we propose a very deep 3D convolutional neural network consisting of densely connected dense blocks [15] with skip connections. The proposed deep network effectively enhances the PVS while suppressing other noise signals by utilizing rich contextual information derived from low-level to high-level features. Moreover, the dense skip connections help alleviate the gradient vanishing problem. The proposed network was evaluated on seventeen 7T MR images. Experimental results show that the proposed deep network is more effective to enhance the PVS than the prior PVS enhancement and other deep learning based methods.
A. RELATED WORKS
Various image enhancement methods such as gamma correction [16], vesselness filtering [17], morphological processing [13] and nonlocal block matching [14] have been used to facilitate the detection of PVS. However, these methods needed to heuristically find suitable parameters with respect to the target images, and thus often achieved unsatisfactory generated images.
Recently, deep learning based methods have achieved state-of-the-art performance in image enhancement problems. For example, in super-resolution problem, Dong et al. [18] first proposed a method using three convolution layers and achieved improved prediction results compared to the sparse coding based methods [19] and regression based methods [20]. Subsequently, several studies using deeper networks have been proposed to utilize higher level contextual features [21]–[24]. In particular, Kim et al. proposed a deep network consisting of 20 layers with gradient clipping [21] and a recursive neural network to reflect large contextual information without additional weight parameters [21]. Ledig et al. [22] used a ResNet structure with generalized adversarial network (GAN) and Lim et al. [23] further employed the residual scaling method to train a large model. Tong et al. [24] proposed a network using densely connected blocks with skip connections to reflect various levels of features.
Accordingly, deep learning methods have also been applied to improve the quality of medical images. For example, Pham et al. [25] applied a 3D SRCNN for the brain MR image super-resolution. Zhao et al. [26] and Shi et al. [27] used deeper networks to improve the prediction performance. Chen et al. [28] proposed a densely connected block, inspired by densely connected convolutional network [15]. Nie et al. [29] proposed a generative adversarial network for image synthesis such as predicting 7T MRimages from 3T MRimages and CT images from MR images. Wolterink et al. [30] and Olut et al. [31] also applied the generative adversarial network to synthesize unpaired MR, CT and MRA images from multi-contrast MR images, respectively.
B. CONTRIBUTIONS
We first propose a deep neural network to enhance MR image to better visualize the PVS. Compared to the previous PVS enhancement methods, our proposed method does not require heuristic parameter tuning and post-processing steps [13], [14], [16], [17]. Compared to the prior deep learning based methods applied for medical applications such as super-resolution and image synthesis, we design a much deeper 3D network (including six dense blocks with 39 convolutional layers) to utilize the rich contextual information. Thus, non-linear mapping such as intensity amplification on the PVS and noise reduction in the whole white matter region can be effectively considered.
A preliminary version of this work has been presented at a conference [32]. Herein, we (i) generate appropriate enhanced MR images through manual modification and use them as the ground truth instead of using the outputs of existing PVS enhancement method [14], (ii) include additional comparisons with previous PVS enhancement methods as well as additional deep learning networks, (iii) include comparison of prediction accuracy near PVS for thorough verification, (iv) discuss the effect of network depth on performance, and finally (v) include further related works and discussions that are not described in the conference publication.
II. METHOD
We introduce a deep learning based method which generates an enhanced 7T MR image from a 7T MR image. Learning a deep network that maps the whole 3D MR image is infeasible due to memory limitations. Moreover, since most PVS are in the white matter region, it is inefficient to learn a model for prediction of the whole MR image. Thus, we first extract the white matter region by using a brain segmentation tool [33] and sample 3D patches that contain a part of white matter from the common 7T MR images and the enhanced 7T MR images. Then, we train the deep 3D convolutional neural network to learn the relationship between the patches. The proposed network consists of an initial convolution layer for training low-level features, six dense blocks for training middle-level to high-level features, a bottleneck layer for extracting a small number of informative features from the low to high-level feature maps, and a prediction layer for generating the enhanced 3D image patch. Fig. 1 shows the proposed network, with the detailed descriptions provided in subsections. In testing, we similarly extract white matter using [33], sample the 3D patches with white matter, and then estimate the enhanced image patches by performing the prediction and merging them. Except the white matter region, the intensity values in the target MR image are copied to the predicted image.
FIGURE 1.
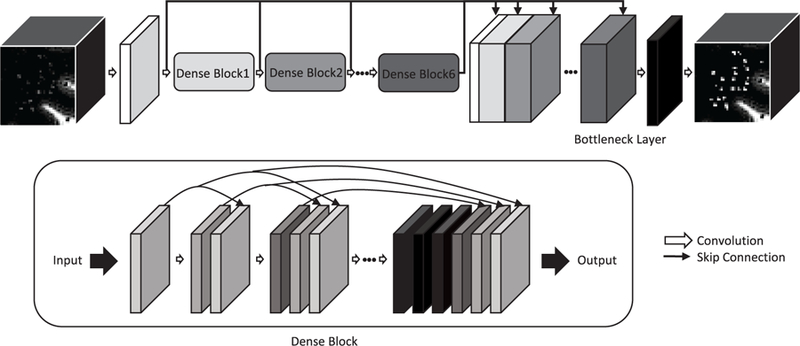
The proposed densely connected deep convolutional neural network for PVS enhancement.
A. DENSELY CONNECTED DEEP NEURAL NETWORK
The proposed network learns the relationship between the patches X sampled from 7T MR images and the patches Y sampled from the corresponding enhanced 7T MR images. The relevance is parameterized by weights w= [w1, ..., wn] and biases b= [b1, ..., bn] between layers where n is the number of convolution layers, and the enhanced patches P(X, w, b) are estimated by these parameters. In training, the parameters w and b are updated by an optimizer to minimize the mean squared loss L between P(X, w, b) and Y ,
| (1) |
In the forward propagation, the input patches are passed through an initial convolution layer with six dense blocks, where each dense block consists of 6 convolution layers, a bottle layer, and a prediction layer (i.e., n 39). In each convolution layer, 8 kernels with a size 3 × 3 × 3 are used with a rectified linear unit (ReLU) as the activation function, formally:
| (2) |
where Fi is the feature maps in the ith layer and F0 is X .
In each dense block, as proposed by Huang et al. [15], the feature maps generated in previous layers are concatenated to generate new feature maps as
| (3) |
where id is the index of initial layer of the dense block, and ⊕ represents concatenation. The new feature maps are also concatenated to the previous feature maps and later used in the next convolution layer. Thus, the number of feature maps is linearly increased by the number of kernels used, i.e., each dense block generates 48 feature maps as we use 6 convolution layers with 8 kernels in each dense block. The concatenation of the feature maps not only reduces the number of parameters but also alleviates the vanishing gradient problem. Finally, the 8 feature maps generated from the last layer in each dense block are used as the input of the next dense block.
After passing through all dense blocks, prediction can be performed by using the feature maps from the last dense block. However, in this way, the low-level and middle-level feature maps extracted by the initial layer and the initial dense blocks are rarely reflected in the prediction. Thus, to use all levels of information in the prediction, we use skip connections between the following layers, the initial convolution layer and six dense blocks. Specifically, 296 feature maps obtained from the initial convolution layer (8 feature maps) and all dense blocks (288 = 48 × 6 feature maps) are concatenated in the following layer.
Predicting a single channel output from many feature maps at once (i.e., 296 to 1) is computationally inefficient and hard to reflect all features for prediction. Therefore, a 1 × 1 × 1 convolution layer with 16 kernels is utilized as the bottleneck layer between the last dense block and the prediction layer to reduce the number of feature maps. Finally, the 16 feature maps generated from the bottleneck layer are passed through the prediction layer to predict the final output (i.e., 296 to 16, and then 16 to 1). Through the bottleneck layer, the prediction can be more accurate and efficient since this layer extracts a small number of informative features from the low-level to high-level feature maps for the final prediction.
B. IMPLEMENTATION DETAILS
For training, we sampled 2000 patches in each training image. The patch size was determined as 60 × 60 × 60 by considering the receptive field of our network. Regarding the proposed network, the weights w were initialized by the method proposed in He et al. [36] and the biases b were initialized to 0. The mini batch size was set as 5. The Adam optimizer [37] was used to minimize the mean squared error between P(X, w, b) and Y . The learning rate was initially set as 0.0001 and then decreased by 2 × 10⁻⁷ for each epoch, with 70 epochs in total. The method was implemented using Tensorflow and all training and testing were performed on a workstation with a NVIDIA Titan XP GPU.
III. EXPERIMENTS AND RESULTS
A. DATA SET
We acquired 17 images from healthy volunteers aged between 25 and 37 years with a 7T MR scanner. Informed consents were obtained from volunteers and the study was reviewed and approved by the institutional review board of University of North Carolina at Chapel Hill. T2-weighted MR images were used for the experiments due to its high contrast between the PVS and white matter. The detailed parameters for image acquisition were specified in [12].
An ideal way to make the ground truth is to create the enhanced images through sequence design or scanning protocols, but there have been few protocols known to improve the PVS signal while eliminating white matter noise. In addition, due to the intensity inhomogeneity of MRI caused by magnetic field inhomogeneity and nonlinearity of signal amplifiers, it was difficult to acquire the enhanced image that only contains the enhanced PVS and the rest of white matter regions composed of voxels with a similar intensity range. Thus, we generated the ground truth via image processing methods and then manually corrected erroneous regions. Specifically, we extracted white matter by using a brain tissue segmentation method [33], thereafter applying the non-local Haar transform method (NonLocal) [14] to generate a sharp image including the enhanced PVS. Furthermore, a block matching filtering method (BM4D) [34] is employed to generate a denoised image. Consequently, we generated the enhanced image by using the intensity of the sharp image if the voxel in the sharp image had a higher intensity than a certain threshold, and otherwise using the intensity of the denoised image. The threshold was manually chosen for each image since the degree of enhancement by [14] was different in each image. Except for the white matter, we copied the intensities of the original image to the enhanced image.
Even though the threshold was manually defined, some non-PVS regions can be considered as PVS, and thus enhanced by taking the intensity values of the sharp image. On the contrary, PVS regions can be smoothed by taking the intensity values of the denoised image. Thus, we manually corrected both missing PVS and incorrectly high-lighted regions in the enhanced image. Specifically, two raters checked each original image and its corresponding enhanced image using ITK-SNAP [38], which is a tool that can show synchronized views and receive user annotations. Two raters annotated the missing PVS and incorrectly high-lighted regions with different indices, and then took the intensity values of the sharp image on the missing PVS and took the intensity values of the denoised image on the incorrectly highlighted regions. In case of inconsistency between the two raters, the final decision was made after discussion. Fig. 2 shows the outputs of BM4D and NonLocal methods, the enhanced image we generated, and the prediction result by the proposed method.
FIGURE 2.
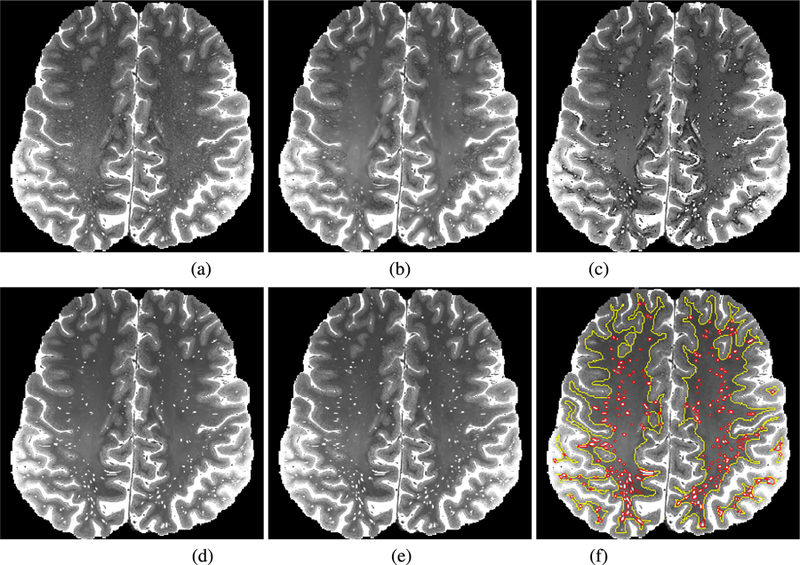
Visual comparison between original image, the enhanced image (we manually made), and the predicted image. (a) Original image, (b) output of BM4D [34], (c) output of NonLocal [14], (d) enhanced image, (e) output of the proposed method, (f) output of the proposed method with the regions surrounding PVS (red line) and white matter (yellow line).
B. EVALUATION SETTINGS
Since the amount of data used for this experiment was relatively small (i.e., 17), we divided the data into two sets, and then performed two-fold cross validation. Specically, we used the first set of 9 images as training and the second set consisting 8 images as testing in the first fold, and then reversely used the second set as training and the first set as testing in the second fold. The prediction accuracy was measured by Peak Signal-to-Noise Ratio (PSNR) and Structural SIMilarity (SSIM) between the predicted images and the enhanced images. The PSNR and SSIM were measured near the PVS marked as red lines in Fig. 2(f), as well as in the white matter marked as yellow lines in Fig. 2(f), to demonstrate that the noise in white matter was well removed and the intensities near the PVS were well improved. To extract the regions surrounding PVS represented by red lines, we extracted the regions with high intensity values in the enhanced image by thresholding, and then dilated them by using a 5 × 5 × 5 structuring element. The white matter represented by yellow lines was extracted using a brain tissue segmentation method [33].
To demonstrate the superiority of the proposed densely connected dense network (DCDenseNet), we compared our method with BM4D [34] and NonLocal [14] methods. More-over, we compared our method with previous deep learning based methods such as SRCNN [18] using three convolution layers with the kernel sizes 9, 5, and 5, VDSR [35] using 20 convolution layers with 32 kernels, and DenseNet [28] using one dense block for prediction. For fair comparison, we modified the 2D networks of SRCNN and VDSR to respective 3D networks in our experiments. The number of parameters are 52; 704 in SRCNN, 499; 392 in VDSR, 29; 192 in DenseNet, and 171; 272 in DCDenseNet, respectively. For both folds, the results of all the methods showed that the increase in accuracy was reduced after 30 epochs, and the accuracy scores were gradually saturated without prominent over-fitting as shown in Fig. 7. Thus, we compared the results in 70th epoch with sufficient saturation for all the methods.
FIGURE 7.
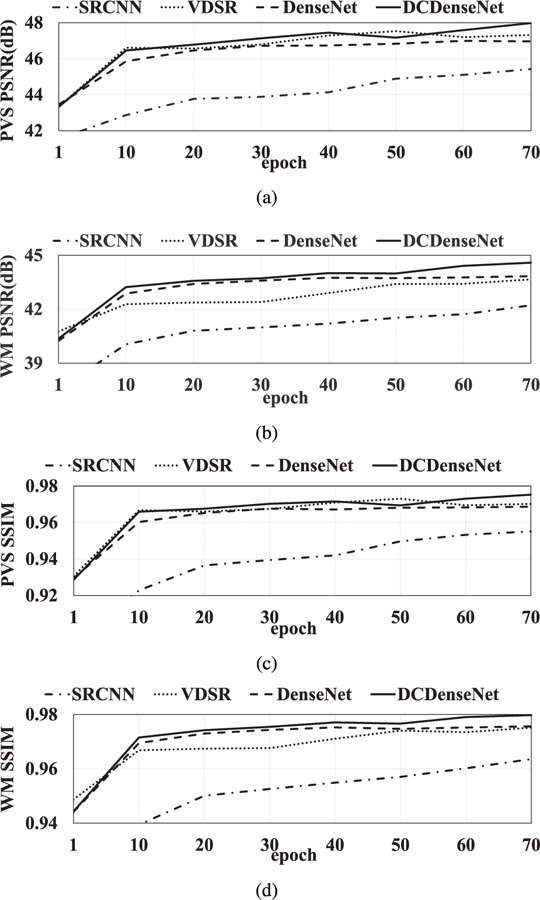
Change of prediction accuracy with respect to the training iteration in each comparison method.
C. QUANTITATIVE RESULTS
Table 1 shows the mean PSNR and SSIM measured from the results obtained by the proposed method and the comparison methods. The BM4D fairly reduces noise in the white matter region; however, the PVS are also blurred and thus the accuracy is low near the PVS. On the other hand, Non-Local method achieved better results than the BM4D near the PVS, though the noise in white matter did not disappear effectively. Furthermore, results obtained by SRCNN [18] were mostly better than the conventional PVS enhancement methods [14], [34]. However, both the PSNR and SSIM were lower than other deep learning based methods since the small number of hidden layers could not produce useful high-level features for prediction. The VDSR achieved improved performance compared to SRCNN by utilizing high-level features through the deep neural network. The performance of DenseNet [28] was comparable to VDSR even though the number of parameters of DenseNet was 17 times smaller than that of VDSR. It shows that using the low-level feature maps together with the high-level feature maps is informative to improve the prediction accuracy. The proposed DCDenseNet further improved the performance by using much deeper dense block layers with skip connections by considering feature maps of all levels.
TABLE 1.
Mean and standard deviation of PSNR (dB) and SSIM scores between the predicted images and the ground-truth for the comparison methods. The scores were measured near the PVS and the white matter (WM), respectively.
| PSNR-PVS | PSNR-WM | SSIM-PVS | SSIM-WM | |
|---|---|---|---|---|
| BM4D[34] | 42.85±3.33 | 41.70±3.29 | 0.921±0.002 | 0.953±0.003 |
| NonLocal[14] | 46.77±2.31 | 39.11±2.19 | 0.968±0.002 | 0.923±0.01 |
| SRCNN[18] | 45.42±3.06 | 42.22±2.68 | 0.955±0.03 | 0.964±0.02 |
| VDSR[35] | 47.32±2.92 | 43.66±2.16 | 0.97±0.02 | 0.975±0.01 |
| DenseNet[28] | 46.96±2.87 | 43.84±2.40 | 0.969±0.02 | 0.976±0.01 |
| DCDenseNet (Ours) | 47.98±2.66 | 44.59±2.23 | 0.975±0.01 | 0.98±0.01 |
Fig. 3 shows box plots representing the distributions of PSNR and SSIM measured by each method. The BM4D [34] and NonLocal [14] obtained high variance due to difficulty of finding good parameter for all subjects. On the other hand, the deep learning based methods achieved relatively lower PSNR and SSIM variances. We also performed the two tailed Wilcoxon signed-rank test for statistical analysis. Table 2 represents the p-values between the DCDenseNet and other comparison methods. The improvement of our proposed method was statistically significant (i. e. p-value < 0.05) in the most cases.
FIGURE 3.
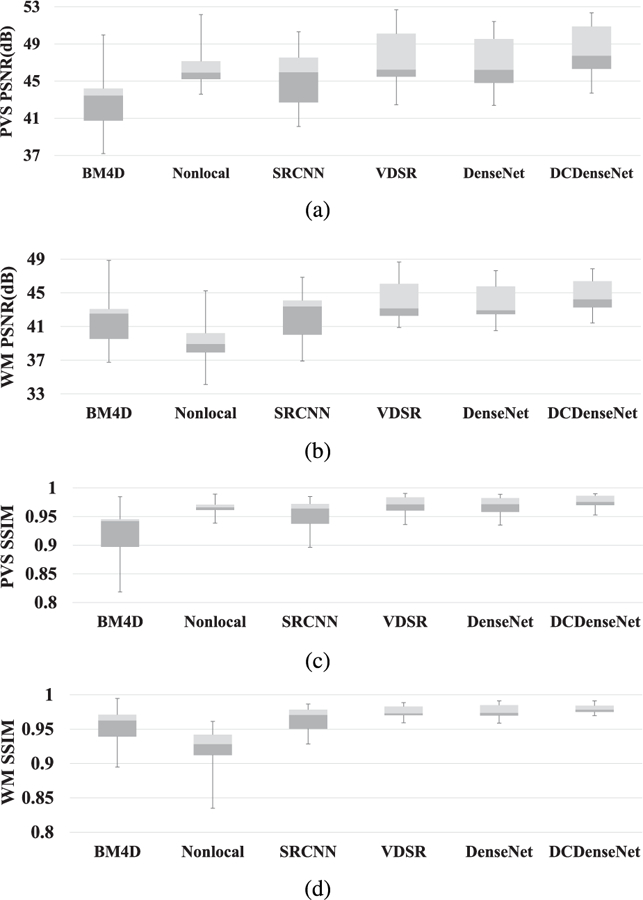
Box plots of the PSNR and SSIM scores. The top, center and bottom lines of each box represent upper quartile, median, and lower quartile scores, respectively. The upper and lower whiskers represent the maximum and minimum scores, respectively.
TABLE 2.
p-values computed by Wilcoxon signed-rank test between the proposed method and the comparison methods for PSNR and SSIM results, respectively.
D. QUALITATIVE RESULTS
Fig. 4 and Fig. 5 show the qualitative results obtained by the proposed method and the comparison methods. The difference between predicted image and enhanced image is represented in color and the relative root mean squared error (RRMSE). In the difference map, the red color implies that the intensity of enhanced image is higher than that of the predicted image, while the blue color implies that the intensity of predicted image is higher than that of enhanced image. The images obtained by BM4D showed the overall good denoising results on white matter, but the PVS were not improved well. Although the color was light near the PVS in the results generated by NonLocal method, lots of errors occurred on the white matter. This indicates that NonLocal method generates many noises in non-PVS white matter region. In the results obtained by SRCNN, it appeared that the regions surrounding PVS were enhanced with the PVS, and thus the PVS appeared to be thick. This may lead to the problem of merging multiple nearby thin PVS into a single thick PVS when quantifying the PVS. On the other hand, VDSR, DenseNet, and DCDenseNet only enhance the intensities of PVS sharply. Among the three deep networks, the DCDenseNet produces the most similar predicted images compared to the enhanced images.
FIGURE 4.
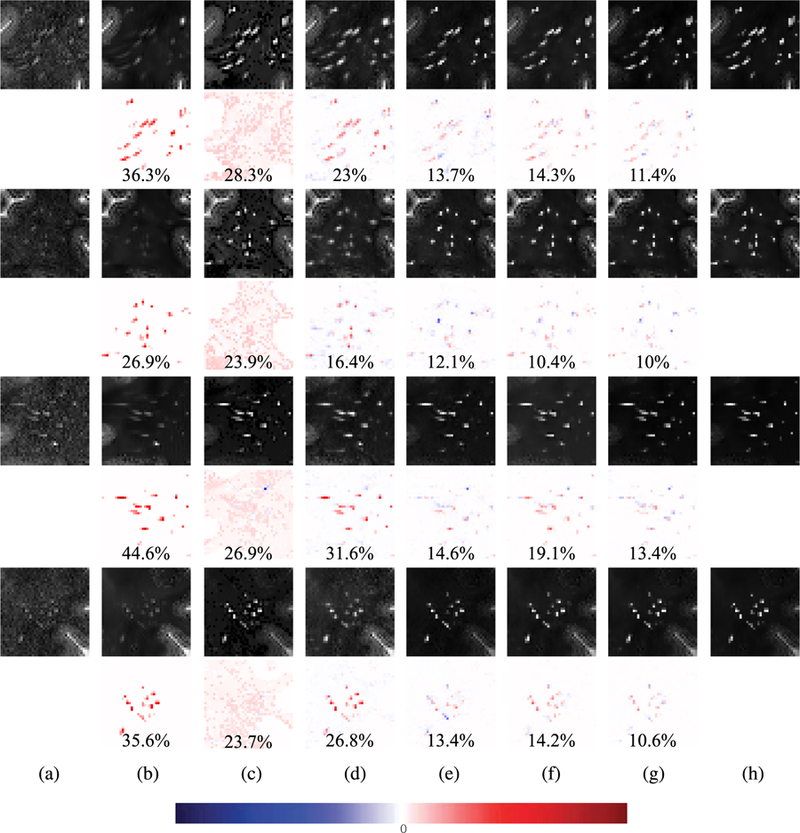
Visual comparison of predicted image patches obtained by the proposed method and the comparison methods. The difference maps between predicted patches and ground-truth patches and the relative root mean squared errors are provided in even rows. (a) The original images, (b) the results obtained by BM4D [34], (c) the results obtained by NonLocal [14], (d) the results obtained by SRCNN [18], (e) the results obtained by VDSR [35], (f) the results obtained by DenseNet [28], (g) the results obtained by DCDenseNet, and (h) the ground-truths.
FIGURE 5.
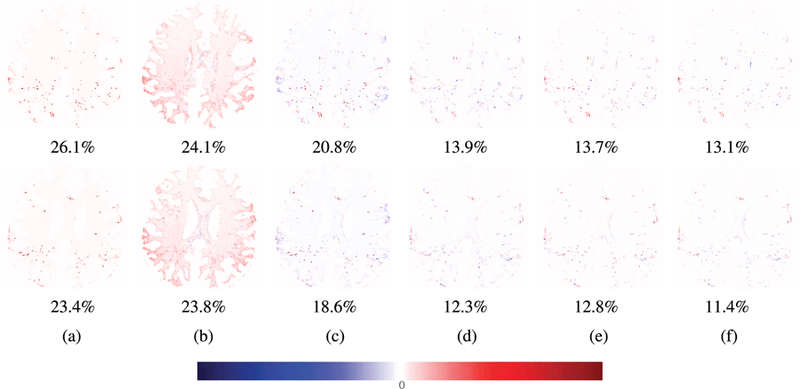
Visual comparison of difference maps between the predicted images and the ground-truth images and the relative root mean squared errors. (a) The results obtained by BM4D [34], (b) the results obtained by NonLocal [14], (c) the results obtained by SRCNN [18], (d) the results obtained by VDSR [35], (e) the results obtained by DenseNet [28], and (f) the results obtained by DCDenseNet.
E. DISCUSSION FOR COMPARISON NETWORKS
We further analyzed the impact of each component in the network by measuring the training loss and accuracy with respect to the training iterations. Fig. 6 and Fig. 7 represent the training loss and accuracy near the PVS and white matter with respect to the training iterations, respectively. Since the SRCNN [18] had a smaller number of parameters compared to other networks, it had relatively high initial and final training losses, thus low prediction accuracy. On the other hand, the VDSR [35] using a large number of parameters (i.e., 20 convolution layers with 32 channels) had the lowest initial and final training loss among the compared methods (Fig. 6). However, it overfitted to the training data, and thus the prediction accuracy was not the highest among the compared methods. Although the DenseNet obtained higher initial and final training loss than VDSR due to fewer parameters (i.e., 6 convolution layers with 8 channels), the accuracy was comparable to that of VDSR. According to these observations, we could confirm that the deep networks for high-level features as well as the densely connected skip connections utilizing low-level and high-level features were important to achieve good prediction. The proposed method obtained the lowest training loss and both the highest PSNR and SSIM in most iterations by using multiple dense blocks with all the feature maps generated.
FIGURE 6.
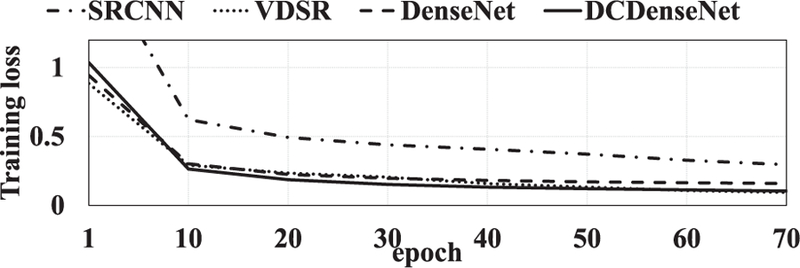
Change of training loss with respect to the training iteration in each comparison method.
F. DISCUSSION FOR NETWORK DEPTH
We also confirmed the performance change with respect to the number of dense blocks. Table. 3 shows the changes of average accuracy scores with respect to the change of the number of dense blocks, as well as the respective statistical difference between the results of DCDenseNet with 6 blocks and the results of others. The performance of PSNR and SSIM increased proportionally with the increasing number of dense blocks until six, and then decreased. The method with 6 dense blocks achieved the best performance, and was significantly better than DCDenseNet with less than 4 dense blocks in both PVS and white matter.
TABLE 3.
The changes of PSNR and SSIM scores and the number of parameters with respect to the change of the number of dense blocks. * denotes the result which is significantly worse than the results by DCDenseNet with 6 blocks by Wilcoxon signed-rank test (p-values < 0.05).
| # of blocks | # of parameters | PSNR-PVS | PSNR-WM | SSIM-PVS | SSIM-WM |
|---|---|---|---|---|---|
| 1 | 29192 | 46.96±2.87* | 43.84±2.4* | 0.969±0.02* | 0.976±0.01* |
| 2 | 57608 | 47.01±3.34* | 43.93±2.55* | 0.967±0.02* | 0.976±0.01* |
| 3 | 86024 | 47.38±2.82* | 44.27±2.26* | 0.971±0.01* | 0.978±0.01* |
| 4 | 114440 | 47.38±2.91* | 44.27±2.2 | 0.971±0.02* | 0.978±0.01* |
| 5 | 142856 | 47.52±2.95 | 44.19±2.22* | 0.972±0.02 | 0.978±0.01* |
| 6 | 171272 | 47.98±2.66 | 44.59±2.23 | 0.975±0.01 | 0.98±0.01 |
| 7 | 199688 | 47.40±2.79* | 44.26±2.19 | 0.971±0.02* | 0.978±0.01* |
| 8 | 228104 | 47.12±2.79* | 43.98±2.28* | 0.969±0.02* | 0.977±0.01* |
The learning time increases in proportion to the number of parameters, but the difference of computational time between DCDenseNet with 6 blocks and DCDenseNet with a single block was just around 10 seconds in the testing phase (i.e., DCDenseNet with 6 blocks took around 30 seconds, while DCDenseNet with a single block took 20 seconds). Although a relatively small amount of training data was used in this study, it demonstrated that using appropriate depth in a network can help learn parameters reflecting high-level features for non-linear image mapping problems.
IV. CONCLUSION
We proposed a novel PVS enhancement method using a deep dense network with skip connections. We demonstrated that the deep learning based method can be used for the PVS enhancement problem. Compared to previous PVS enhancement methods, the proposed method does not require empirical parameter tuning and additional processing such as denoising. Furthermore, the experiments show that the proposed method can significantly outperform the state-of-the-art deep learning based methods by utilizing various levels of features. In this paper, we solely focused on the task of designing a good generative model by changing network structures such as depth and skip connections. It is expected to further improve performance if discriminative learning in GAN can be applied. In the future, we will perform several experiments to prove how the proposed method can help in PVS segmentation.
Acknowledgments
This work was supported in part by the Basic Science Research Program through the National Research Foundation of Korea funded by the Ministry of Education under Grant 2018R1D1A1B07044473, and in part by the Grant of Artificial Intelligence Bio-Robot Medical Convergence Technology funded by the Ministry of Trade, Industry and Energy, the Ministry of Science and ICT, and the Ministry of Health and Welfare, under Grant 20001533.
Biography

EUIJIN JUNG received the B.S. degree in electronics engineering from the Korea University of Technology and Education, South Korea, in 2017. He is currently pursuing the master’s degree with the Department of Robotics Engineering, Daegu Gyeonbuk Institute of Science and Technology, Daegu, South Korea.
His research interests include deep learning, computer vision, and medical image processing.

PHILIP CHIKONTWE received the B.S. degree in computer science from Abdelhamid Mehri Constantine University, Algeria, in 2015, and the M.S. degree in computer science from Chonbuk National University, South Korea, in 2018, respectively.
He is currently a Research Assistant with the Department of Robotics Engineering, Daegu Gyeonbuk Institute of Science and Technology, Daegu, South Korea. His research interests include deep learning, computer vision, and medical image processing.
XIAOPENG ZONG received the B.S. degree in physics and electric engineering from the University of Science and Technology of China, Hefei, China, in 1999, and the Ph.D. degree in condensed matter physics from Iowa State University, Ames, IA, USA, in 2007.
From 2008 to 2016, he was a Research Associate in several U.S. universities, with a focus on developing MRI methods for biomedical research. He is currently an Assistant Professor with The University of North Carolina, Chapel Hill. His current research interest includes developing MRI methods for understanding the roles of perivascular spaces and small blood vessels in normal brain function and diseases.
WEILI LIN received the M.S. and Ph.D. degrees in biomedical engineering from Case Western Reserve University.
In 1999, he joined the faculty of The University of North Carolina (UNC), Chapel Hill, where he is currently a Professor with the Departments of Radiology, Neurology, and Biomedical Engineering and holds a joint appointment as a Professor with the UNC Eshelman School of Pharmacy. He is a member of the UNC Lineberger Comprehensive Cancer Center and serves as the Vice Chair of basic research with the Department of Radiology. He also serves as the Director of the Biomedical Research Imaging Center, School of Medicine, UNC, where he has been the Interim Director, since 2010. He has published more than 130 peer-reviewed papers, many of which appeared in high-impact journals. His research focuses on innovative biomedical applications of magnetic resonance imaging (MRI), including the use of nanotechnology, brain imaging in cases of cancer, stroke, early brain development, and both genetic and developmental brain abnormalities. He serves as an Ad Hoc Member of multiple study sections and site visit teams at the National Institutes of Health and has been a member and an Ad Hoc Member of multiple committees of the National Institute of Neurological Disorders and Stroke, part of the NIH. He edited a special issue of the journal Nuclear Magnetic Resonance in Biomedicine focusing on functional MRI and served as an associate editor for the journal Current Protocols in Magnetic Resonance Imaging. He is a member of the Editorial Board of Stroke, Translational Stroke Research, and Radiology Research and Practice.

DINGGANG SHEN was a tenured-track Assistant Professor with the University of Pennsylvania and a Faculty Member with Johns Hopkins University. He is currently the Jeffrey Houpt Distinguished Investigator, a Professor of radiology with the Biomedical Research Imaging Center (BRIC), The University of North Carolina at Chapel Hill (UNC-CH), and a Professor of computer science and biomedical engineering with UNC-CH. He is also directing the Image Display, Enhancement, and Analysis Laboratory, Center for Image Analysis and Informatics, Department of Radiology, and also directing the Medical Image Analysis Core with the BRIC. He has published more than 900 papers in the international journals and conference proceedings, with H-index 83. His research interests include medical image analysis, computer vision, and pattern recognition.
Dr. Shen is a Fellow of the IEEE, the American Institute for Medical and Biological Engineering, and the International Association for Pattern Recognition. He serves as an Editorial Board Member for eight international journals. He has served as the one of the Board of Directors of The Medical Image Computing and Computer Assisted Intervention (MICCAI) Society, from 2012 to 2015, and will be General Chair of MICCAI 2019.

SANG HYUN PARK received the B.S. degree in electrical and electronic engineering from Yonsei University, Seoul, South Korea, in 2008, and the Ph.D. degree in electrical and computer engineering from Seoul National University, Seoul, in 2014.
From 2014 to 2016, he was a Postdoctoral Fellow with the Image Display, Enhancement, and Analysis Laboratory, Department of Radiology, The University of North Carolina, Chapel Hill, NC, USA. From 2016 to 2017, he was a Postdoctoral Fellow with the SRI International, Menlo Park, CA, USA. Since 2017, he has been an Assistant professor with the Daegu Gyeonbuk Institute of Science and Technology, Daegu, South Korea. His research interests include medical image analysis, computer vision, and machine learning.
REFERENCES
- [1].Heie LA, Bauer CJ, Schwartz L, Zimmerman RD, Morgello S, and Deck MD, “Large Virchow-Robin spaces: MR-clinical correlation,’’Amer. J. Neuroradiol, vol. 10, pp. 929–936, Sep. 1989. [PMC free article] [PubMed] [Google Scholar]
- [2].Doubal FN, MacLullich AM, Ferguson KJ, Dennis MS, and Wardlaw JM, “Enlarged perivascular spaces on MRI are a feature of cerebral small vessel disease,’’ Stroke, vol. 41, no. 3, pp. 450–454, 2010. [DOI] [PubMed] [Google Scholar]
- [3].Rouhl RPW, van Oostenbrugge RJ, Knottnerus ILH, Staals JEA, and Lodder J, “Virchow-Robin spaces relate to cerebral small vessel disease severity,’’ J. Neurol, vol. 225, pp. 692–696, May 2008. [DOI] [PubMed] [Google Scholar]
- [4].Etemadifar M et al. , “Features of Virchow-Robin spaces in newly diagnosed multiple sclerosis patients,’’ Eur. J. Radiol, vol. 80, no. 2, pp. e104–e108, 2011. [DOI] [PubMed] [Google Scholar]
- [5].Kilsdonk I et al. , “Perivascular spaces in MS patients at 7 Tesla MRI: A marker of neurodegeneration?’’ Multiple Sclerosis J, vol. 21, no. 2, pp. 155–162, 2015. [DOI] [PubMed] [Google Scholar]
- [6].Favaretto A et al. , “Enlarged Virchow Robin spaces associate with cognitive decline in multiple sclerosis,’’ PLoS ONE, vol. 12, no. 10, 2017, Art. no. e0185626. [DOI] [PMC free article] [PubMed] [Google Scholar]
- [7].Chen W, Song X, and Zhang Y, “Assessment of the Virchow-Robin spaces in alzheimer disease, mild cognitive impairment, and normal aging, using high-field MR imaging,’’ Amer. J. Neuroradiol, vol. 32, pp. 1490–1495, Jul. 2011. [DOI] [PMC free article] [PubMed] [Google Scholar]
- [8].Ramirez J, Berezuk C, McNeely AA, Scott CJM, Gao F, and Black SE, “Visible Virchow-Robin spaces on magnetic resonance imaging of Alzheimer’s disease patients and normal elderly from the Sunnybrook Dementia Study,’’ J. Alzheimer’s Disease, vol. 43, pp. 415–424, 2015. [DOI] [PubMed] [Google Scholar]
- [9].Ramirez J, Berezuk C, McNeely AA, Gao F, McLaurin J, and Black SE, “Imaging the perivascular space as a potential biomarker of neurovascular and neurodegenerative diseases,’’ Cellular Mol. Neurobiol, vol. 36, pp. 289–299, Mar. 2016. [DOI] [PMC free article] [PubMed] [Google Scholar]
- [10].Wuerfel J et al. , “Perivascular spaces-MRI marker of inflammatory activity in the brain?’’ Brain, vol. 131, no. 9, pp. 2332–2340, 2008. [DOI] [PubMed] [Google Scholar]
- [11].Bouvy WH, Biessels GJ, Kuijf HJ, Kappelle LJ, Luijten PR, and Zwanenburg JJM, “Visualization of perivascular spaces and perforating arteries with 7 T magnetic resonance imaging,’’ Investigative Radiol, vol. 49, no. 5, pp. 307–313, 2014. [DOI] [PubMed] [Google Scholar]
- [12].Zong X, Park SH, Shen D, and Lin W, “Visualization of perivascular spaces in the human brain at 7 T: Sequence optimization and morphology characterization,’’ NeuroImage, vol. 125, pp. 895–902, Jan. 2016. [DOI] [PubMed] [Google Scholar]
- [13].Uchiyama Y et al. , “Computer-aided diagnosis scheme for classification of lacunar infarcts and enlarged Virchow-Robin spaces in brain MR images,’’ in Proc. 30th Annu. Int. Conf. IEEE Eng. Med. Biol. Soc., Aug. 2008, pp. 3908–3911. [DOI] [PubMed] [Google Scholar]
- [14].Hou Y et al. , “Enhancement of perivascular spaces in 7 T MR image using Haar transform of non-local cubes and block-matching filtering,’’ Sci. Rep, vol. 7, Aug. 2017, Art. no. 8569. [DOI] [PMC free article] [PubMed] [Google Scholar]
- [15].Huang G, Liu Z, van der Maaten L, and Weinberger KQ, “Densely connected convolutional networks,’’ in Proc. IEEE Conf. Comput. Vis. Pattern Recognit., Jul. 2017, pp. 4700–4708. [Google Scholar]
- [16].Wang X et al. , “Development and initial evaluation of a semi-automatic approach to assess perivascular spaces on conventional magnetic resonance images,’’ J. Neurosci. Methods, vol. 257, pp. 34–44, Jan. 2016. [DOI] [PMC free article] [PubMed] [Google Scholar]
- [17].Park SH, Zong X, Gao Y, Lin W, and Shen D, “Segmentation of perivascular spaces in 7T MR images using auto-context model with orientation-normalized features,’’ NeuroImage, vol. 134, pp. 223–235, 2016. [DOI] [PMC free article] [PubMed] [Google Scholar]
- [18].Dong C, Loy CC, He K, and Tang X, “Image super-resolution using deep convolutional networks,’’ IEEE Trans. Pattern Anal. Mach. Intell, vol. 38, no. 2, pp. 295–307, Feb. 2015. [DOI] [PubMed] [Google Scholar]
- [19].Yang J, Wright J, Huang TS, and Ma Y, “Image super-resolution via sparse representation,’’ IEEE Trans. Image Process, vol. 19, no. 11, pp. 2861–2873, Nov. 2010. [DOI] [PubMed] [Google Scholar]
- [20].Timofte R, De V, and Van Gool L, “Anchored neighborhood regression for fast example-based super-resolution,’’ in Proc. IEEE Int. Conf. Comput. Vis., Dec. 2013, pp. 1920–1927. [Google Scholar]
- [21].Kim J, Lee JK, and Lee KM, “Deeply-recursive convolutional network for image super-resolution,’’ in Proc. IEEE Conf. Comput. Vis. Pattern Recognit., Jun. 2016, pp. 1637–1645. [Google Scholar]
- [22].Ledig C et al. , “Photo-realistic single image super-resolution using a generative adversarial network,’’ in Proc. IEEE Conf. Comput. Vis. Pattern Recognit., Jul. 2017, pp. 105–114. [Google Scholar]
- [23].Lim B, Son S, Kim H, Nah S, and Lee KM, “Enhanced deep residual networks for single image super-resolution,’’ in Proc. IEEE Conf. Comput. Vis. Pattern Recognit., Jul. 2017, pp. 1132–1140. [Google Scholar]
- [24].Tong T, Li G, Liu X, and Gao Q, “Image super-resolution using dense skip connections,’’ in Proc. IEEE Int. Conf. Comput. Vis., Oct. 2017, pp. 4809–4817. [Google Scholar]
- [25].Pham C-H, Ducournau A, Fablet R, and Rousseau F, “Brain MRI super-resolution using deep 3D convolutional networks,’’ in Proc. IEEE 14th Int. Symp. Biomed. Imag., Apr. 2017, pp. 197–200. [Google Scholar]
- [26].Zhao C, Carass A, Dewey BE, and Prince JL, “Self super-resolution for magnetic resonance images using deep networks,’’ in Proc. IEEE 15th Int. Symp. Biomed. Imag., Apr. 2018, pp. 365–368. [Google Scholar]
- [27].Shi J, Liu Q, Wang C, Zhang Q, Ying S, and Xu H, “Super-resolution reconstruction of MR image with a novel residual learning network algorithm,’’ Phys. Med. Biol, vol. 63, no. 8, 2018, Art. no. 085011. [DOI] [PubMed] [Google Scholar]
- [28].Chen Y, Xie Y, Zhou Z, Shi F, Christodoulou AG, and Li D, “Brain MRI super resolution using 3D deep densely connected neural networks,’’ in Proc. IEEE 15th Int. Symp. Biomed. Imag., Apr. 2018, pp. 739–742. [Google Scholar]
- [29].Nie D et al. , “Medical image synthesis with deep convolutional adversarial networks,’’ IEEE Trans. Biomed. Eng, vol. 65, no. 12, pp. 2720–2730, Dec. 2018. [DOI] [PMC free article] [PubMed] [Google Scholar]
- [30].Wolterink JM et al. , “Deep MR to CT synthesis using unpaired data,’’ in Proc. Int. Workshop Simulation Synth. Med. Imag., 2017, pp. 14–23. [Google Scholar]
- [31].Olut S, Sahin YH, Demir U, and Unal G, “Generative adversarial training for MRA image synthesis using multi-contrast MRI,’’ in Proc. Conf. Med. Imag. Deep Learn., 2018, pp. 1–10. [Google Scholar]
- [32].Jung E, Zong X, Lin W, Shen D, and Park SH, “Enhancement of perivascular spaces using a very deep 3D dense network,’’ in Proc. Int. Workshop PRedictive Intell. MEdicine, 2018, pp. 18–25. [Google Scholar]
- [33].Zhang Y, Brady M, and Smith S, “Segmentation of brain MR images through a hidden Markov random field model and the expectation-maximization algorithm,’’ IEEE Trans. Med. Imag, vol. 20, no. 1, pp. 45–57, Jan. 2001. [DOI] [PubMed] [Google Scholar]
- [34].Maggioni M, Katkovnik V, Egiazarian K, and Foi A, “Nonlocal transform-domain filter for volumetric data denoising and reconstruction,’’ IEEE Trans. Image Process, vol. 22, no. 1, pp. 119–133, Apr. 2013. [DOI] [PubMed] [Google Scholar]
- [35].Kim J, Lee JK, and Lee KM, “Accurate image super-resolution using very deep convolutional networks,’’ in Proc. IEEE Conf. Comput. Vis. Pattern Recognit., Jun. 2016, pp. 1646–1654. [Google Scholar]
- [36].He K, Zhang X, Ren S, and Sun J, “Delving deep into rectifiers: Surpassing human-level performance on ImageNet classification,’’ in Proc. IEEE Int. Conf. Comput. Vis. , Dec. 2015, pp. 1026–1034. [Google Scholar]
- [37].Kingma D and Ba J. (2014). “Adam: A method for stochastic optimization.’’ [Online]. Available: https://arxiv.org/abs/1412.6980
- [38].Yushkevich PA et al. , “User-guided 3D active contour segmentation of anatomical structures: Significantly improved efficiency and reliability,’’ NeuroImage, vol. 31, no. 3, pp. 1116–1128, Jul. 2006. [DOI] [PubMed] [Google Scholar]


