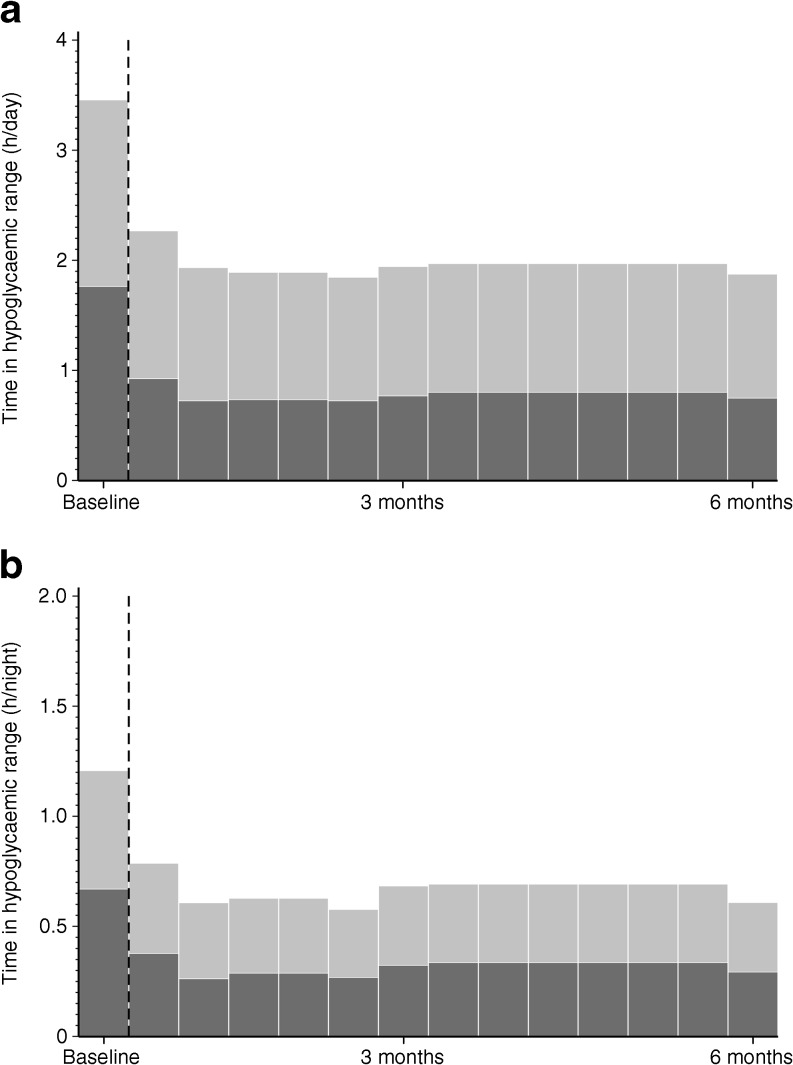
Fig. 4.
Time in hypoglycaemic range during baseline and treatment phase (days 1–208) in the intervention group in the per-protocol set for (a) overall 24 h and (b) the night (23:00–06:00 hours) period. Light grey, time in range 3.1–<3.9 mmol/l; dark grey, time <3.1 mmol/l; dashed line, sensor unblinded

