

Abstract
Hydrogels formed by polyelectrolyte complexation (PEC) of oppositely charged biopolymers, free of any chemical additives, are promising biomaterials. In this work, the mechanical behavior of hydrogels consisting of positively charged chitosan and negatively charged sodium hyaluronate (HA) at balanced charge composition is investigated. These hydrogels exhibit strong tensile strain and strain rate dependence. They are elastic-like, independent of the strain rate at small strain, but exhibit plastic-like behavior above the yield point by showing a monotonous decrease of the stress. The cyclic tensile test demonstrates that these hydrogels exhibit small and quickly recoverable hysteresis in the elastic-like region, but large and partially recoverable hysteresis above the yield point. The stress relaxation experiment shows a plateau in the reduced stress followed by an abrupt fracture, and the time-to-failure decreases exponentially with increasing applied step-strain. Such elastic-to-plastic-like transformation of the biopolymer PEC gels is quite different from the behaviors of PEC hydrogels formed by oppositely charged vinyl-type synthetic polyelectrolytes due to the difference in flexibility, charge density, and ionic bond strength of these polymers.
Graphical Abstract
1. Introduction
Hydrogels formed by the chemically or physically crosslinked polymers with mechanical properties adjustable over a wide range are the most promising materials for artificial tissue and organs, due to their low modulus and high water content.1–8 The recently developed polyampholyte hydrogels (PA gels) provide a strategy to develop a new class of physically crosslinked networks characterized by high toughness, recoverability, and self-healing ability.9–16 The tough PA gels were synthesized by one-step free radical copolymerization of high concentration solutions of oppositely charged ionic monomers at compositions close to charge balance. After dialysis of small ions in water, the PA gels form reversible intra- and inter-chain ionic bonds resulting in high toughness and self-healing properties of these materials. An alternative molecular design is polyelectrolyte complex hydrogels (PEC gels),17 which was also called polyion complex (PIC) gels, formed from oppositely charged polyelectrolytes.18–20 The PEC hydrogels were synthesized by the sequential homo-polymerization of cationic and anionic monomers,18,20 or formed by directly mixing the oppositely charged polyelectrolytes.19 In spite of the primary polymer structure of PEC gels being very different from the primary structure of PA, these PEC gels also form reversible inter-chain ionic bonds leading to high toughness and self-healing properties.18–20
The similarities of polyampholyte and polyelectrolyte complex hydrogels suggest a general approach of developing tough and self-healing gels with reversible ionic bonds. This general scheme leaves the freedom in the choice of polymers - as long as they are charged they can be either synthetic or natural. Charged biopolymers, such as polysaccharides,21,22 polypeptides,23 and DNA24 can, in principle, form self-healing hydrogels based on the polyelectrolyte complex formation mechanism. The physical hydrogels from the biopolymers without any chemical additives are promising candidates for biomedical applications because they are bio-compatible and eco-friendly. In this work, the mechanically strong polyelectrolyte complex hydrogels from a pair of oppositely charged biopolymers – positive chitosan and negative sodium hyaluronate (HA) were synthesized by tuning the composition of the hydrogels. From the tensile and stress relaxation measurements, we found that the HA/chitosan hydrogels exhibit quite different mechanical properties in comparison to the properties of hydrogels formed by complexation of oppositely charged synthetic polyelectrolytes. The synthetic PEC hydrogels, formed either by two-step polymerization or by simple mixing of the oppositely charged synthetic polyelectrolytes, are highly viscoelastic materials over a wide range of strain rates even at small deformation. They exhibit yield but sustain large deformation after yield. No flow occurs even at fracture and strong finite chain extensibility effects have been observed in synthetic PEC hydrogels.18–20 By contrast, HA/chitosan hydrogels are elastic-like at small strains, almost independent of the strain rate, but become plastic-like at large strains, exhibiting yield, flow, and fracture that are delayed at high strain rates. The transformation of HA/chitosan hydrogels from elastic to plastic-like and their difference from synthetic PEC is related to the difference in charge density and chain flexibility between biological and synthetic hydrogels. We demonstrate that PEC hydrogels have rich mechanical properties that can be tuned by adjusting their structure.
2. Experimental section
2.1. Materials
Sodium hyaluronate (HA) (molecular weight 1,900,000 g/mol) was purchased from Kiccoman Biochemifa Co. Ltd. Chitosan (molecular weight ~ 100,000 g/mol) was purchased from Junsei Chemical Co. Ltd. Both hydrochloric acid and sodium chloride were purchased from Wako Pure Chemical Industries Ltd. All the chemicals were used without further purification.
The chemical structure of HA and chitosan are shown in Scheme 1. The degree of deacetylation of chitosan was determined by NMR to be 76% (see Supporting Information for details). From the molecular weight and degree of deacetylation, the number of repeat units m (2-acetamido-2-deoxy-D-glucopyranose) and n (2-amino-2-deoxy-D-glucopyranose) in chitosan was estimated as 140 and 444, respectively. One repeat unit of HA has two saccharides. The length l = 1.02 nm of the repeat unit,25 and the distance d = 1.02 nm between charges in HA is larger than the corresponding distances in chitosan (l = 0.55 nm26 and d = 0.72 nm). The two polymers have similar ranges of persistence lengths lp (5.3 ~ 11.5 nm for HA27,28 and 4 ~ 15 nm for chitosan29–31). In addition, HA has a much longer contour length (Lc = 4,800 nm) than chitosan (Lc = 320 nm). Both individual polymers have a large number of Kuhn segments, indicating that they behave as flexible chains in a salt solution. The structure parameters of the two polymers are summarized in Table 1.
Scheme 1.

Molecular structure of sodium hyaluronate (HA) and chitosan.
Table 1.
Structure parameters of individual HA and chitosan chains.
| Polymer | Molecular weight, M (g/mol) |
Mass of repeat unit, m (g/mol) |
Number of repeat units, n |
Length of repeat unit, l (nm) |
Distance between charges, d (nm) |
Persistence length, lp (nm) |
Contour length, Lc (nm) |
Number of Kuhn segments, Nk |
|---|---|---|---|---|---|---|---|---|
| HA | 1,900,000 | 401 | 4,700 | 1.02 | 1.02 | 5.3 ~ 11.5 | 4800 | 210 ~ 456 |
| Chitosan | 100,000 | 203a; 161b Average 171c | 140a; 444b | 0.55a; 0.55b | 0.72 | 4 ~ 15 | 320 | 11 ~ 40 |
*a) and b) correspond to the repeat unit of 2-acetamido-2-deoxy-D-glucopyranose and 2-amino-2-deoxy-D-glucopyranose in Chitosan, respectively. c) corresponds to the average molar mass of repeat unit for chitosan taking into consideration the degree of deacetylation (76%). The number of repeat units n, contour length of polymers Lc, and the number of Kuhn segments Nk are expressed as M/m, l·n, and Lc/2lp, respectively. The distance between charges of chitosan is the average taking into consideration the degree of deacetylation (76%).
2.2. Preparation of polyelectrolyte complex hydrogels
Chitosan and HA were separately dissolved in 1 M acetic acid aqueous solutions under magnetic stirring yielding 7 wt% chitosan and 1 wt% HA solutions, respectively. At the next step sodium chloride was added to the above two solutions to reach 1 M concentration in each solution, and finally, we mixed these two solutions in different weight ratios to get a homogenous but slightly turbid mixture. The prepared solution was cast onto a glass plate, and immersed in ethanol, a poor solvent for these two biopolymers, to induce phase inversion. The glass plate was then immersed in water to dialyze the co-ions and counter-ions of the charged polymers. The water was changed every day for 7 days until transparent hydrogels were obtained. The resulting hydrogels were used in the mechanical studies.
The pKa of Chitosan is 6.17 – 6.51 taking into account the degree of deacetylation ~ 76%,32 and therefore it is partially ionized in pure water (pH ~ 7.0). The pKa of HA is about 2.9 and the carboxyl groups are fully ionized in pure water.33 Although the formation of ion complexes could promote the protonation of chitosan and deprotonation of HA, we only calculated the nominal charge ratio in the gels from the carboxyl groups of HA and the –NH2 groups of chitosan taking into account its degree of deacetylation.
2.3. Characterizations of the hydrogels
The dry polymer weight was measured after water evaporation by heating hydrogels and weighing the remaining solids, since NaCl was almost completely removed by dialysis. The wet hydrogel was weighed and its weight w0 was typically larger than 0.5g that allowed us to achieve higher measurement accuracy. Then the gel was buried under a large amount of dry sea sand and heated to 120 °C to remove all water from the sample. Finally, the sample was cooled down to room temperature and weighed again (w1). The polymer weight fraction, cp, was calculated by .
Uniaxial tensile test The uniaxial tensile test was performed by a tensile-compressive tester (Tensilon RTC-1310A, Orientec Co.) on dog-bone shaped samples with thickness 0.2 mm and with the standard JIS-K6251–7 size (gauge length 12 mm (L), width 2 mm (w)), as shown in the Scheme 2 The dog-bone shaped samples were cut from the hydrogels after dialysis using a cutter driven by an air compressor. The measurements for various tensile velocities were conducted at 25 °C. All the mechanical measurements were performed in pure water to avoid drying of the samples. The strain rates were 0.014 s−1, 0.028 s−1, 0.069 s−1, 0.14 s−1, 0.42 s−1, and 0.69 s−1. Unless specified otherwise, the stress in this work refers to the engineering stress, σ, defined as the tensile force divided by the cross-section area of the undeformed sample. The strain rate in this work, , refers to the engineering strain rates, defined as the tensile velocity divided by the gauge length L = 12mm of the undeformed sample (see Scheme 2).
Scheme 2.

Geometry of the tensile test sample.
Cyclic tensile test Samples of the same shape and size as for uniaxial tensile tests were used for the cyclic tensile test under two engineering strain rates of 0.14 s−1 and 0.69 s−1. The hydrogels are clamped tightly by the metal plates to prevent them from slipping during the cyclic test. First, the lower clamp stretched the sample to a predetermined strain ε at a prescribed engineering strain rate and then the clamp returned to its original position at the same strain rate without stopping at the peak stretched strain ε, completing the first tensile cycle, after which the sample was held at this position for a waiting period, tw. Next, it was stretched to the same strain ε at the same strain rate and returned to the original position again, completing the second cycle. Subsequent tensile cycles were performed for various waiting times tw between two adjacent cycles. The stress recovery ratio, ηmax,f, is defined as the ratio of the maximum achieved stress σmax during the second tensile cycle to that of the first cycle.
Stress relaxation Samples of the same shape and size as in uniaxial tensile tests were used for the stress relaxation test. Samples were stretched to a prescribed strain εs at an engineering strain rate of 0.69 s−1, and then were held at this constant strain εs, while the changes in stress were recorded. The stress relaxation measurements were conducted for different strain magnitudes εs: 0.2, 0.3, 0.4 and 0.5.
3. Experimental results and discussion
3.1. Formation of polyelectrolyte complex hydrogel
Figure 1a shows the appearance of the - as-mixed solution at a mass ratio of 2.0. The solutions were slightly turbid, with no apparent changes in viscosity in comparison to the HA solutions, indicating that the two polymers at the strong acidic condition of high ionic strength do not form hydrogels. Within a very narrow mass ratio of HA/chitosan (1.8 ~ 2.2 (w/w)), corresponding to a nominal charge ratio (anion/cation) in the range of 0.98 ~ 1.20, the solution casted on the glass substrate formed opaque gel membranes in ethanol (Figure 1b), a poor solvent for both polymers (Table 2). The gel membranes became transparent after immersion in pure water (Figure 1c). During this process, the counter-ions and co-ions of the HA and chitosan were removed by the dialysis, and complexation of HA and chitosan resulted in the formation of polyelectrolyte complex hydrogel (PEC gel). The final polymer concentrations of hydrogels from this narrow range of HA/chitosan mass ratios (1.8 ~ 2.2 (w/w)) are quite similar, c.a. 23 ~ 25 wt%. We also found that the obtained hydrogels dissolved completely when they were reincubated for several hours in 1 M acetic acid aqueous solutions containing 1 M NaCl, indicating the reversibility of the ionic bonds. The PEC hydrogel at a feeding mass ratio of 2.0, corresponding to a nominal charge ratio of 1.09, was mechanically strong, while samples with mass ratios 1.8, 2.1, 2.2 were relatively weaker. For mass ratios 1.6 and 2.3, the samples were very fragile and easily broke into small pieces during the dialysis process (Table 2). Given its highest mechanical strength, the PEC hydrogel at a feeding mass ratio of 2.0 is expected to have a true charge ratio closest to the charge balance. Due to their weak polyelectrolyte nature, the charges on the amino groups of chitosan and carboxyl groups of HA are not fixed but are adjustable depending on the local environment. If the carboxyl group of HA is close to the chitosan backbone at a particular location, the protonation of the amino group of chitosan is expected to occur more often. The self-adjustable properties of charges lead to a balanced charge for the sample with a nominal charge ratio of 1.09 (Table 2). This composition was chosen for all the subsequent studies because it results in the strongest hydrogels.
Figure 1.

Photo images of as-mixed HA/chitosan solution (a), the gel membrane formed in ethanol (b) and the gel membrane dialyzed in pure water (c). The HA/chitosan feeding mass ratio was 2.0 (nominal charge ratio of 1.09).
Table 2.
Composition dependence of the gelation for the HA/chitosan mixture. The nominal charge ratio was estimated from the ratio of carboxyl groups and amino groups after taking into consideration the incomplete deacetylation of chitosan determined by NMR (SI). * Samples were too weak to perform quantitative measurements.
| Mass ratio in feed (w/w) (HA/chitosan) | 1.6 | 1.8 | 2.0 | 2.1 | 2.2 | 2.3 |
|---|---|---|---|---|---|---|
| Nominal charge ratio (−/+) | 0.87 | 0.98 | 1.09 | 1.14 | 1.20 | 1.25 |
| Gelation | ○ | ○ | ○ | ○ | ○ | ○ |
| Polymer conc. of gel (wt%) | -* | 23 | 25 | 23 | 24 | -* |
| Mechanical property | very weak | weak | strong | weak | weak | very weak |
3.2. Tensile properties
The hydrogels, stretched at a low strain rate (= 0.014 s−1), broke in a relatively brittle manner (Movie S1). With the increase of the strain rate (= 0.69 s−1), the gels sustained a large deformation and became fiber-like materials before breaking (Movie S2). The hydrogel, stretched by hand at a very high strain rate, turned into a single thin fiber (Movie S3). Thus, the PEC hydrogels change their behavior from brittle to ductile with increasing strain rate.
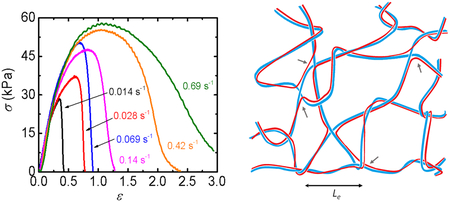
Figure 2a shows the images of the fractured sample stretched at various strain rates. The tensile curves of the sample stretched at different strain rates are shown in Figure 2b. At the low strain rate, the stress increases with increasing strain, reaches a maximum, and then abruptly decreases, indicating a brittle fracture. The stress-strain curves at high strain rates exhibit a bell-like shape. After reaching the maximum (yield) point, the stress gradually decreases to a low level. Upon continuous stretching, the sample transforms into a thin fiber before breaking, as shown in Movie S2. Although the fractured sample quickly shrinks after fracture, one can still observe some fiber-like structures in the images of the samples after the fracture in Figure 2a.
Figure 2.

Mechanical behaviors of HA/chitosan polyelectrolyte complex (PEC) hydrogel at the nominal charge ratio of HA/chitosan of 1.09. (a) Images of fractured sample stretched at various strain rates. (b) Tensile stress-strain curves (σ − ε) of the sample at different strain rates. (c) Strain rate dependence of yield stress σy and yield strain εy.
The stress-strain curves at different strain rates almost coincide with each other at small strains, demonstrating the elastic-like behavior of the sample. However, both yield stress (maximum stress σy) and yield strain εy increase with increasing strain rate, as shown in Figure 2b. The yield stress increases linearly with yield strain (Figure S1). The strain rate dependence of the yield strain and yield stress is logarithmic in the observation range, as shown in Figure 2c, and can be expressed as:
| (1) |
| (2) |
where εy,0 = 0.23, σy,0 = 7.6 kPa, and = 0.004 s−1 are the characteristic yield strain, yield stress, and strain rate, respectively. The results suggest that the yield occurs above the critical strain rate . The inverse of corresponds to a characteristic time, τ* ~ 250 s. The elastic behavior at small strains (~ 20%) suggests that the ionic bonds in PEC hydrogel cannot relax and thereby behave as quasi-permanent crosslinks at observation times . Furthermore, given the fact that the sample does not show flow behavior after being stored in water for several months, one can conjecture that the relaxation time of the PIC gel is much longer than the characteristic time τ* for the sample to yield under a finite stress. The yield behavior and stress decay at large strains indicate the tension-induced bond ruptures. The fiber-like elongation suggests stress-induced “flow” with almost no effective strong “permanent” bonds at the final stage of the yield process.
To quantify the elastic-like behavior, we analyze the tensile behavior using the Mooney-Rivlin equation that describes the elasticity of rubbers:34
| (3) |
Here σ and σred are the nominal and the reduced engineering stress, respectively, λ is the elongation ratio that is related to the strain ε by λ = 1 + ε, C1 and C2 are materials constants. The 2C1 is related to the shear modulus G, while 2C2, the slope of σred as a function of 1/λ, is related to the strain softening (C2 > 0) or strain hardening (C2 < 0). The strain softening is usually due to entanglements and/or breaking of weaker ionic bonds, while the strain hardening is traditionally attributed to the finite extensibility of network chains.34 The Mooney-Rivlin plots (λ−1 dependence of σred) for different strain rates are shown in Figure 3a. The reduced stress exhibits a quasi-plateau with a strain softening before the abrupt stress decrease at large elongation (small 1/λ). Mooney-Rivlin coefficients C1 and C2 are estimated for various applied strain rates from the Mooney-Rivlin plots in the quasi-plateau regions before yield (Figure 3b). The coefficient C1 is almost constant ~ 6 kPa, except at low strain rate and can be attributed to some strong cross-linking structure that does not break during the observation time at small strain, which gives shear modulus of G = 2C1 ~ 12 kPa. The coefficient C2 is positive (strain softening) with a roughly constant value (c.a. 23 kPa) independent of strain rate. The coefficient C2 could be related to either entanglements or the breaking of weak ionic bonds upon hydrogel deformation. Given its strain rate independence, the coefficient C2 is most probably related to the entanglements. In this case, the entanglement modulus Ge is estimated ~ 46 kPa from the two times the coefficient C2, which is a reasonable value for a polymer solution at 25 wt % concentration.34
Figure 3.

Mechanical behaviors of HA/chitosan polyelectrolyte complex (PEC) hydrogel at the nominal charge ratio of HA/chitosan of 1.09. (a) Mooney-Rivlin curves σred = σ/(λ − λ−2) as a function of 1/λ at various strain rates. (b) C1 and C2 calculated from the Mooney-Rivlin plot in the range of λ = 1.2–1.7. (c) Stretching time dependence of reduced stress σred = σ/(λ − λ−2) at various strain rates . (d) Time to failure (tf) determined from (c) as a function of strain rate ().
Upon continuous stretching, no strain-hardening but substantial strain softening was observed before the onset of the flow, suggesting that the strong crosslinking structure at small strain breaks before the build-up of the significant tension in the polymer strands by stretching.
To analyze the dependence of the time-to-failure on the strain rate, we plot the dependence of the reduced stress on the stretching time in Figure 3c. The reduced stresses corresponding to different strain rates almost overlap with each other in the plateau region at short stretching times and with small strains. The reduced stress abruptly decreases after the plateau at the time we called “time-to-failure”, tf (Figure 3d and Figure S2). The time-to-failure is much shorter than the characteristic time τ* (= 250 s) obtained from the yield behavior, and decreases with increasing strain rate , following a power law (Figure 3d), except for the very low strain rate (< 0.028 s−1). Therefore, failure strain, εf, corresponding to the near-breaking of sample increases as the power law of the strain rate (Figure S3):
| (4) |
where is the characteristic strain rate, corresponding to a characteristic time, τ**~11.3 s. This result is different from the yield strain that follows a logarithmic relation with the strain rate. Furthermore, the characteristic time τ**~11.3 s is much shorter than the value τ*(= 250 s) estimated from the yield behavior. The critical yield strain and failure strain are almost the same at low strain rate (< 0.14 s−1). At higher strain rate the failure strain increases faster with strain rate than the yield strain (εf >εy) (Figure S3).
3.3. Cyclic tensile tests
The tensile results presented above suggest that HA/chitosan PEC hydrogel exhibits elastic-like properties for small strains and plastic-like properties under large strains, and the gel exhibits brittle-to-ductile transformation with increasing strain rate. To further confirm these observations, we performed cyclic tests with different strains and strain rates.
Figure 4 displays results for two different applied strain amplitudes: small strain (ε = 0.5) below the yield point and large strain (ε = 1.0) above the yield strain (εy = 0.66) at a relatively low strain rate of 0.14 s−1 according to the tensile results of Figure 2b. Small hysteresis with a small residual strain is observed even at the small strain (ε = 0.5), below the yield point (Figure 4a). The small hysteresis indicates that a small amount of energy is dissipated during the tensile stretching. The dissipation can be attributed to the breaking of weak ionic bonds. The subsequent loading cycles after various waiting times (from 1 min to 2 h) always start from the state of zero stress and strain, which means that the small residual strain disappears within 1 min of waiting time. However, it takes about 20 min waiting time for the hysteresis curve to fully recover to the first loading-unloading curve. This indicates that some structures with long relaxation times maintain the elasticity allowing the gel to quickly recover the deformation but the ruptured weak ionic bonds need more time to reform their original pairs.
Figure 4.

Cyclic tensile curves (σ − ε) for different waiting periods at strain amplitude, ε, of 0.5 (a) and 1.0 (b) at a small strain rate, = 0.14 s−1. The yield strain εy at this strain rate is 0.66. The numbers in the figures are the durations tw of the waiting periods.
A large hysteresis, together with a large residual strain (ε ~ 0.7), is observed after experiencing a large strain amplitude (ε = 1), above the yield point (Figure 4b). After waiting for 2 hours, a residual strain of 0.2 still exists, and the hydrogel can be stretched by a very true stress, corresponding to a true stress ~ 2.5 kPa corrected by the decrease of the cross-sectional area. This means that the slippage between the polymer chains occurs during stretching. This is consistent with the observation that the hydrogel sample can be stretched into a very long thin fiber. These results indicate the quasi-elastic behavior and small energy dissipation below the yield point, and the chain flow with large energy dissipation above the yield point for low strain rate.
The cyclic tensile tests were also conducted at a large strain rate of 0.69 s−1, at which the sample exhibited yield strain of εy = 1.2. Four different strain amplitudes were investigated: small strain (ε = 0.5), strain below yield (ε = 1), strain at yield (ε = 1.2), and strain above yield (ε = 1.5). The cyclic stress-strain behavior at small strain amplitude (ε = 0.5) and high strain rate (Figure 5a) is similar to the behavior observed at low strain amplitude and low strain rate (Figure 4a), except that the curves coincide with each other at much shorter waiting time (~ 2 min) in comparison with that of the former case (~ 20 min). The hysteresis increases at large strain amplitude of ε = 1, and it takes about 15 min for the full recovery (Figure 5b). At strain amplitude ε = 1.2 corresponding to the yield point, the sample can still fully recover after a cycle, but only after a long waiting period of 1 h (Figure 5c). For strain amplitude ε = 1.5, above the yield point, the cyclic curves could not fully recover even after 10 h waiting (Figure 5d), indicating that irreversible chain slip occurred above the yield point.
Figure 5.

Cyclic tensile test curves (σ − ε) for different waiting periods at the various strain amplitudes, ε, of 0.5 (a), 1.0 (b), 1.2 (c), and 1.5 (d) at a high strain rate, = 0.69 s−1. The yield strain εy at this strain rate is 1.2. The numbers in the figures are the durations tw of the waiting periods.
It is interesting to observe that even at a small strain below the yield point the sample starts to “flow” if a subsequent stretching is performed after a relatively short waiting period, before the full recovery. For example, for strain amplitude ε = 1.0, the sample starts to flow if the waiting time is 2 min or less (Figure 5b). At the yield point of ε = 1.2, the flow occurs after 5 min or shorter waiting period (Figure 5c). These results indicate that if the loading history is not completely erased, and the broken weak ionic bonds have not yet been rebuilt between the primary partners, the irreversible flow of the chains is easier to occure even below the yield point.
The results in Figure 4 and 5 show that compared with the bond breaking time upon loading, much longer waiting times are required for the recovery. During the loading and unloading process of self-healing materials, the reversible physical bonds are broken and reformed repeatedly. The dynamic process of bond breaking and reforming is well described by the proposed self-healing theories.35,36 When the deformation is applied, the initial physical bonds, referred to as the primary bonds, break, and chains quickly reattached to other chains to form temporary bonds with partners different from their original ones. The newly formed temporary bonds carry the load and break if further deformation is imposed on the sample after their formation. Such bond breakage and reformation process is repeated during the loading stage. During the recovery stage, the rubber elasticity is the driving force towards reconnecting the primary pairs, while temporary bonds are formed and broken repeatedly before the original primary bonds are reformed and the sample fully recovers its initial state. Thus, the recovery time is the accumulation of all these bonds breaking and reformation times during the process of polymer strands shrinking back to their initial conformation.34,35 Accordingly, the recovery time of the bulk materials is much longer than the bond re-association time.
The above results show that the recovery ability strongly depends on the loading history, that includes the applied strain and strain rate. To describe the recovery process, we plot the dependence of the stress recovery ratio ηmax,f on the waiting periods tw under various strains ε and strain rates in Figure 6. Here, the stress recovery ratio ηmax,f corresponds to the ratio of the maximum achieved stress σmax during the second tensile cycle to that of the first cycle. It has been shown that the longer waiting periods increase the probability of broken bonds to reform and thus are beneficial to the recovery process. At the same strain rate, the increase of applied strain ruptures more bonds and delays the recovery process (Figure 6a and 6b). As a result, much longer waiting periods are required to achieve the same recovery ratio at the higher applied strain. At the same applied strain, the stress is much lower at lower strain rates and the recovery slows down after lower applied strain rates (Figure 6c and 6d). As the time required to load the sample is much longer at lower applied strain rate, more initial primary bonds are broken, and more temporary bonds are formed between different pairs of chains. Thus, longer time for the healing of the broken primary ionic bonds is required.
Figure 6.

Waiting time tw dependence of the stress recovery ratio ηmax,f at various applied strains ε and strain rates . (a) ε = 0.5 and 1.0, = 0.14 s−1; (b) ε = 0.5, 1.0, 1.2 and 1.5, = 0.69 s−1; (c) ε = 0.5, = 0.14 and 0.69 s−1; (d) ε =1.0, = 0.14 and 0.69 s−1. ηmax,f is defined as the ratio of maximum stress of the 2nd cycle to that of the 1st cycle.
In summary, the hydrogel can experience a transformation from elastic to plastic-like behavior by 1) increasing strain for a fixed strain rate (from Figure 4a to 4b, or Figure 5c to 5d), 2) by decreasing the strain rate (from Figure 5b to 4b), and 3) by performing the sequential stretching before the full recovery (Figure 5b and 5c).
3.4. Stress relaxation
Since the behavior of the hydrogel exhibits the transformation from elastic to plastic-like upon subsequent stretching before its full recovery, we expect failure of these hydrogels at a fixed strain even below the yield point. To confirm this, we conducted the stress relaxation test. The dog-bone shaped sample was stretched to an assigned strain under a relatively high strain rate of 0.69 s−1, and then was held at that strain and the time dependence of the stress was recorded until the sample failure. Figure 7a presents the time t dependence of the reduced stress σred = σ/(λ − λ−2) for various initial step strains εs, lower than the yield strain (εy = 1.2) at the given strain rate of 0.69 s−1. For each strain, the reduced stress first gradually decreases with the loading time, then decreases abruptly. This abrupt decrease in the stress is related to the rupture of the hydrogel, as shown by the movies of the stress relaxation tests (Movie S4 and S5). The decreases in the reduced stress (Eq. 3) for different strains almost overlap with each other, indicating that the stress relaxation process before the sample rupture is independent of applied strain, which is consistent with the condition that the applied strain is below the yield point. The onset time of the abrupt decrease of the reduced stress, denoted as the time-to-failure, ts, decreases exponentially with the increase of the applied strain εs,
| (5) |
where ts,0 = 7260 s (2 h) and ε* = 0.078 are the characteristic fracture time and strain respectively, for the observation step strain window from 0.2 to 0.5. The exponential relationship of Eq. 5 is like Eq. 2 for the yield point obtained from the tensile test, but with much longer characteristic time (~ 2 hours). This characteristic time corresponds to a long relaxation time of the sample.
Figure 7.

(a) The log-log plots of the reduced stress relaxation profiles σred(t) at varied step strains εs. (b) The semi-log plot of step strain dependence of the time-to-failure (ts − εs) obtained from the onset of the abrupt stress reduction in (a). The step-strain was applied at a strain rate of 0.69 s−1 and the step strains (εs = 0.2–0.5) are lower than the yield strain (εy = 1.2) at the given strain rate. The numbers in (a) are the values of step strain applied.
Note that the sample does not show flow behavior without applying a stress even after being stored in water for several months. This indicates that the bio-PEC hydrogels are in solid-like state with a very long lifetime of ionic bonds. While the strain rate dependence of the yield behavior shows a characteristic time of τ* = 250 s (Figure 2c), and the stress relaxation experiment shows a long relaxation time of 2 h. This means that once a finite strain is applied, the structures are easily ruptured exhibiting catastrophic failure, and therefore we observe a relatively short characteristic times (from minutes to hours) for the samples to yield or to fail.
4. Proposed molecular structure of bio-PEC gels
Below we propose a molecular structure of the HA/chitosan PEC gel. HA and chitosan chains form the double-stranded structure by the polyion complexation. From the molar mass and length of repeat units of individual HA and chitosan chains, the molar mass per unit length, m1, of the double-strand is about 700 g/mol·nm. For a solid filament, the persistent length lp increases markedly with their cross-section area A as lp~A2.37 Due to the charge mismatching, HA and chitosan chains bind loosely with each other, we can assume that the bending modulus of the double-strand is in the range of one or two times higher than the modulus of the individual strands. Therefore, the corresponding persistence length lp of the double-strand is in the range of 10 ~ 30 nm, one or two times larger than the persistence length of the individual chains.
From the entanglement modulus Ge = 2C2 ~ 46 kPa in Figure 3b, the number-average molar mass of the double-strand between the entanglement Me is ~ 1.5 × 10⁴ g/mol according to the relationship of flexible chain model Ge ≅ ϕρRT/Me,34 where ρ is the mean mass density of HA and chitosan (~ 1.67 g·cm−3), ϕ is the volume fraction of polymer (~ 0.17) that was determined from their weight fraction, R is the universal gas constant (= 8.314 J·K−1·mol−1) and T is the absolute temperature (= 300 K). Therefore, the corresponding contour length Le between entanglements is about ~ 20 nm, which is comparable to their persistence length (10 ~ 30 nm). Such result indicates that the double-strands between the entanglements behave as semi-flexible strands although the flexible chain model was used for the estimation of the structure. To verify whether or not the Le estimated from the flexible chain model makes sense, we further use a semi-flexible chain model to calculate the contour length Le between entanglements. For the semiflexible polymer network,38,39 the plateau modulus (≈ entanglement modulus) can be described as the function , where ρf is the filament line density calculated from the polymer weight fraction and molecular weight of double-strand to be 6.3 × 10¹⁵ m−2. The entanglement length Le of double-strand between the entanglements is estimated from the semiflexible chain model to be 6.8 ~ 14 nm, which is shorter than but not significantly different from the estimation based on the flexible chain model. The result confirmed that the double-strands of PEC gels behave as semi-flexible polymer chains that are subject to the topological (entanglements) on the length scale comparable to their persistence length.
Furthermore, the ratio of C2/C1 ~ 4 obtained from Figure 3b indicates the ratio of the contributions to gel modulus from entanglements and from strong cross-links that do not break at small strains. Note that the modulus of semiflexible gels scales with the contour length between cross-links as , a factor of 4 in modulus can come from a factor of 1.6 in their contour lengths.38,39 These structural parameters of HA/Chitosan hydrogels are summarized in Table 3.
Table 3.
Structural parameters of HA/Chitosan hydrogels. The parameters in the table are for double-strand of the polyion complexation.
| Molar mass per length, ml (g/mol. nm) a |
Persistence length, lp (nm) a |
Density ratio of entanglement to strong cross-links | Entanglement molecular weight, Me (g/mol) a |
Contour length between entanglements, Le (nm) a |
|---|---|---|---|---|
| 700 | 10 ~ 30 | ≈ 1 | 1.5×10⁴ b | 20 b |
| 4.8×10³ ~ 1.0×10⁴ c | 6.8 ~ 14 c |
double-strand chains;
From flexible chain model;
From semiflexible chain model.
Since the polymer chains are much longer than the entanglement length, each polymer chain associates with different oppositely charged chains, forming bridges between the double-strands. Such bridges correspond to the strong cross-links since they are held by the double-strands.
We propose a network structure of the HA/chitosan PEC hydrogel (see Figure 8) based on the above analysis. HA and chitosan form double-stranded semiflexible chains by charge binding. Each ionic bond between HA and chitosan chain is weak due to a mismatch in charge distance (d) between HA and chitosan. However, the probability to simultaneously break all of the bonds to separate the double-strand is very low because the rigidity of polysaccharide chains leads to cooperative ion bonding over the length scale of their persistence lengths. The long double-stranded chains are entangled with each other because they heavily overlap at high concentration of PEC gels with the contour length between the entanglements comparable to the persistence length of the double-strands. Besides, each polymer chain associates with different oppositely charged chains forming bridges between the double-strands. As a result, a continuous double-stranded network is formed. As the bridges connecting double-strands do not break without breaking of the double-strands, they serve as the strong cross-links that do not break at small strain.
Figure 8.

A simplified illustration representing the molecular structure of HA/Chitosan hydrogel: a double-stranded network of oppositely charged biopolymers. The entanglements between double-strands and chain exchanges (bridges indicated by grey arrows) serve as crosslinks, contributing to the modulus of the hydrogel. The blue and red lines represent oppositely charged chains.
This molecular picture can explain the experimentally observed unusual properties of bio-PEC gel: the gel is elastic-like only at small strains but softens and becomes plastic-like when the strain is above the yield strain. At a very small strain, the double-strands do not break but deforms and orients along the stretch direction, so the gel exhibits the strain-rate independent, elastic response. At higher strains, the double-strands are strongly oriented in the stretch direction. The unzipping of individual ionic bonds begins to dominate at these strains, causing propagation of the ionic bond dissociation and the flow of the sample. Such failure is initiated at the bridging sections of chains that bear large load after the orientation of the double-strands.
5. A comparison of synthetic and bio-PEC gels
The mechanical properties of the HA/chitosan hydrogel are very different from the PEC hydrogels form by oppositely charged vinyl-type polyelectrolytes. We distinguish two ways of preparing these synthetic vinyl-type PEC hydrogels: by mixing oppositely charged polyelectrolytes or by two-step polymerization - first of polymers with one sign of charges followed by polymerization of oppositely charged polymers. Our preliminary study has shown that the synthetic vinyl-type PEC hydrogels formed by simple mixing of oppositely charged polyelectrolytes exhibited essentially similar but slightly inferior mechanical strength to hydrogels formed by two-step polymerization.18–20 As the latter system is well studied, we compare below the HA/chitosan hydrogels with the synthetic PEC hydrogels from poly(3-(methacryloylamino)propyl-trimethylammonium chloride) (PMPTC) and poly(sodium p-styrenesulfonate) (PNaSS) formed by the two-step polymerization.18,20 The synthetic PEC hydrogels exhibit highly viscoelastic response even to the small tensile deformations over a wide range of applied strain rates. They also show yield with yield stress increasing with the strain rate, but the yield strain is almost independent of the applied strain rate. Furthermore, they sustain large deformation after yield and exhibit strong finite chain extensibility effects without any sign of flow at fracture. In addition, Young’s modulus and fracture stress of synthetic PEC hydrogels is ~ several MPa, and their fracture strain is 600% - 900%, which is much higher than the fracture strain of the biopolymer PEC gel presented above. These results indicate that the synthetic PEC hydrogels contain relatively weak ionic bonds that have very short lifetime that leads to higher viscoelasticity even before yield. These synthetic PEC hydrogels also contain relatively strong ionic bonds with very long lifetime that causes finite chain extensibility effect before rupture. The dynamic rheology in the frequency window of 10−6 rad/s - 106 rad/s exhibits a very broad tan δ relaxation peak in the range of 10−3 rad/s - 103 rad/s, indicating that the minimum lifetime of the ionic bonds is on the order of milliseconds.20 Due to the larger multivalent section of the size of persistence length, the HA/chitosan hydrogels have a relatively stronger multiple ionic bonds than the synthetic PECs. In the observation time window, the multiple ionic bonds of HA/chitosan hydrogels hold the double-strands together and do not relax, so that these gels behavior elastically below the yield stress. From the fact that the HA/chitosan gel does not exhibit finite chain extensibility effect before rupture, the tension to rupture these bonds is much lower than that in synthetic PEC hydrogels.
The difference in the mechanical behavior of synthetic and bio-PEC hydrogels is related to their structural differences. Using the same data analysis method as we utilized for the bio-PEC hydrogels, the structural parameters of individual PMPTC and PNaSS chains and of the corresponding double-strands in synthetic PEC gels20 were calculated and the results are summarized in Tables S1 and S2. The main structural difference is the charge density. The distance between the neighboring charged groups d in the synthetic vinyl-type homo polyelectrolytes, is about 0.25 nm,40 which is 4 and ~ 3 times higher than the charge density of HA and chitosan (Table 1),25,26 respectively. In addition, the same charge spacing of the two synthetic polyelectrolytes gives good charge matching, while the HA and chitosan have a charge density mismatch. Therefore, the linear density of the ionic bond of the bio-PEC gels is much lower than that of the synthetic PEC gels. Another structural difference is the persistence length lp. The persistence length lp of vinyl-type polyelectrolytes is ~ 1 nm, while lp of HA is in the range of 5.3 ~ 11.5 nm27,28 and for chitosan it is in the range of 4 ~ 15 nm29–31 in dilute high salt solutions. The upper bound of multiple bonds strength is related to the ratio of persistence length to the distance between neighboring charged groups.41 This ratio is ~ 4 in the synthetic PEC gels (1 nm/ 0.25 nm) and is 4 ~ 15 in the bio-PEC gels (4 nm/1.0 nm ~ 15 nm/1.0 nm). In principle, this ratio could be 4 times larger in bio-PEC gels in comparison to synthetic PEC gels. Thus, to separate oppositely charged sections, one needs to simultaneously break several ionic bonds, making the strength of the whole persistence length section (rather than of the individual ionic bond) higher in bio-PEC gels. Although the ratio of bonds strengths is likely to be overestimated due to the charge mismatch in the bio-PEC gels, the shortest lifetime of multiple bonds in the current biopolymer system could be significantly longer than that in the vinyl-type polyelectrolyte systems. Therefore, the longer persistence length of the HA/chitosan gel overcompensates the lower density of ionic bonds along the double-strands of these biopolymers resulting in the higher strength of the multiple ionic bonds than that of the vinyl-type polyelectrolytes.
This explains why the synthetic PEC gels do not possess purely elastic region while the bio-PEC gels do. The strong strain rate dependence even below the yield point of synthetic PEC gels comes from their weak ionic bond strength (or short bond lifetime) in comparison with that of the bio-PEC gels.
From the structural parameters of double-strands, we found that the contour length between entanglements in the vinyl-type PEC gels is ~ 41 nm (see Table S2), which is about 20 times longer than the persistence length of the double-strands, indicating that the double-strand chains in synthetic PEC gels behave as flexible chains that can be deformed. This property is very different from the deformability of the bio-PEC semi-flexible double-strands that can be easily orientated along the stretch direction but are ruptured by a relatively small yield stress due to charge mismatch. The above results suggest that the ionic bond density is related to the charge density while the ionic bond strength is related to the ratio of persistence length to the spacing between neighboring charges along the chain.
Reversibility was also observed in recent experiments of layer-by-layer deposition of polyelectrolytes with lower charge density.42
6. Conclusions
The chitosan and sodium hyaluronate form mechanically stable polyelectrolyte complex hydrogels containing 75 wt% water near their charge balance composition. The hydrogels change their behavior from brittle to ductile with increasing strain rate. They exhibit quasi-elastic behavior at small strains (< 20%) independent of the strain rate in the interval from 1.4 ×10⁻² s−1 to 6.9 ×10⁻¹ s−1 as measured by tensile tests. Furthermore, these hydrogels exhibit plastic-like behavior above the yield point that increases with the strain rate. The transformation between quasi-elastic and plastic-like properties depends on not only the applied strain and strain rate but also on the waiting period needed for the broken structure to recover. The hydrogels showed delayed fracture under step strain, which was accelerated for the increased strain. This behavior is qualitatively different from that of polyelectrolyte complex hydrogels from synthetic polymers.18,20 The unique features of the biopolymer hydrogels are likely due to the rigidity of the polysaccharide molecules and the large charge mismatch between the oppositely charged biopolymers. The double-stranded complexes of HA and chitosan form semi-flexible network structures by entanglements and chain exchanges/bridges between double-strands.
Supplementary Material
ACKNOWLEDGEMENTS
This research was financially supported by Grant-in-Aid for Scientific Research (S) (No. 17H06144) from the Japan Society for the Promotion of Science (JSPS). Institute for Chemical Reaction Design and Discovery (ICRD) was established by World Premier International Research Initiative (WPI), MEXT, Japan. This research was also supported by the World Premier International Research Center Initiative (WPI). R. S. would like to thank the financial support of China Scholarship Council (No. 201406060092) for her study in Japan. T. L. S. grateful for the support of the Fundamental Research Funds for the Central Universities (2018ZD14). M. R. would like to acknowledge financial support from the National Science Foundation under grants DMR-1436201, and DMR-1121107, the National Institutes of Health under grants P01-HL108808, R01-HL136961, and 1UH2HL123645, and the Cystic Fibrosis Foundation. JPG would like to thank Zhen Tao for her help to draw the illustration of the double-strand hydrogel structure.
Footnotes
The authors declare no competing financial interest.
Supporting Information
The Supporting Information is available free of charge on the ACS Publications website.
Figure S1 shows the dependence of yield stress on yield strain. Figure S2 shows the determination of time to failure from stretching time dependence of reduced stress at a strain rate of 0.014 s−1. Figure S3 exhibits the dependence of yield strain εy and failure strain εf on strain rate . Table S1 and S2 show the structure parameters of individual chains and double-strands in synthetic polyelectrolytes systems. Movies S1 and S2 demonstrate tensile tests at strain rates 0.014 s−1 and 0.69 s−1, respectively. Movie S3 shows stretching of the hydrogel by hand. Movies S4 and S5 present the stress relaxation tests at step strains 0.2 and 0.5, respectively.
REFERENCES
- (1).Drury JL; Mooney DJ Hydrogels for Tissue Engineering: Scaffold Design Variables and Applications. Biomaterials 2003, 24 (24), 4337–4351. [DOI] [PubMed] [Google Scholar]
- (2).Gong JP; Katsuyama Y; Kurokawa T; Osada Y Double-Network Hydrogels with Extremely High Mechanical Strength. Adv. Mater 2003, 15 (14), 1155–1158. [Google Scholar]
- (3).Haraguchi K; Takehisa T Nanocomposite Hydrogels: A Unique Organic-Inorganic Network Structure with Extraordinary Mechanical, Optical, and Swelling/De-Swelling Properties. Adv. Mater 2002, 14 (16), 1120–1124. [Google Scholar]
- (4).Huang T; Xu H; Jiao K; Zhu L; Brown HR; Wang H A Novel Hydrogel with High Mechanical Strength: A Macromolecular Microsphere Composite Hydrogel. Adv. Mater 2007, 19 (12), 1622–1626. [Google Scholar]
- (5).Okumura Y; Ito K The Polyrotaxane Gel: A Topological Gel by Figure-of-Eight Cross-Links. Adv. Mater 2001, 13 (7), 485–487. [Google Scholar]
- (6).Naficy S; Brown HR; Razal JM; Spinks GM; Whitten PG Progress toward Robust Polymer Hydrogels. Aust. J. Chem 2011, 64 (8), 1007–1025. [Google Scholar]
- (7).Singh A; Peppas NA Hydrogels and Scaffolds for Immunomodulation. Adv. Mater 2014, 26 (38), 6530–6541. [DOI] [PMC free article] [PubMed] [Google Scholar]
- (8).Appel EA; Loh XJ; Jones ST; Biedermann F; Dreiss CA; Scherman OA Ultrahigh-Water-Content Supramolecular Hydrogels Exhibiting Multistimuli Responsiveness. J. Am. Chem. Soc 2012, 134 (28), 11767–11773. [DOI] [PubMed] [Google Scholar]
- (9).Sun TL; Kurokawa T; Kuroda S; Ihsan AB; Akasaki T; Sato K; Haque MA; Nakajima T; Gong JP Physical Hydrogels Composed of Polyampholytes Demonstrate High Toughness and Viscoelasticity. Nat. Mater 2013, 12 (10), 932–937. [DOI] [PubMed] [Google Scholar]
- (10).Sun TL; Luo F; Kurokawa T; Karobi SN; Nakajima T; Gong JP Molecular Structure of Self-Healing Polyampholyte Hydrogels Analyzed from Tensile Behaviors. Soft Matter 2015, 11 (48), 9355–9366. [DOI] [PubMed] [Google Scholar]
- (11).Sun TL; Luo F; Hong W; Cui K; Huang Y; Zhang HJ; King DR; Kurokawa T; Nakajima T; Gong JP Bulk Energy Dissipation Mechanism for the Fracture of Tough and Self-Healing Hydrogels. Macromolecules 2017, 50 (7), 2923–2931. [Google Scholar]
- (12).Cui K; Sun TL; Kurokawa T; Nakajima T; Nonoyama T; Chen L; Gong JP Stretching-Induced Ion Complexation in Physical Polyampholyte Hydrogels. Soft Matter 2016, 12, 8833–8840. [DOI] [PubMed] [Google Scholar]
- (13).Ihsan AB; Sun TL; Kuroda S; Haque MA; Kurokawa T; Nakajima T; Gong JP A Phase Diagram of Neutral Polyampholyte - from Solution to Tough Hydrogel. J. Mater. Chem. B 2013, 1 (36), 4555–4562. [DOI] [PubMed] [Google Scholar]
- (14).Ihsan AB; Sun TL; Kurokawa T; Karobi SN; Nakajima T; Nonoyama T; Roy CK; Luo F; Gong JP Self-Healing Behaviors of Tough Polyampholyte Hydrogels. Macromolecules 2016, 49 (11), 4245–4252. [Google Scholar]
- (15).Karobi SN; Sun TL; Kurokawa T; Luo F; Nakajima T; Nonoyama T; Gong JP Creep Behavior and Delayed Fracture of Tough Polyampholyte Hydrogels by Tensile Test. Macromolecules 2016, 49 (15), 5630–5636. [Google Scholar]
- (16).Luo F; Sun TL; Nakajima T; Kurokawa T; Zhao Y; Ihsan A. Bin; Guo HL; Li XF; Gong JP Crack Blunting and Advancing Behaviors of Tough and Self-Healing Polyampholyte Hydrogel . Macromolecules 2014, 47 (17), 6037–6046. [Google Scholar]
- (17).Kabanov VA; Zezin, A. B. A New Class of Complex Water-Soluble Polyelectrolytes. Macromol. Chem. Phys 1984, 6 (6), 259–276. [Google Scholar]
- (18).Luo F; Sun TL; Nakajima T; Kurokawa T; Zhao Y; Sato K; Ihsan AB; Li X; Guo H; Gong JP Oppositely Charged Polyelectrolytes Form Tough, Self-Healing, and Rebuildable Hydrogels. Adv. Mater 2015, 27 (17), 2722–2727. [DOI] [PubMed] [Google Scholar]
- (19).Luo F; Sun TL; Nakajima T; Kurokawa T; Ihsan A. Bin; Li X; Guo H; Gong JP Free Reprocessability of Tough and Self-Healing Hydrogels Based on Polyion Complex. ACS Macro Lett. 2015, 4 (9), 961–964. [DOI] [PubMed] [Google Scholar]
- (20).Luo F; Sun TL; Nakajima T; King DR; Kurokawa T; Zhao Y; Ihsan AB; Li X; Guo H; Gong JP Strong and Tough Polyion-Complex Hydrogels from Oppositely Charged Polyelectrolytes: A Comparative Study with Polyampholyte Hydrogels. Macromolecules 2016, 49 (7), 2750–2760. [Google Scholar]
- (21).de Kruif CG; Weinbreck F; de Vries R Complex Coacervation of Proteins and Anionic Polysaccharides. Curr. Opin. Colloid Interface Sci. 2004, 9 (5), 340–349. [Google Scholar]
- (22).Biesheuvel PM; Stuart MAC Electrostatic Free Energy of Weakly Charged Macromolecules in Solution and Intermacromolecular Complexes Consisting of Oppositely Charged Polymers. Langmuir 2004, 20 (7), 2785–2791. [DOI] [PubMed] [Google Scholar]
- (23).Haynie DT; Balkundi S; Palath N; Chakravarthula K; Dave K Polypeptide Multilayer Films: Role of Molecular Structure and Charge. Langmuir 2004, 20 (11), 4540–4547. [DOI] [PubMed] [Google Scholar]
- (24).Gössl I; Shu L; Schlüter AD; Rabe JP Molecular Structure of Single DNA Complexes with Positively Charged Dendronized Polymers. J. Am. Chem. Soc 2002, 124 (24), 6860–6865. [DOI] [PubMed] [Google Scholar]
- (25).Atkins EDT; Phelps CF; Sheehan JK The Conformation of the Mucopolysaccharides. Hyaluronates. Biochem. J 1972, 128 (5), 1255–1263. [DOI] [PMC free article] [PubMed] [Google Scholar]
- (26).Okuyama K; Noguchi K; Miyazawa T; Yui T; Ogawa K Molecular and Crystal Structure of Hydrated Chitosan. Macromolecules 1997, 30 (19), 5849–5855. [Google Scholar]
- (27).Cleland RL The Persistence Length of Hyaluronic Acid : An Estimate from Small- Angle X-Ray Scattering and Intrinsic Viscosity. Arch. Biochem. Biophys 1977, 180 (1), 57–68. [DOI] [PubMed] [Google Scholar]
- (28).Buhler E; Boue F Chain Persistence Length and Structure in Hyaluronan Solutions : Ionic Strength Dependence for a Model Semirigid Polyelectrolyte. Macromolecules 2004, 37 (4), 1600–1610. [Google Scholar]
- (29).Schatz C; Viton C; Delair T; Pichot C; Domard A Typical Physicochemical Behaviors of Chitosan in Aqueous Solution. Biomacromolecules 2003, 4 (3), 641–648. [DOI] [PubMed] [Google Scholar]
- (30).Berth G; Dautzenbergb H; Peter MG Physico-Chemical Characterization of Chitosans Varying in Degree of Acetylation. Carbohyd. Polym 1998, 36, 205–216. [Google Scholar]
- (31).Brugnerotto J; Desbrières J; Roberts G; Rinaudo M Characterization of Chitosan by Steric Exclusion Chromatography. Polymer 2001, 42, 9921–9927. [Google Scholar]
- (32).Wang QZ; Chen XG; Liu N; Wang SX; Liu CS; Meng XH; Liu CG Protonation Constants of Chitosan with Different Molecular Weight and Degree of Deacetylation. Carbohydr. Polym 2006, 65 (2), 194–201. [Google Scholar]
- (33).Lequeux I; Ducasse E; Jouenne T; Thebault P Addition of Antimicrobial Properties to Hyaluronic Acid by Grafting of Antimicrobial Peptide. Eur. Polym. J 2014, 51, 182–190. [Google Scholar]
- (34).Rubinstein M; Colby RH Polymer Physics; Oxford University Press Inc.: New York, 2003. [Google Scholar]
- (35).Long R; Mayumi K; Creton C; Narita T; Hui CY Time Dependent Behavior of a Dual Cross-Link Self-Healing Gel: Theory and Experiments. Macromolecules 2014, 47 (20), 7243–7250. [Google Scholar]
- (36).Stukalin EB; Cai LH; Kumar NA; Leibler L; Rubinstein M Self-Healing of Unentangled Polymer Networks with Reversible Bonds. Macromolecules 2013, 46 (18), 7525–7541. [DOI] [PMC free article] [PubMed] [Google Scholar]
- (37).Daniel WFM; Burdyńska J; Vatankhah-Varnoosfaderani M; Matyjaszewski K; Paturej J; Rubinstein M; Dobrynin AV; Sheiko SS Solvent-Free, Supersoft and Superelastic Bottlebrush Melts and Networks. Nat. Mater 2016, 15 (2), 183–189. [DOI] [PubMed] [Google Scholar]
- (38).Gittes F; MacKintosh FC Dynamic Shear Modulus of a Semiflexible Polymer Network. Phys. Rev. E 1998, 58 (2), R1241–R1244. [Google Scholar]
- (39).Yao NY; Broedersz CP; Lin Y; Kasza KE; MacKintosh FC; Weitz DA Elasticity in Ionically Cross-Linked Neurofilament Networks. Biophys. J 2010, 98 (10), 2147–2153. [DOI] [PMC free article] [PubMed] [Google Scholar]
- (40).Choi CH; Kertesz M Consistencies between Experiments and Quantum Calculations of Strained C – C Single Bond Lengths. Chem. Commun . 1997, 22, 2199–2200. [Google Scholar]
- (41).Ullner M; Jӧnsson B; Peterson C; Sommelius O; Sӧderberg B The Electrostatic Persistence Length Calculated from Monte Carlo, Variational and Perturbation Methods. J. Chem. Phys 1997, 107 (4), 1279–1287. [Google Scholar]
- (42).Han B; Chery DR; Yin J; Lu XL; Lee D; Han L Nanomechanics of Layer-by-Layer Polyelectrolyte Complexes: A Manifestation of Ionic Cross-Links and Fixed Charges. Soft Matter 2016, 12 (4), 1158–1169. [DOI] [PubMed] [Google Scholar]
Associated Data
This section collects any data citations, data availability statements, or supplementary materials included in this article.