. 2019 Feb 25;8:e42135. doi: 10.7554/eLife.42135

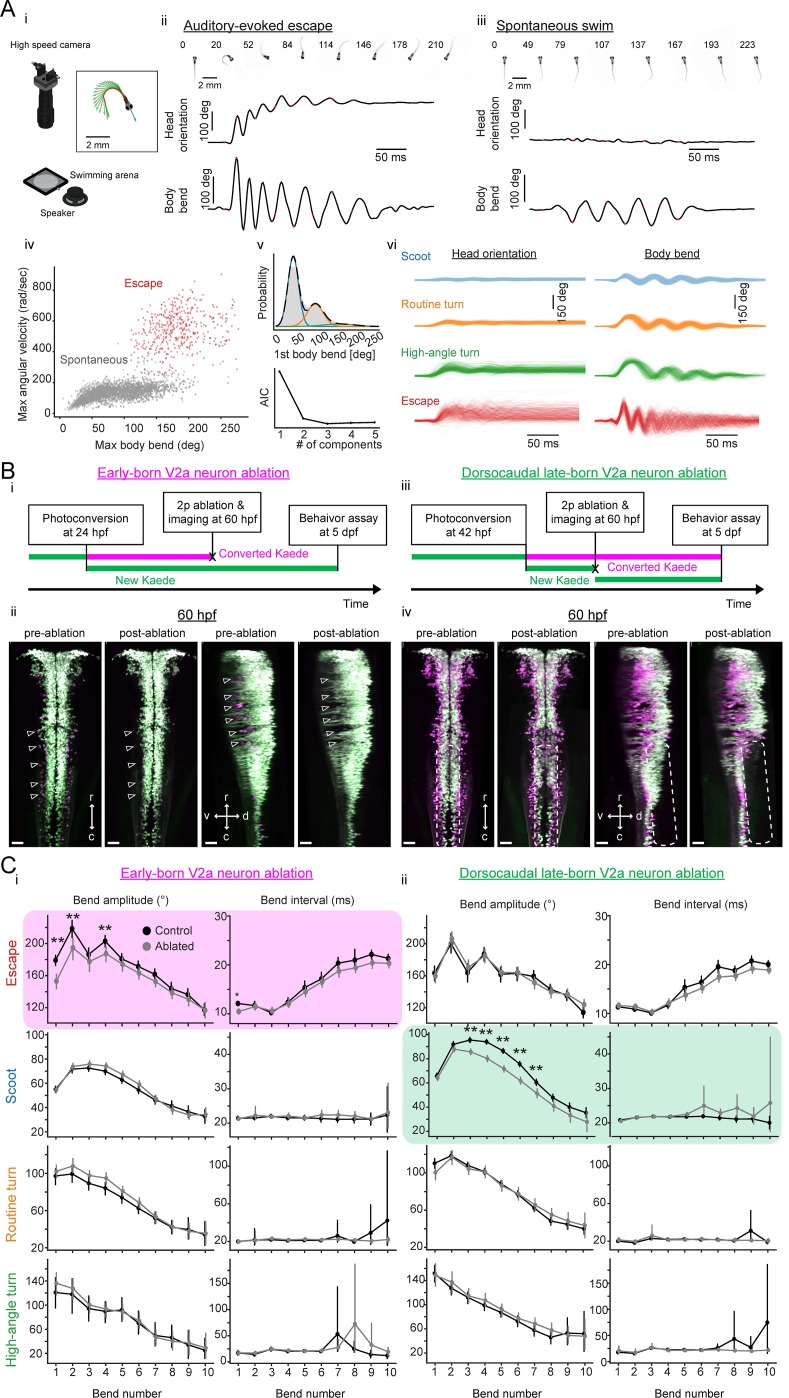
Figure 10. Contributions of hindbrain V2a neurons to evoked and spontaneous locomotion.

(A) Examined locomotion patterns. (i) Experimental setup. (inset) Example fish image showing tracking of head orientation and tail curvature (see Materials and methods). Blue arrow, head orientation; Red dots, tracked midline points; Green arrows, tangent vectors along the midline points. (ii) Auditory-evoked escape response. (Top row) Images of fish during escape response. The number on each the images is time from the stimulus onset in milliseconds. (Middle row) Time course of head orientation. (Bottom row) Time course of total body bend (see Materials and methods). (iii) Spontaneous swimming. Panels are organized similarly to ii but the number on each image is time from the movement onset in milliseconds. (iv) Scatter plot of maximum bend amplitude (during a swim episode) and maximum angular velocity for auditory-evoked escapes (n = 426 episodes, N = 10 fish, red points) and spontaneous swims (n = 6088 episodes, N = 15 fish, gray points). (v) (Top) Probability of initial bend amplitude for 6056 spontaneous swim events. A fit of gaussian mixture model identified three components. (Bottom) The Akaike information criterion (AIC) as a function of number of components. Three components led to the lowest AIC value. (vi) Overlaid traces of head orientation and total body bend for three identified spontaneous swim categories (Scoot, 3969 episodes, blue; Routine turn, 1565 episodes, orange; High-angle turn, 376 episodes, green) and auditory-evoked escape (Escapes, 381 episodes, red). (B) Femtosecond laser ablation of hindbrain V2a neurons. (i) Experimental procedure for the ablation of early-born V2a neurons. (ii) Maximum intensity projections before and after ablation at 60 hpf (left, dorsal view; right, side view). White open arrowheads indicate the locations of the early-born V2a neurons.(iii) Experimental procedure for the ablation of dorsocaudal late-born V2a neurons. (iv) Maximum intensity projections before and after ablation at 60 hpf (left, dorsal view; right, side view). White rounded rectangles indicate the location of the late-born dorsocaudal V2a neurons. r, rostral; c, caudal; d, dorsal; v ventral; scale bars, 30 μm. (C) Effects of hindbrain V2a neuron ablations on the bend amplitudes and periods (or intervals) of the four distinct locomotion patterns. (i) Effects of the early-born V2a neuron ablation. Bend amplitude and interval are quantified bend-by-bend from 1st bend to 10th bend (see Materials and methods). Asterisks mark significant differences between ablated and control fish (**p<0.01, corrected for multiple comparisons, Holm test). Error bars, 99 percent confidence interval. The swim category that showed significant effects are highlighted in magenta. (ii) Effects of the late-born dorsocaudal V2a neuron ablation. Panels are organized as in i. The swim category that showed significant effects are highlighted in green.

Figure 10—source data 1. Contains numerical data plotted in Figure 10C.
DOI: 10.7554/eLife.42135.035

Figure 10.

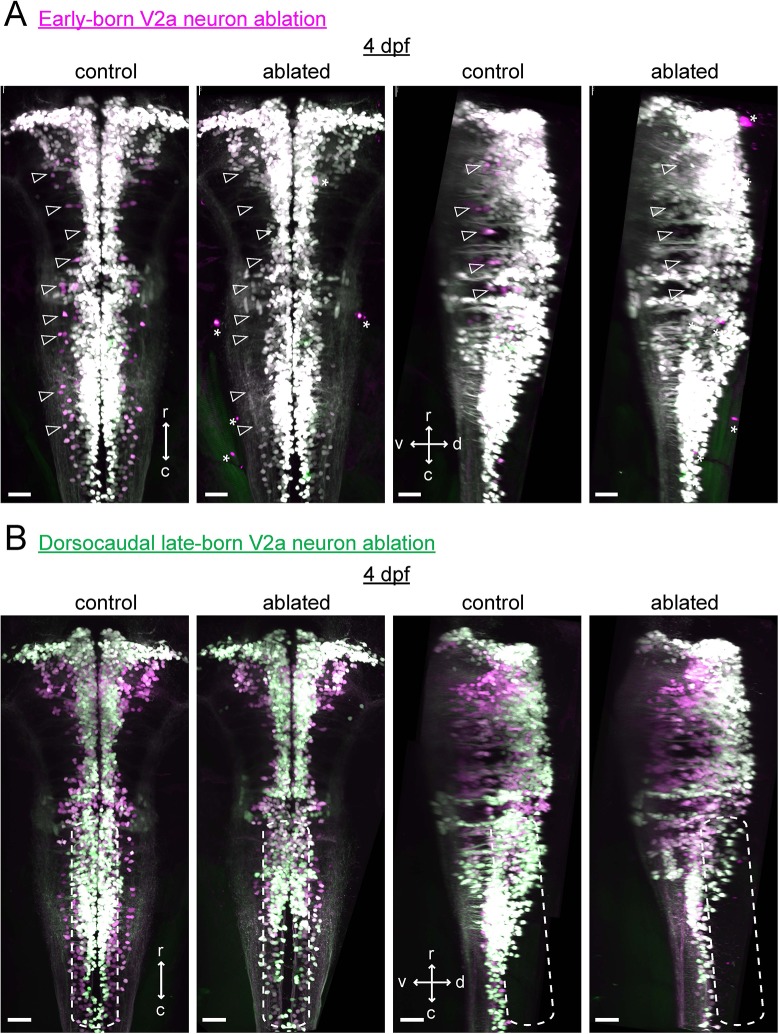
Figure 10—figure supplement 1. Confirmation of hindbrain V2a neuron ablations at four dpf.

Figure 10—figure supplement 1.

(A) Maximum intensity projections of hindbrain V2a neurons expressing Kaede from a fish in which early-born neurons were ablated (see Figure 11B i-ii) as well as from a control fish at four dpf (left, dorsal view; right, side view; magenta, photoconverted Kaede; green, unconverted Kaede). Contrast of magenta channel was enhanced to improve the visibility of early-born neurons, which made late-born neurons appear white. Open arrowheads indicate locations of early-born neurons (magenta). Note the lack of magenta cells in the ablated fish. Asterisks mark the bright structures in the red channel located outside the brain. r, rostral; c, caudal; d, dorsal; v ventral; scale bars, 30 μm. (B) Maximum intensity projections of hindbrain V2a neurons from a fish in which dorsocaudal late-born neurons were ablated (see Figure 11B iii-iv) as well as a control fish at four dpf (left, dorsal view; right, side view; magenta, photoconverted Kaede; green, unconverted Kaede). Rounded dotted rectangle in each image indicates the location of neurons that were targeted in the ablated fish. r, rostral; c, caudal; d, dorsal; v ventral; scale bars, 30 μm.
Figure 10—figure supplement 2. Effects of age-specific ablations of hindbrain V2a neurons on global swim parameters.

Figure 10—figure supplement 2.

(A) Box plot displays of global swim parameters extracted from the early-born V2a ablation group and the corresponding control group. Boxes extend from the first to the third quartile range, the horizontal line through the box shows the median and the whiskers span the range of the data. The color of each box as well as the position of the box along the x-axis identifies the swim category (Blue = Scoot, Orange = Routine turn, Green = High angle turn, Red = Escape), while the opacity of the box distinguishes the control (more opaque) and ablated groups (less opaque). In order, from top to bottom the box plot panels display the following swim parameters: total swim distance per episode, mean swim velocity per episode, maximum swim velocity per episode (y-axis in log scale), episode duration, total number of bends per episode, and onset latency (for escapes only). (B) Box plot displays of global swim parameters extracted from the dorsocaudal late-born V2a ablation group and the corresponding control group. The figures are arranged as in A. Double asterisks denote statistical significance at p<0.01 (corrected for multiple comparisons, Holm test) while single asterisks denote significance at p<0.05.
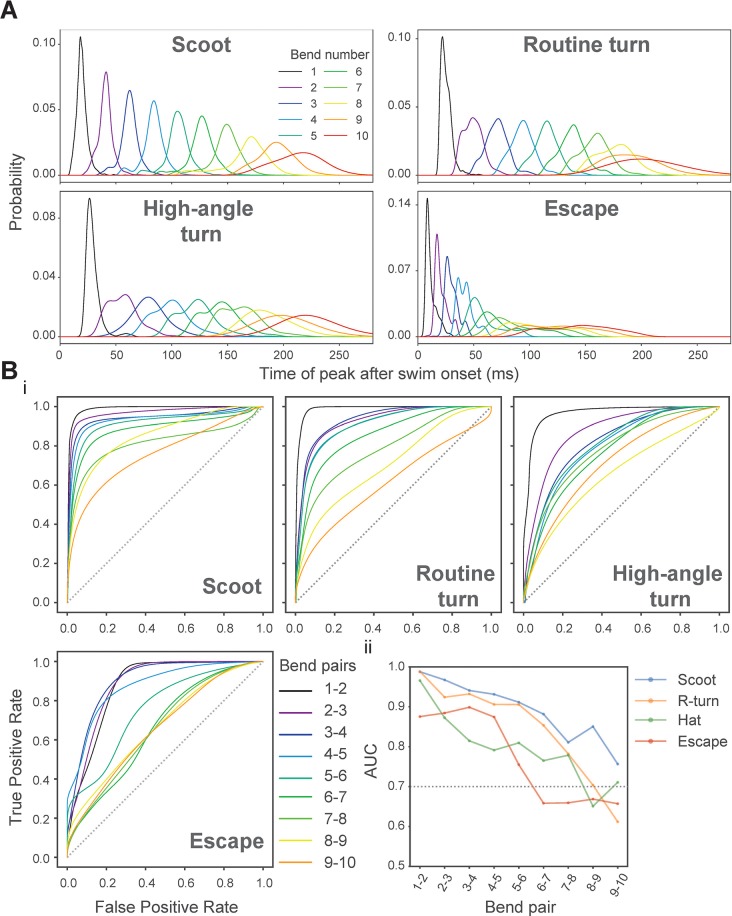
Figure 10—figure supplement 3. Criteria used to limit analyses of body bend amplitudes and periods to the first 10 bends of an episode for all swim categories.

Figure 10—figure supplement 3.

(A) Probability distributions of peak times for the first 10 body bends within episodes of different swim types. Peak time for a given bend refers to the time elapsed from the onset of the episode to the time when that bend reaches peak amplitude. The probability distributions corresponding to different numbered bends are displayed in different colors to illustrate the variability in their peak times, and therefore, the separability of any two adjacent bends. For each swim type, the overall trend is apparent - the separability of adjacent bends with respect to their peak times suffers as bend numbers increase. For escapes, the separability undergoes a large drop in going from bend numbers 5 to 6 and then from bend number 6 to bend number 7. (B) (i) ROC analysis (see Materials and methods) used to assess the separability of pairs of adjacent bends based on their peak time distributions. This analysis was carried out separately for all the different swim types and for up to the first 10 bends within an episode. The ROC curves generated for different pairs of consecutive bends are displayed using different colors to visually illustrate how the area under the curve (AUC), and therefore discriminability, changes for each successive bend pair. The dashed diagonal line (gray) is the unit slope line, for which the AUC is 0.5. (ii) AUCs computed from the ROCs shown in i are plotted as function of the bend-pair compared. The dotted horizontal line (gray) corresponds to AUC of 0.7, which served as a soft threshold for considering whether or not to include a given bend for further analysis.
Figure 10—figure supplement 4. Probability distributions of the first body bend amplitude of spontaneous swim events in the ablated and control groups.

Figure 10—figure supplement 4.

Blue, the early-born neurons ablation group (24 hpf phoconversion, 10 fish, 1156 episodes); orange, the late-born neurons ablation group (42 hpf photoconversion, 10 fish, 1067 episodes); green, the early-born neurons control group (24 hpf photoconversion, eight fish, 2195 episodes); red, the late-born neurons control group (42 hpf photoconversion, eight fish, 1475 episodes); purple, unconverted control group (15 fish, 1175 episodes).
Figure 10—figure supplement 5. Overlaid traces of body bend during scoot in the ablated and control groups.
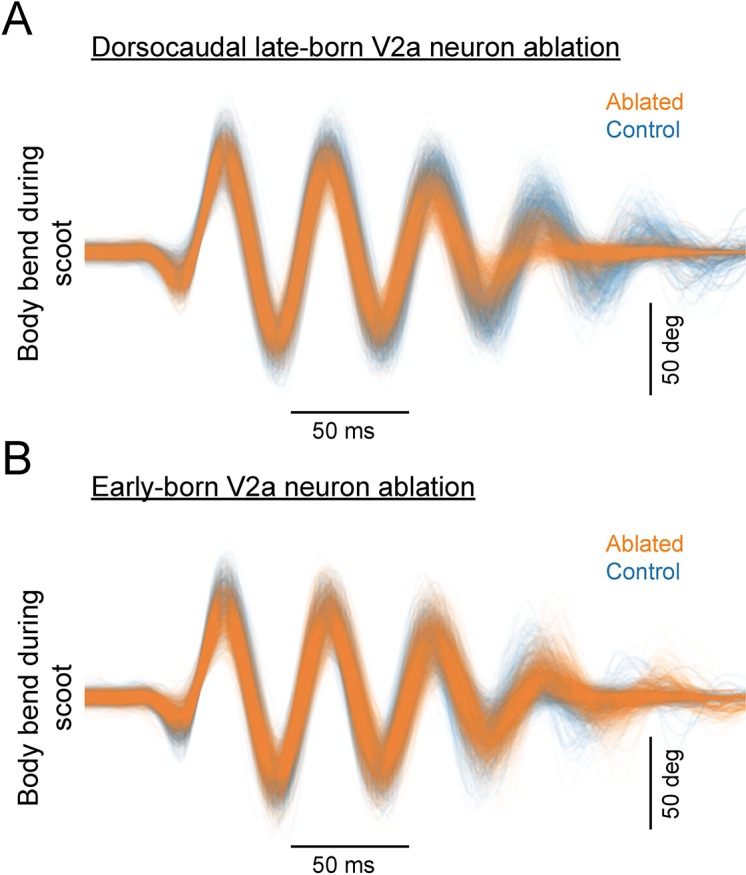
Figure 10—figure supplement 5.

(A) Overlaid traces of body bend during scoot in the dorsocaudal late-born V2a neuron ablation group and the corresponding control group. Orange, ablated (10 fish, 853 episodes); Blue, control (eight fish, 901 episodes). (B) Overlaid traces of body bend during scoot in the early-born V2a neuron ablation group and the corresponding control group. Orange, ablated (10 fish, 815 episodes); Blue, control (eight fish, 791 episodes).