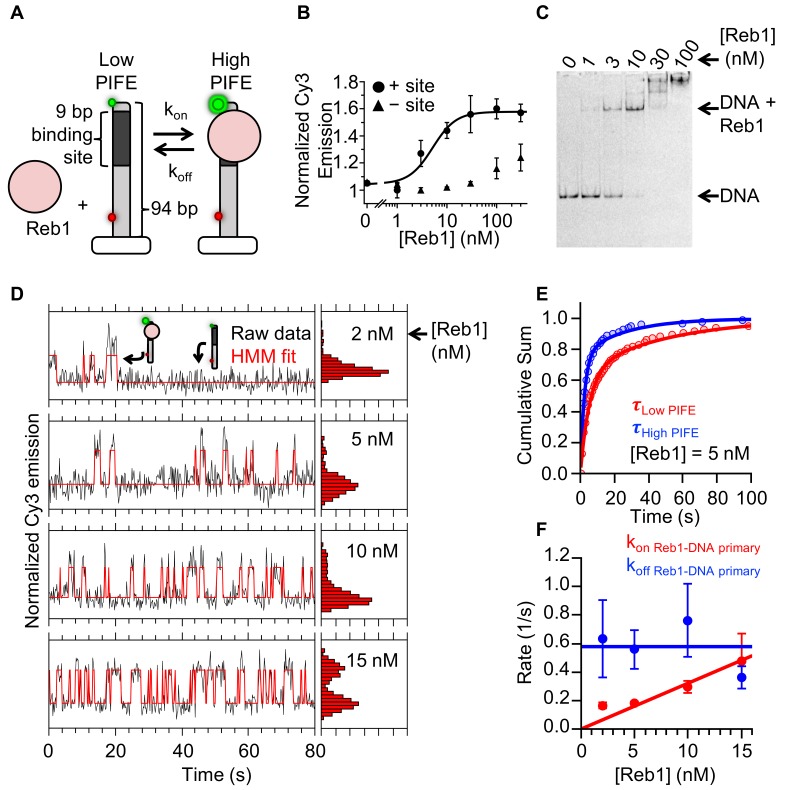
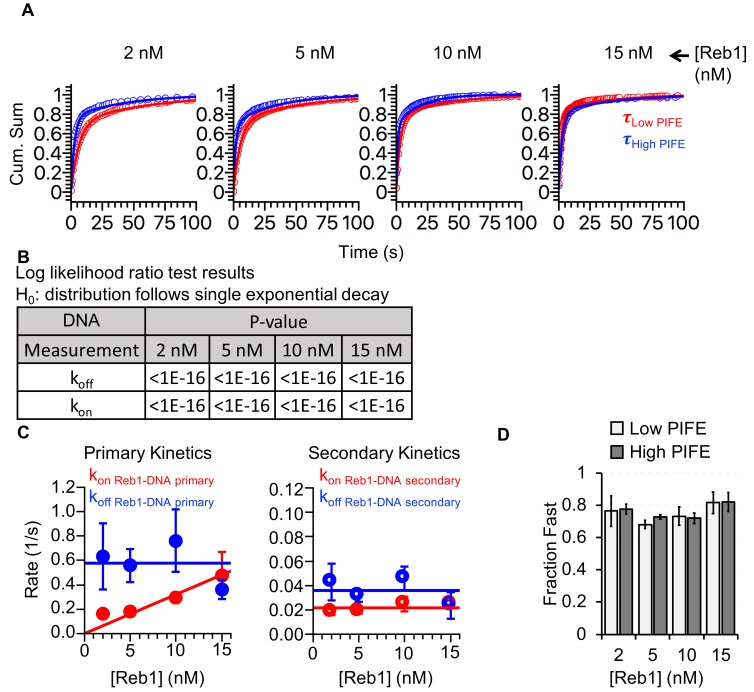
Figure 3. Reb1 rapidly binds to and dissociates from fully exposed DNA-binding sites.
(A) Design of the smPIFE measurements. The 94-bp DNA molecule with the Reb1-binding site 1 bp from the Cy3-labeled 5′ end was immobilized on a quartz surface through a biotin–streptavidin linkage. DNA molecules are also Cy5-labeled, and we only analyzed molecules with signals in both Cy3 and Cy5. (B) Reb1 titration with the smPIFE DNA results in a Cy3 emission increase of ~1.5-fold and fits to a binding isotherm with an S1/2 Reb1–DNA PIFE = 5.1 ± 0.2 nM. Without the binding site, the Cy3 emission does not change until 100 nM, demonstrating that the observed PIFE is due to site-specific Reb1 binding. (C) Cy3 image of the EMSA of Reb1 binding to the smPIFE DNA molecule. Reb1 binding is similar to that observed for the 25 bp DNA molecule (S1/2 Reb1–DNA EMSA = 3.4 ± 0.1 nM). (D) Example time traces of single DNA molecules with four separate Reb1 concentrations, where the black lines are the Cy3 fluorescence and the red lines are the two-state Hidden Markov Model (HMM) fits. As the Reb1 concentration increases, the immobilized DNA molecules shift to the high PIFE state. (E) Example cumulative sums of low PIFE (red) and high PIFE (blue) dwell times that are fit with double exponentials. The Reb1 concentration is 5 nM. (F) The primary Reb1–DNA binding (red) and dissociation (blue) rates at four Reb1 concentrations. The dissociation rates are constant with an average rate of koff Reb1–DNA primary = 0.58 ± 0.08 s−1, while the binding rate increases with Reb1 concentration. The overall binding rate is determined by fitting to a line whose slope represents the binding rate, kon Reb1–DNA primary = 0.032 ± 0.003 s−1 nM−1.


