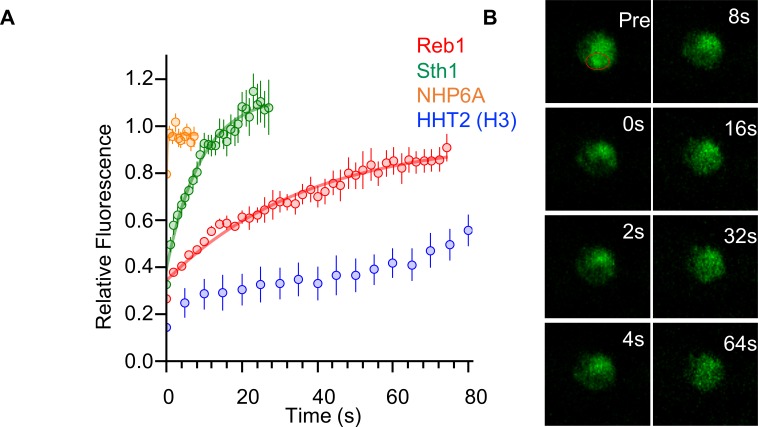
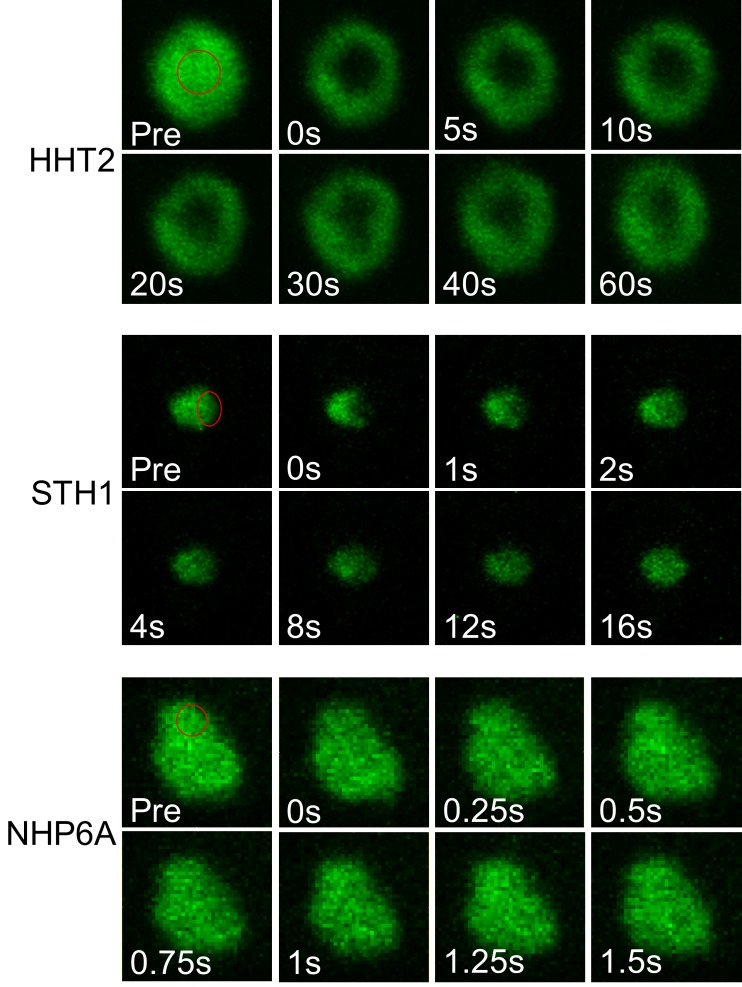
Figure 7. Reb1 slowly exchanges in vivo.
(A) Recovery curves for Reb1 (red), HHT2 (Blue), Sth1 (green), and NHP6A (orange) after photobleaching. Reb1 τ1/2 = 25.8 ± 2.5 s, Sth1 τ1/2 = 7.8 ± 0.7 s, NHP6A τ1/2 = 0.2 ± 0.1 s. (B) Fluorescence images of GFP-labeled Reb1 during a FRAP experiment. The bleached region is indicated with a red circle.


