Abstract
Drying is an important unit operation in the manufacturing of polymer strip films as it affects various film quality attributes. Optimal design and control of convective drying process require models that capture the impact of critical process parameters such as air temperature and velocity on the temporal evolution of film thickness and moisture. Here, a detailed transport model was presented to capture moisture diffusion, heat transfer and moving boundary in convective drying of polymer strip films loaded with griseofulvin (GF), a poorly water-soluble drug. It incorporates a solvent diffusivity model based on free-volume theory. Experimentally, film precursor suspensions were prepared by mixing silica-coated and micronized GF powder with an aqueous solution of hydroxypropyl methylcellulose (HPMC)–glycerin. Films were cast and moisture–time variation during drying was measured. The transport model, whose diffusivity parameters were estimated using drying data at a reference condition, was validated at different drying conditions and wet film thicknesses. It delineates underlying mechanisms of drying kinetics and demarcates a smooth transition from constant-rate to falling-rate period. Overall, our results suggest that the transport model is capable of predicting the temporal evolution of moisture and final film thickness at different drying air velocities and temperatures with reasonable accuracy.
Keywords: Polymer strip film, Convective drying, Poorly water-soluble drug, Transport model
Graphical Abstract
1. Introduction
Polymer strip films are flexible platforms for oral delivery of drugs. They could be advantageous compared to the traditional solid dosage forms especially for drug delivery to the geriatric, pediatric, and dysphagic population [1,2]. These films are extensively used as a delivery form for water-soluble drugs but they can be promising candidates for the delivery of poorly water-soluble drugs, which attracted attention in recent years [3–5]. The incorporation of drug nanoparticles in strip films through slurry casting has achieved excellent content uniformity and fast drug release, which are two important critical quality attributes (CQAs) of the films [3–6]. This method also ensures good mechanical properties of the strip films [6]. A recent development in the film preparation method is the use of simultaneously dry coated–micronized poorly water-soluble drugs in strip films [7]. In this method, drug particles are coated with hydrophilic silica and micronized in a fluid energy mill. Silica coating improves the flow properties and prevents the agglomeration of micronized drug particles. The resulting powder is added to a film-forming polymer solution directly, thus avoiding the issues associated with wet media milling used for the preparation of drug nanosuspensions. The viscous film precursor suspension is cast and the resulting wet films are dried to obtain the desired film thickness and remove the excess moisture. The resulting strip films have desirable CQAs such as acceptable drug content uniformity and fast drug release [7].
Drying is an important unit operation in the manufacturing process of strip films as it has significant impact on various film quality attributes such as moisture content, morphology and mechanical properties, which in turn can impact downstream processability and packaging operations as well as drug assay and dissolution performance [6,8]. Low moisture content is required to ensure long-term stability, avoid degradation and preserve the processing properties of solid dosage forms [8]. Fast drying and gentle process conditions are necessary to ensure quality films with the desired moisture content and thickness [6]. Hence, developing a model to predict moisture-time evolution and final film thickness is the first step towards optimal design and control of the drying process.
Solvent removal during convective drying of polymer films consists of two periods: constant-rate and falling-rate periods [9]. The first period is controlled by the external mass transfer, which depends on the air flow condition and physicochemical properties of the system. The second period is controlled by the intra-film diffusion process. Most of the drying models presented in the literature for drug-loaded films are empirical or semi-empirical and do not completely capture the underlying physics [6,10,11]. In our previous work, we addressed the shortcomings of a semi-empirical model for convective drying of drug-loaded films [10]. This type of model is only applicable to a certain drying condition (air temperature and velocity) and does not predict the dried film thickness. A predictive model should capture external and intra-film transport processes as well as the shrinkage of the film as solvent evaporates. It should also predict the time evolution of moisture content and the dried film thickness at different drying air temperatures and velocities.
Developing mechanistic models for convective drying of polymer-solvent systems has been the subject of previous works [12–18]. Although these works presented transport models and studied different aspects of drying process for polymer films, none of them considered the presence of drug particles and presented experimental drying data together with a transport model for polymeric films loaded with poorly water-soluble drug particles. A critical part in any transport model is the calculation of the solvent diffusion coefficient in the polymer film. Different models have been proposed in the literature [19,20]. A significant contribution to modeling of the diffusion in polymer solutions was made by Vrentas and Duda [21,22]. They improved and extended the model based on free-volume theory originally developed by Fujita [23]. Although their model requires the estimation of several parameters; it is applicable to various polymer-solvent systems at different temperatures and polymer concentrations [19]. Some groups have used drying experimental data to fit some of the unknown parameters for the diffusion coefficient in polymer systems [24,25]. A similar approach is adopted in this work.
Given the shortcomings of semi-empirical models and lack of experimentally-validated transport models for drug particle-loaded film drying, a predictive transport model assuming a pseudo-binary system (polymer-solvent system) is presented here for the convective drying of polymer strip films loaded with silica-coated micronized griseofulvin (GF). Polymer strip films containing hydroxypropyl methylcellulose (HPMC; Methocel E-15), glycerin, water and silica-coated micronized GF were used in the drying experiments. Film precursor suspension was prepared by directly mixing silica-coated GF with an aqueous solution of HPMC and glycerin. Film was cast and drying data obtained from a batch set-up were used to estimate some of the diffusivity parameters and validate the model. Simulation and parametric study were conducted using COMSOL Multiphysics and MATLAB. The effects of air temperature and velocity as well initial (wet) film thickness on drying kinetics were studied. The capabilities of the transport model were assessed by examining its prediction of the salient experimentally observed features of drying as well as its prediction of moisture variation and dried film thickness under different processing conditions. This work contributes to the development of a robust drying process for the production of polymer strip films containing a poorly water-soluble drug and may be used for model-based control and optimization of the process.
2. Materials and methods
2.1. Materials
Griseofulvin (GF; Sigma–Aldrich, Saint Louis, MO) was used as a model BCS (Biopharmaceutics Classification System) Class II drug. Pharmaceutical grade amorphous hydrophilic silica (M5P, Cabot Corporation, MA) with nominal particle size of 16 nm was utilized as the coating material for GF (host) particles. Low molecular weight hydroxypropyl methylcellulose (HPMC; Methocel E15 Premium LV, The Dow Chemical Company, Midland, MI) and glycerin (Sigma-Aldrich) were used as the film former and plasticizer. The density of GF is 1.4 g/cm3, the molecular weight and density of HPMC are 14167 g/mol and 1.29 g/cm3.
2.2. Preparation of film precursor, casting and drying
Details of material preparation and drying experiments have been published in a separate paper [10]. A brief description is presented in this section. Based on our previous works [7,26], simultaneous micronization and silica-coating of GF particles was performed using fluidized energy milling (FEM, qualification model, Sturtevant Inc., Hanover, MA). The volume-based cumulative particle size distribution of the resulting micronized coated GF particles was determined via laser diffraction (n = 3) using Rodos/Helos system (Sympatec, NJ, USA). The particles have a 10% passing size (d10), 50% passing size, i.e., the median size (d50), and 90% passing size (d90) of 1.76± 0.11 μ m, 5.64± 0.16 μ m, and 12.49± 0.42 μm, respectively.
An aqueous 14% (w/w%) HPMC E15 and 4% (w/w%) glycerin solution was prepared by adding glycerin into the water at 35–40 °C and HPMC powder at 90 °C. After the addition of components into water, the solution was left to cool down to room temperature. The micronized coated GF was added into the polymer solution with a ratio of 1:48. They were mixed and defoamed using a planetary centrifugal mixer (Thinky ARE-310, Laguna Hills, CA, USA) at 2000 rpm for 2 min, and defoamed at 2200 rpm for 30 s. The suspension was left overnight to remove the remaining air bubbles. The final composition of the precursor (wet %) and the film (dry %) are shown in Table 1.
Table 1.
Theoretical composition of the wet and dry films.
| Ingredients | Type | Wet Film (%) | Dry Film (%) |
|---|---|---|---|
| Polymer | HPMC E15 | 13.72 | 69.76 |
| Plasticizer | Glycerin | 3.92 | 19.93 |
| Active Pharmaceutical | |||
| Ingredient | Griseofulvin | 1.97 | 10.00 |
| Coating agent | Silica (M5P) | 0.06 | 0.31 |
| Water | 80.34 |
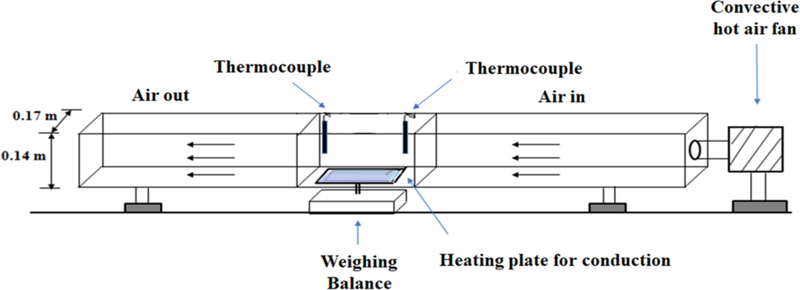
Wet films were cast on a polyester substrate using a doctor blade. The substrate with the film ( 12×8 cm) was placed on a heated metal plate with a fixed temperature (the same temperature as the drying air). The isothermal plate would minimize the temperature variation across the film during the drying process. Convective drying of polymer strip films was done using a batch set-up in which the air velocity and temperature were controlled by an air blower with a heating coil as shown in Fig. 1. The plate was positioned on a digital scale connected to a computer system and the weight of the film was recorded every 2 s. The air temperature and velocity in the chamber were monitored throughout the process, using thermocouples and an anemometer to ensure steady-state operation.
Fig. 1.
Schematic of the drying apparatus.
Drying kinetic data were collected based on a full factorial design of experiment (two levels for air temperature: 313 and 343 K (40 and 70 °C) and two levels for air velocity: 0.2 and 1 m/s) and a center point (328 K (55 °C), 0.6 m/s). The range for temperature and velocity was chosen based on some preliminary experiments and a previous work done by Susarla et al. [6], in which gentle drying condition was recommended to obtain uniform films without phase separation or defects. The selected drying temperatures are also well below the melting point of GF (220 °C).
2.3. Differential Scanning Calorimetry
A polymer (HPMC) film without any additives (i.e. plasticizer) or API were prepared using the same procedure in section 2.2. The prepared film was used to analyze the glass transition temperature (Tg) of the HPMC via differential scanning calorimeter (DSC, Polymer DSC, Mettler Toledo). Approximately 6–8 mg of the sample was weighed into an aluminum standard pan, then heated from 25°C to 200 °C with a constant heating rate of 10 °C/min under nitrogen gas and cooled down to 25 °C with the same rate. Heating cycle was used to calculate the Tg of the HPMC.
3. Film drying model
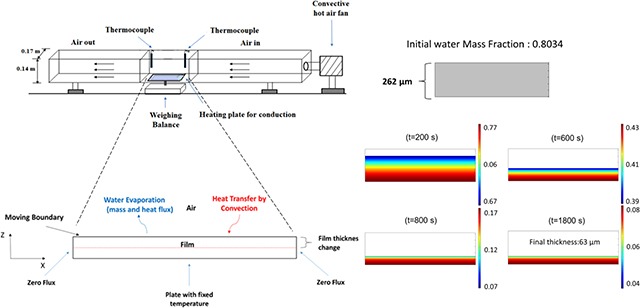
A schematic representation of the film drying process is depicted in Fig. 2. A two-dimensional transient (2D) model for heat and mass transfer as well as the moving interface between the wet film and air is presented here. Reasonable assumptions were made to obtain a practical model for the drying [12,18,24]: (i) the gradient in the third dimension (width) of the film is assumed to be negligible; (ii) a pseudo-binary case of solvent (water) and polymer system was considered: all the non-volatile components (HPMC, glycerin and coated drug) are represented by a single “polymer” phase with HPMC as the dominant species, which has significant interaction with water; (iii) there is no volume change on mixing for polymer-solvent system as the partial specific volumes of polymer and solvent are independent of composition at a specific temperature; (iv) the drag force applied by the gas phase on the film is negligible; (v) the impact of air flow dynamics over the film was implicitly accounted for by the average heat and mass transfer coefficients obtained by suitable correlations. Throughout the manuscript, subscripts “1” and “2” denote the solvent and the polymer, respectively.
Fig. 2.
A two-dimensional representation of water evaporation from the wet film with the suitable boundary conditions.
3.1. Mass transfer equations and solvent diffusivity model
The continuity equation for the moisture and the diffusive mass flux of moisture in the film are described by:
| (1) |
| (2) |
where ω1 is the mass fraction of water, j1 is the diffusive flux of water in the polymer, ρ is the film density calculated based on the mass fractions of the components, Dm is the mutual diffusion coefficient of water in the polymer, Mi is the molecular weight of the species. Mass fraction of polymer is calculated by the balance equation: ω2=1–ω1.
At the beginning of the drying process, polymer films are in a rubbery state due to high concentration of the solvent. As solvent evaporates, films get thinner and depending on the properties of the components, the glass transition temperature of the film and the drying condition, they may enter glassy state. Diffusion in rubbery and glassy polymer-solvent systems has been addressed in the literature (see e.g. [20]). Based on the free-volume theory, diffusion of molecules depends on the free volume or space between the molecules available in the diffusion medium [23]. The total free-volume can be divided into two parts. One part is the interstitial volume and the other is the hole free volume, which is redistributed throughout the mixture and contributes to the molecular diffusion [21,22]. Below glass transition temperature of the polymer, extra hole free volume becomes available that contributes to molecular diffusion. According to Vrentas and Duda’s model [21,22], the self-diffusivity D1 of the solvent is given by:
| (3) |
Here, is the pre-exponential factor, E is the energy required for the molecules to overcome the attractive forces, R is the universal gas constant, T is the film temperature and ωi the mass fractions of solvent and polymer. is the specific critical hole free volume of the solvent and polymer, which can be estimated by the specific volume of the solvent and polymer at 0 K using group contribution method [27]. ξ is the ratio of the molar volume of the jumping unit of the solvent to that of the polymer, is the specific hole free volume of the mixture and γi is the overlap factor for the free volume of component i. A negligible E is assumed in the literature for predictive version of the free-volume theory [28,29]; the same assumption is used in this work. Hence, the self-diffusion coefficient can be written as:
| (4) |
| (5) |
Equation 5 shows the relation between the specific hole free volume of the mixture and the pure components (solvent and polymer). The expression for is given by:
| (6) |
where K11 and K21 are free-volume parameters, Tg1 is the glass transition temperature of the solvent and T is the system temperature. Based on the free-volume theory [22], Wang et al. [30] used a method for the calculation of the polymer hole free volume and expressed as:
| (7) |
| (8) |
Here, K12 and K22 are free volume parameters of the polymer.
Gordon-Taylor equation has been used to approximately calculate the glass transition temperature (Tgm) for binary mixtures [31]. An extended version of the equation has been used for ternary polymer blends in pharmaceutical applications [32–34]. Based on that, the glass transition temperature for our polymer films (Tgm ) can be written as:
| (9) |
where ρ is the density and Tg is the glass transition temperature for individual components. Subscripts 1,2 and 3 refer to water (solvent), HPMC and glycerin (plasticizer). In this work, since a pseudo-binary mixture is assumed and HPMC and glycerin do not evaporate, the weight fraction of glycerin was calculated based on the composition of the film and glycerin to HPMC ratio. The Tg of glycerin is −83 °C [35]; Tg of HPMC is approximately 162.5 °C, which was obtained from Differential Scanning Calorimetry (DSC) measurements of an HPMC film and the commonly used value for Tg of water is −137 °C. In our strip films, water and glycerin are the components that significantly depress the glass transition temperature of HPMC, whereas the effect of poorly-water soluble drug is not considered.
The diffusion coefficient used in the diffusion flux expression (Eq. 2) is the mutual diffusion coefficient, which can be calculated from self-diffusion coefficient using appropriate thermodynamic models [21,22,36]. Assuming Flory-Huggins thermodynamic model for the polymer solution, the mutual diffusion coefficient can be written as:
| (10) |
The solvent volume fraction can be estimated by [37]:
| (11) |
As shown in Eq. (10), the mutual diffusion coefficient becomes equivalent to self-diffusivity at trace amount of solvent in the mixture (φ1→0). In Eq. (10), χ is the Flory-Huggins interaction parameter for the polymer-solvent system.
Wang et al. used Eqs. (4–8) and Eq. (10) to calculate the mutual diffusion coefficient for glassy polymer-solvent systems and found good agreement with experiments [30]. Their approach is expected to be valid for systems with small-molecule solvents that cause significant depression of glass transition temperature. Zielinski and Hanley developed a correlation relating mutual diffusion coefficient (Dm) to self-diffusivity (D1) in multicomponent polymer solutions for a wide range of concentrations [38]. Based on their work, mutual diffusion coefficient for a binary mixture may be written as:
| (12) |
where is the specific volume of the solvent or equilibrium liquid polymer.
Hadj Romdhane et al. compared the predictive capability of different correlations for mutual diffusion coefficient using experimental drying data for PMMA-toluene system [16]. Based on their results, Zielinski and Hanley’s correlation, i.e., Eq. (12), showed better performance than Eq. (10); therefore, we used the Zielinski and Hanley’s correlation here.
It should be noted that there is uncertainty in the values reported in the literature for the free volume parameters of polymer-solvent systems. In the absence of reliable data for the parameters specially for polymers, drying data can be used to estimate some of these parameters [24,25]. Based on the drying data for one set of drying conditions obtained from our batch-setup, ξ, K12/γ and K22 were estimated using least-square fitting, as described in Section 4.
3.2. Local thermal energy balance
The local thermal energy balance for the stationary film and Fourier’s law of heat conduction are described by
| (13) |
where Cp is the heat capacity of the film, Z is the vertical position of the film and air interface, T is the film temperature, q is the conductive heat flux, and k is thermal conductivity of the film, which could be approximately calculated using the equation suggested by Foster et al. [39].
3.3. Moving boundary equation
The wet film thickness changes due to evaporation of water, which can be described as follows:
| (14) |
Here, ρ is the film density, ρ1 g is the bulk mass concentration of water vapor in the air, km is the external mass transfer coefficient (refer to Appendix B), Pv1 is the saturation pressure of water at the film surface (interface with air). Tint is the wet film surface temperature, which was measured by a laser thermometer in the experiments. Based on Eq. (14), the rate of thickness (Z) change (velocity of the moving boundary) is proportional to the rate of water evaporation (R) from the film. The saturation pressure is approximately calculated based on the assumption that film is in the rubbery state using Flory-Huggins’ relation [40]:
| (15) |
where φ1 is the volume fraction of water in the polymer film and χ is the Flory-Huggins parameter, which quantifies polymer-solvent affinity. Antoine equation was used to determine the vapor pressure of pure water as follows:
| (16) |
where A, B, and C are constants of the correlation [41].
Based on the Flory-Huggins’ theory, polymer and solvent are completely miscible if χ < 0.5 [40]. χ values for some polymer-solvent systems are available in the literature [37,42]. Experimental methods such as inverse gas chromatography (IGC), osmosis, light scattering and vapor-pressure measurements can be performed to determine the dependence of χ (φ2, T) on polymer concentration and temperature [43]. In some cases, χ is assumed to be constant, while in other cases there is linear or nonlinear dependence on concentration and temperature [43,44]. In the absence of data, a constant value of 0.5 is assumed in our simulations, which is the maximum limiting value for polymer-solvent miscibility [45]. A more rigorous approach using the experimental methods could be performed in the future to establish the dependence of χ on temperature and concentration.
4. Model calibration and numerical simulations
In order to solve the transient transport equations (partial differential equations) with the moving boundary subject to the initial–boundary conditions recorded in Appendix A and perform parameter estimation, COMSOL Multiphysics and MATLAB were used. In COMSOL, transport of species, heat transfer and deformed geometry modules were used for a 2D model of the film as presented in Fig. 2. The film geometry was discretized using quad mesh with boundary layers (10800 and 10670 elements for two initial wet film thicknesses). Grid independence was tested to ensure reasonable accuracy of the results. COMSOL Direct solver (MUMPS) was used and solution time for all drying conditions was 20 min or less on a PC (CPU 3.4 GHz) with 8 GB of RAM.
In order to estimate the diffusivity parameters (model calibration), a MATLAB code using optimization sub-routine (fmincon) was implemented to do the least-square fitting. COMSOL and MATLAB LiveLink was used to connect the COMSOL model and the optimization code. At each iteration, the optimization code calls the COSMOL model to obtain the predicted moisture content (X) of the film and perform the least-square fitting based on the following objective function:
| (17) |
where is the reduced chi-squared, Xi is the film moisture content (g/g dry mass), n is the number of experimental data points, p is the number of model parameters and σ is the measurement error obtained from replicates. Experimental moisture content was obtained every 2 s as explained in Section 2.2. Since drying data is noisy, Savitzky-Golay filtering (first order) was done in MATLAB for noise reduction before data fitting. Minimization of the error sum of squares divided by the degree of freedom as shown in Eq. (17) was performed by the optimization code.
Parameter estimation for the three diffusivity parameters ξ, K12/γ and K22 was performed considering only one set of “reference” drying conditions, i.e., 313 K (40 °C) −1 m/s and initial wet film thickness of 262 μm. It is critical to note that the same set of parameters (ξ, K12/γ and K22) was used to predict the moisture-time evolution for all other drying conditions and initial wet film thicknesses. The condition with the lowest air temperature and velocity in the DoE (313K (40 °C)- 0.2 m/s) was not included in the model prediction assesment, due to controllability issues with the air blower at this drying condition, which afftected reliable data dollection.The best estimates obtained for the diffusivity parameters as well as other parameters used in the simulations are presented in Table 2.
Table 2.
Estimated or assumed diffusivity parameters for water (1)-polymer (2) system in the simulations.
| Parameter | Values | Reference |
|---|---|---|
| ξa | 0.58 | - |
| χb | 0.5 | |
| Water: | ||
| K11/γ (m3/kg K) | 2.18 × 10⁻⁶ | [28] |
| K21 – Tg1 (K) | −152.29 | [28] |
| 1.071 ×10⁻³ | [28] | |
| 8.55 ×10⁻⁸ | [28] | |
| Polymer: | ||
| K12/γ a (m3/kg K) | 3.22 ×10⁻⁴ | - |
| K22 – Tg2 a (K) | −250.4 | - |
| c | 6.958 ×10⁻⁴ | [46] |
Estimated free-volume parameters.
Assumed value in this work.
Specific hole free volume of HPMC E15 is assumed for .
5. Results and discussion
In the drying experiments, constant moisture content was achieved and drying was complete within half an hour for two wet film thicknesses at the selected conditions. Wet films with the initial thickness of 253–265 μm yielded 50–55 μm thick dried films, while thinner wet films (150–171 μm) yielded thinner dried films (30–35 μm). Since the wet films were cast manually, there was a small variation in the wet film thickness. At the selected drying conditions, uniform drying was achieved with no visible phase separation or defect in the films, and acceptable drug content uniformity was achieved [10].
5.1. Transport model simulations and model calibration at the reference drying condition
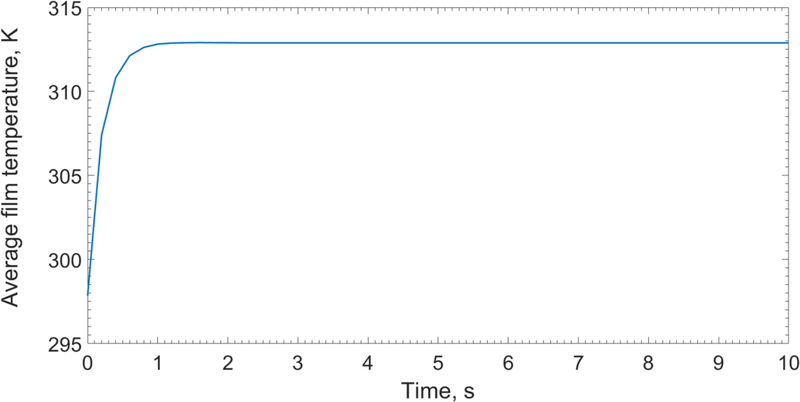
In this section, we present simulation results for the reference drying conditions, i.e., inlet air temperature of 313 K (40 °C), air velocity of 1 m/s, and wet film thickness of 262 μm, at which the diffusivity parameters were estimated (model calibration). The time-wise evolution of the spatially-averaged film temperature is shown in Fig. 3. The average film temperature rose fast and approached the air temperature within the first two seconds of drying. The film has almost uniform temperature throughout drying (Fig. 3&4); similar results were also obtained for other drying conditions (328 and 343 K), which are not shown for the sake of brevity. Besides the thin nature of the strip films, the setting of the substrate at the drying air temperature explains the fast rise and uniformity of the film temperature.
Fig. 3.
Spatially-averaged film temperature profile in the first 10 s of the drying process (313 K (40 °C)- 1 m/s, wet film thickness=262 μm).
Fig. 4.
Spatial variation of film temperature profile at the start of the evaporation in the set-up (t=0) and t=1 s, showing almost uniform temperature profile in the film within 2 seconds of the drying.
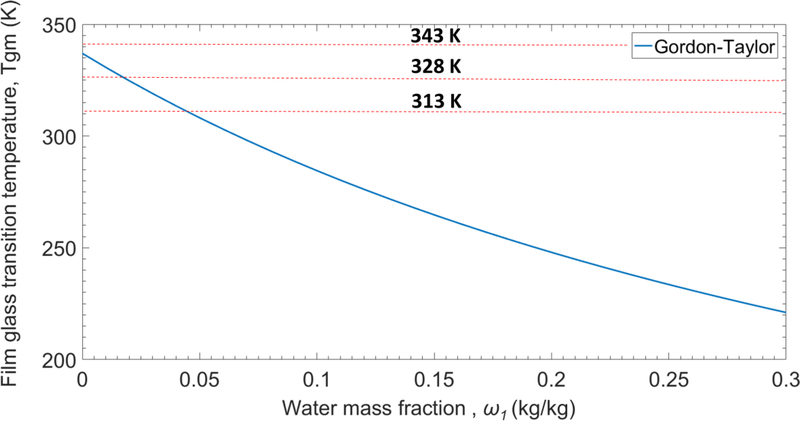
Fig. 5 illustrates the significant depression of HPMC glass transition temperature caused by glycerin and water in accordance with the Gordon-Taylor correlation and rise of the film glass transition temperature upon water evaporation during the final stage of the drying process in which water mass fraction is below 0.3. The drying temperatures (as shown by dashed lines) are above the glass transition temperature of the film during most or all of the process; hence, the film is in the rubbery state (considering Figs. 3–5). At the drying temperatures of 313 and 328 K, however, film enters glassy state at very low mass fraction of water (less than 0.05). In the glassy state, viscoelastic behavior of the film and the stress relaxation may affect moisture diffusion flux during drying. Since, in our case, films enter glassy state towards the end of the process at very low concentration of water, the model without considering the stress relaxation factor is effective and practical enough to predict the moisture content and dried film thickness (as shown in the next section).
Fig. 5.
Film glass transition temperature vs. water mass fraction in the film. Plot shows the effect of water concentration on the depression of the polymer film glass transition temperature as calculated by Gordon-Taylor equation (Eq. (9)). Dashed lines show the three drying temperatures used in the experiments.
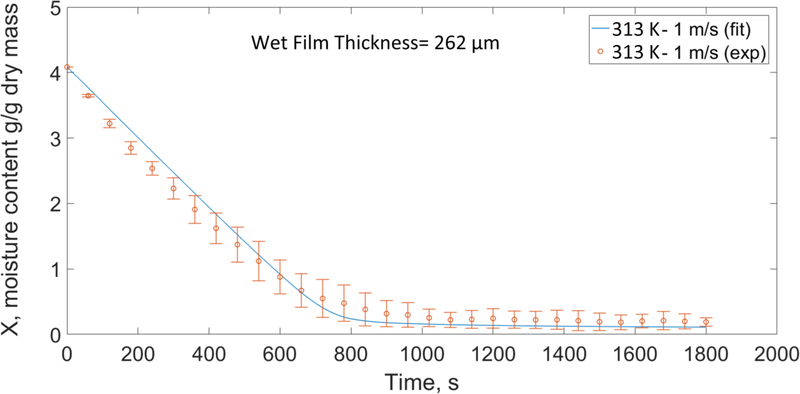
Fig. 6 shows the experimentally measured time-wise evolution of the average moisture content at 313 K (40 °C)-1 m/s for initiallly 262 μm thick wet film and its simulated profile obtained from the transport model, whose diffusivity parameters were obtained from fitting to this data set. The fitted profile shows good agreement with the experiment specifically towards the end of the process with high coefficient of determination (R2=0.99). The minor deviation between the experiment and the fit in the first stage of the drying is due to the assumed values for heat (h) and mass transfer coefficients (km) in the air as well as the error associated with the average velocity measurement in the experimental set-up. The correlations suggested in the literature to calculate heat and mass transfer coeffcients for drying process were not specifically derived for the polymer films in our set-up and do not completely capture the dynamics of the air flow over the films, where water evaporates.
Fig. 6.
Experimental and fitted profile for time-wise evolution of moisture at the reference condition (313 K (40 °C)-1 m/s) with an initial wet film thickness of 262 μm (reperesentative experimental data points are presented with their repsective error bars).
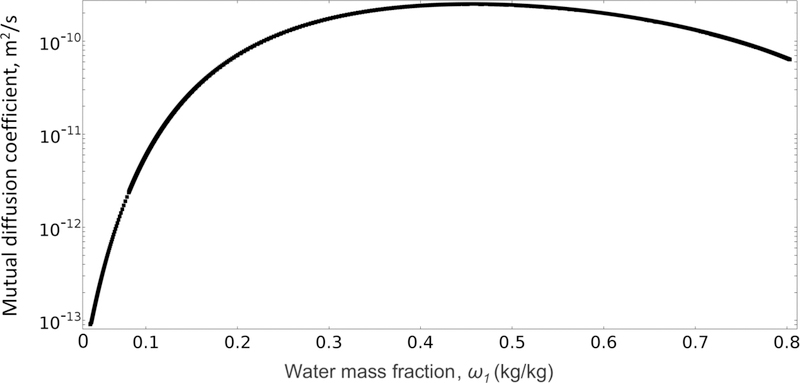
Fig. 7 shows the variation in mutual diffusion coefficient (Dm in Eq. (10)) vs. water mass fraction at the film surface. The profile goes through a maximum at medium concentration of water and then falls as the film dries out. This behavior has been observed for polymer-solvent systems and is due to the opposing contributions of self-diffusion coefficient (D1) and thermodynamic terms, which are multiplied by D1 as in Eq. (10) [28, 47]. From high to medium concentrations of water, the increase in thermodynamic terms is the dominating factor that raises the mutual diffusion coefficient (Dm) up to a maximum. But at lower concentrations of water (ω1<0.4), the reduction in self-diffusion coefficient (D1 in Eq. (4)) dominates and Dm drops significantly.
Fig. 7.
Profile of mutual diffusion coefficient (Dm) vs. water mass fraction at the film surface.
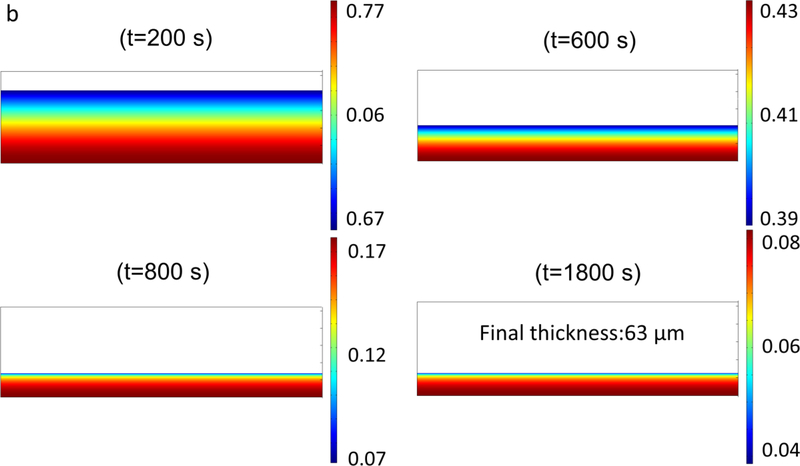
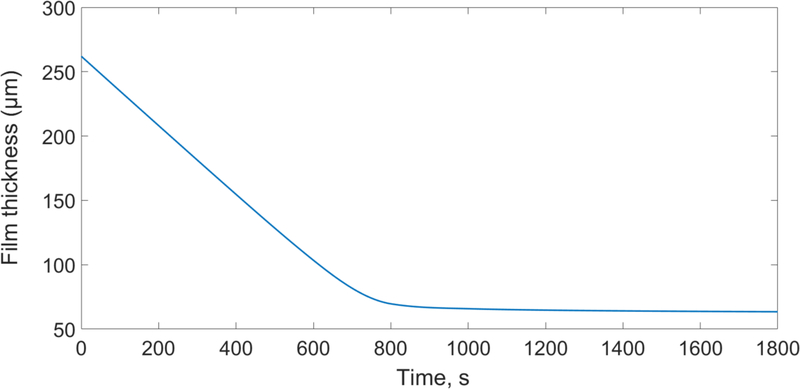
The variation of water mass fraction in the film, the change in the thickness during the drying process and the quad mesh for the reference simulation are shown in Fig. 8. In Fig. 8, water mass fraction profile gradually becomes more uniform during drying process. After t=800 s, water concentration in the film is almost uniform except near the film surface, where a gradient develops. The change in the film thickness from t=800s till the end of the drying (t=1800 s) is not very significant and the drying process is limited by the intra-film diffusion of water through the polymer matrix, which is due to the low concentration of water and mutual diffusion coefficient as shown in Fig. 7. Fig. 9 also shows the predicted change in the film thickness during the drying. It can be seen that most of the water evaporation and shrinkage of the film occur within 800 s of the drying.
Fig. 8.
(a,b) Water mass fraction profile in the film, thickness change and the quad mesh for simulation at 313 K −1 m/s (reference condition).
Fig. 9.
Film thickness change profile at the reference condition (313 K-1 m/s, wet film thickness= 262 μm, dried film thickness=63 μm).
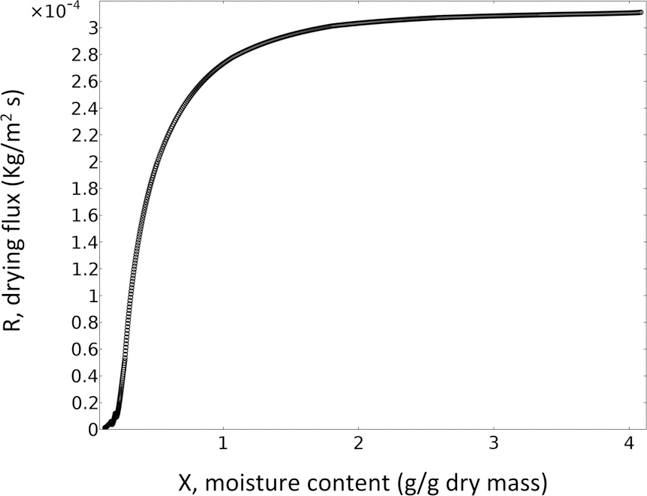
Fig. 10 shows the model-predicted drying flux R as a function of average moisture in the film. This figure demonstrates two distinct drying periods. The drying flux is almost constant till film moisture content decreases to approximately 2; then it starts decreasing sharply as the moisture content drops further till completion of the drying. In other words, the transport model naturally predicts a constant-rate period (nearly constant R within fitting accuracy) smoothly transitioning into falling-rate period, which is experimentally well-established in drying literature (e.g. [9]). Hence, the transport model has delineated the underlying mechanism of the drying kinetics based on fundamental considerations of moisture diffusion–external mass transfer. In the constant-rate period, water is available at the surface of the film and evaporation is controlled by external mass–heat transfer, whereas in the falling-rate period drying is controlled by intra-film diffusion of water, which is due to the reduction in water concentration and mutual diffusion coefficient as explained previously (refer to Figs. 7 and 8).
Fig. 10.
Predicted drying flux vs. moisture content at the reference condition (313 K (40 °C)- 1 m/s, wet film thickness= 262 μm) shows constant-rate and falling-rate periods in the drying process.
5.2. Drying model validation and assessment of the predictive capability
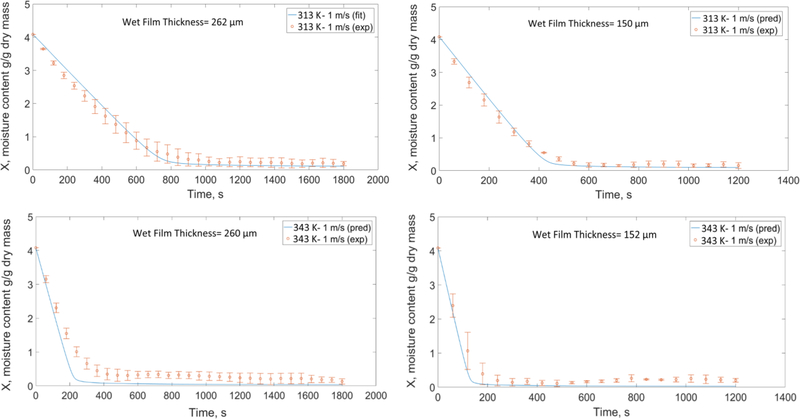
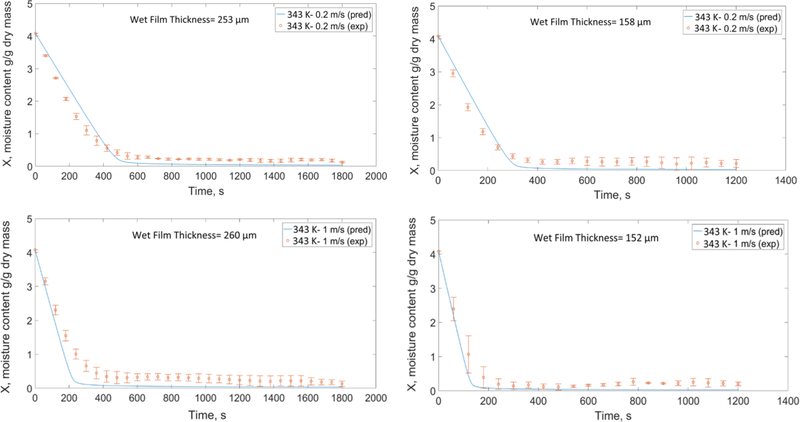
Using the calibrated model with the reference simulation (313 K (40 °C)-1 m/s, wet film thickness= 262 μm) mentioned in Section 5.1, we attempted to predict the time-wise evolution of the moisture content and dried film thickness for other drying conditions and two different wet film thicknesses and presented the predicted and experimental moisture profiles in Figs. 11–13. The mean values of the initial film thickness for the thick films and thin films were 260 μm and 158 μm; small variations were due to manual film casting. Considering the parity with the experimental data, the coefficients of determination (R2) for all the prediction plots are above 0.95. Overall, the predcited plots capture the trends and have good agreement with the data.
Fig. 11.
Predicted and experimental moisture-time evolution at high velocity and different air temperatures based on the DoE for the two wet film thicknesses (representative experimental data points are presented with their respective error bars).
Fig. 13.
Predicted and experimental moisture-time evolution for the center point in the DoE for the two wet film thicknesses (representative experimental data points are presented with their respective error bars).
Fig. 11 shows the effect of temperature and wet film thickness on the drying. At the same film thickness and air velocity, as air temperature increases, the driving force for water evaporation (Ta–Tint) increases (see Eq. (A.3) in Appendix A). Moreover, at a higher temperature, the diffusion of water molecules to the surface of the film (Eq. (4)) is faster, which results in a faster drying. As expected, drying time for thinner films was shorter than thicker films.
Fig. 12 shows the effect of air velocity on the drying for the two wet film thicknesses. At the same film thickness-temperature, increasing the air velocity increases the Reynolds number and consequently the external heat and mass transfer coefficients (h and km) as per Eq. (B.1) and Eq. (B.3) in Appendix B. Hence, films dry out faster at higher velocities. Finally, Fig. 13 shows the prediction plots for the center point (328 K-0.6 m/s) in the DoE. In Figs. 11–13, the deviations of the predictions from experiments, specifically in the first period of drying will be discussed in Section 5.3.
Fig. 12.
Predicted and experimental moisture-time evolution at high temperature and different air velocities based on the DoE for the two wet film thicknesses (representative experimental data points are presented with their respective error bars).
In polymer strip film manufacturing, changing wet film thickness may become necessary in order to adjust the drug loading without changing the film precursor composition. Table 3 shows the predicted dried film thickness at different drying conditions for the two wet film thicknesses. Based on the results, the model provides a reasonable prediction of dried film thickness at different conditions (Table 3).
Table 3.
Predicted dried film thickness and their respective experimental values for the two wet film thicknesses at different drying conditions (average wet film thicknesses: 260 and 158 μm).
| Drying Conditions | Experimental Dried Film Thickness (50–55 μm)a | Experimental Dried Film Thickness (30–35 μm)b |
|---|---|---|
| Predicted Dried Film Thickness (μm) | ||
| 40 °C – 1 m/s | 63 | 36 |
| 55 °C - 0.6 m/s | 61 | 40 |
| 70 °C - 0.2 m/s | 58 | 36 |
| 70 °C - 1 m/s | 58 | 34 |
Average wet film thickness=260 μm.
Average wet film thickness=158 μm.
5.3. Limitations and potential improvements of the transport model
As mentioned previously, in the glassy state the viscoelastic behavior of the film as well as the volume change of mixing may affect the solvent mass flux and the drying process [16,17,48]. As film enters glassy state, if the relaxation time of the polymer matrix is comparable to the solvent diffusion time (Deborah number =τrelax/τdiffuion≈1 ), then the stress relaxation affects the solvent diffusion in the film and non-Fickian diffusion should be considered [17]. In our case, film enters glassy state at very low mass fraction of water and close to equilibrium moisture content at two drying temperatures (313 and 328 K), therefore, the stress factor and volume change on mixing were not included in the model. In the future, the relaxation time of the polymeric films and the viscoelastic stress effect on water mass flux specifically at low concentrations of water should be analyzed using dynamic mechanical tests and if significant, the model should be expanded to include the stress effect.
In Figs. 11–13, the deviation of the model prediction from experimental data is due to the assumed values for the parameters in the model. In general, separate experiments need to be done to obtain suitable correlations for heat and mass transfer coefficients over the film in our set-up and improve the model. Moreover, computational fluid dynamics (CFD) simulations of air flow over films could also help in developing more accurate, tailored heat transfer correlations.
In our model, a pseudo-binary case (polymer-solvent system) was assumed. In order to improve the model, a multi-component diffusion model may be implemented to consider the interaction of all the components in the film, which requires suitable experiments to measure some of the free-volume and thermodynamic parameters like χ for the diffusivity model.
6. Conclusions and future outlook
A detailed transport model considering free-volume theory for solvent diffusion was presented to predict the moisture-time evolution and dried film thickness in convective drying of polymer strip films loaded with coated griseofulvin. Free-volume diffusivity parameters in the transport model were estimated using drying data at a reference condition and the results were used to validate the model using experimental data at other drying conditions and wet film thicknesses. The model demonstrates the underlying mechanism of the drying kinetics and the two primary periods of drying (constant-rate and falling-rate periods). It also shows the significant effects of air temperature and velocity as critical process parameters on the drying rate. The model provided a reasonable prediction of the moisture content and dried film thickness at different conditions. In the future, the glass transition temperature of the polymer film and its depression at different concentrations of water should be measured and compared with the correlation result. Suitable experiments need to be done to find external heat and mass transfer coefficients, diffusivity and thermodynamic parameters for the film to improve the model. Finally, dynamic mechanical test is recommended to assess the viscoelastic behavior of the film. In spite of the limitations, the present model is a practical and effective tool for optimal design and control of the convective drying for the manufacturing of polymer strip films loaded with a poorly water-soluble drug.
Acknowledgments
The authors are grateful for financial support from the National Science Foundation (NSF) in part through the ERC (EEC-0540855) award and from the National Institute of Health (NIH) NIH-U01 in part through award U01FD005521.
Appendix A. Initial and boundary conditions of the transport model
The initial conditions for the continuity equation for moisture (Eq. (1)), local thermal energy balance (Eq. (13)), and the moving boundary equation (Eq. (14)) are
| (A.1) |
respectively. The boundary conditions for the bottom film surface, i.e., z = 0, are
| (A.2) |
The boundary conditions at air–film interface, i.e., z = Z(t) are
| (A.3) |
The boundary conditions for the side surfaces of the film, i.e., x = 0, L, are
| (A.4) |
where ω0 is the initial water mass fraction (0.8034), T0 is the initial film temperature (room temperature) and Tsub is the substrate temperature, which is fixed at the air temperature (Ta). Heat and mass transfer from the sides of the film are assumed to be negligible; therefore, zero flux is assumed for the boundary conditions.
Appendix B. Mass-heat transfer correlations
Depending on the geometry of the system and flow regime, some correlations have been suggested in the literature to calculate the external heat (h) and mass transfer coefficients (km) [49–52]. Convective drying experiments in this work were conducted at different air velocities in laminar and turbulent regimes. Suitable correlations were chosen to approximately calculate the heat and mass transfer coefficients for the drying process. Schmidt-Hansberg et al. performed convective drying experiments in a rectangular channel similar to our set-up for polymer films used in organic photovoltaics for Reynolds numbers up to 2500 [52]. Based on their work, the mean Sherwood (Sh) number and km over the substrate can be determined from
| (B.1) |
where Re is the Reynolds number (Re = ρaVa L/μa), Sc is the Schmidt number (Sc=μa/ρa Dw). Dw is the water vapor diffusivity in the air (subscript “a”), which was obtained using the Fuller’s equation [53]. L is the substrate length. Properties of humid air were obtained from Tsilingiris et al. [54].
Based on Chilton-Colburn analogy [55] between mass and heat transfer, the heat transfer coefficient h can be written as:
| (B.2) |
where Pr is the Prandtl number (Pr=Cpa μa/ka). Using the Sherwood number and Chilton-Colburn analogy, the mass transfer (km) and heat transfer coefficients (h) were calculated, which were used for the air velocity of 0.2 m/s (laminar flow).
In a turbulent flow parallel to the wet film surface, the following correlation is recommended for the drying process [49,50]:
| (B.3) |
where Nu is the Nusselt number, h is the heat transfer coefficient, Dh is the hydraulic diameter of the channel, and k is the thermal conductivity. This correlation was used for the air velocities of 0.6 and 1 m/s.
Nomenclature
= constant pre-exponential for self-diffusion of solvent in Eq. (3) (m2/s)
D1= solvent self-diffusion coefficient (m2/s)
Dm= polymer-solvent mutual diffusion coefficient (m2/s)
K11= solvent free-volume parameters (m3/kg K)
K21= solvent free-volume parameters (K)
K12= polymer free-volume parameters (m3/kg K)
K22= polymer free-volume parameters (K)
Mi= molecular weight of the component i ((kg/kmol)
Pv1= saturation pressure of water at the film surface (Pa)
R= universal gas constant (j/mol K)
T= temperature (K)
Tgi = glass transition temperature of the component i (K)
= specific critical hole free volume of the component i (m3/kg)
= hole free volume of the component i (m3/kg)
= specifc volume of the solvent or equilibrium liquid polymer (m3/kg)
h= heat transfer coefficient (W/m2 K)
km= mass transfer coefficient (m/s)
Greek Letters
ρ= density (kg/m3)
γi = overlap factor for component i
ξ = ratio of critical molar volume of solvent jumping unit to that of polymer
ϕ1=solvent volume fraction
χ = Flory-Huggins polymer-solvent interaction parameter
ωi = solvent or polymer mass fraction (kg/kg)
Footnotes
Publisher's Disclaimer: This is a PDF file of an unedited manuscript that has been accepted for publication. As a service to our customers we are providing this early version of the manuscript. The manuscript will undergo copyediting, typesetting, and review of the resulting proof before it is published in its final citable form. Please note that during the production process errors may be discovered which could affect the content, and all legal disclaimers that apply to the journal pertain.
References
- [1].Averineni RK, Sunderajan SG, Mutalik S, Nayak U, Shavi G, Armugam K, Meka SR, Pandey S, Nayanabhirama U, Development of mucoadhesive buccal films for the treatment of oral sub-mucous fibrosis: a preliminary study, Pharmaceutical development and technology, 14 (2009) 199–207. [DOI] [PubMed] [Google Scholar]
- [2].Dixit R, Puthli S, Oral strip technology: overview and future potential, Journal of controlled release, 139 (2009) 94–107. [DOI] [PubMed] [Google Scholar]
- [3].Krull SM, Ammirata J, Bawa S, Li M, Bilgili E, Davé RN, Critical material attributes of strip films loaded with poorly water-soluble drug nanoparticles: II. Impact of polymer molecular weight, Journal of pharmaceutical sciences, 106 (2017) 619–628. [DOI] [PubMed] [Google Scholar]
- [4].Krull SM, Patel HV, Li M, Bilgili E, Davé RN, Critical material attributes (CMAs) of strip films loaded with poorly water-soluble drug nanoparticles: I. Impact of plasticizer on film properties and dissolution, European Journal of Pharmaceutical Sciences, 92 (2016) 146–155. [DOI] [PMC free article] [PubMed] [Google Scholar]
- [5].Krull SM, Susarla R, Afolabi A, Li M, Ying Y, Iqbal Z, Bilgili E, Davé RN, Polymer strip films as a robust, surfactant-free platform for delivery of BCS Class II drug nanoparticles, International journal of pharmaceutics, 489 (2015) 45–57. [DOI] [PubMed] [Google Scholar]
- [6].Susarla R, Sievens-Figueroa L, Bhakay A, Shen Y, Jerez-Rozo JI, Engen W, Khusid B, Bilgili E, Romañach RJ, Morris KR, Michniak-Kohn B, Davé RN, Fast drying of biocompatible polymer films loaded with poorly water-soluble drug nano-particles via low temperature forced convection, International Journal of Pharmaceutics, 455 (2013) 93–103. [DOI] [PubMed] [Google Scholar]
- [7].Zhang L, Li Y, Abed M, Davé RN, Incorporation of surface-modified dry micronized poorly water-soluble drug powders into polymer strip films, International Journal of Pharmaceutics, 535 (2018) 462–472. [DOI] [PubMed] [Google Scholar]
- [8].Airaksinen S, Karjalainen M, Shevchenko A, Westermarck S, Leppänen E, Rantanen J, Yliruusi J, Role of water in the physical stability of solid dosage formulations, Journal of pharmaceutical sciences, 94 (2005) 2147–2165. [DOI] [PubMed] [Google Scholar]
- [9].Mujumdar AS, Book Review: Handbook of Industrial Drying, Third Edition, Drying Technology, 25 (2007) 1133–1134. [Google Scholar]
- [10].Naseri AT, Cetindag E, Forte J, Bilgili E, Dave RN Convective drying kinetics of polymer strip films loaded with a BCS Class II drug AAPS PharmaSciTech, in press. [DOI] [PubMed] [Google Scholar]
- [11].Velaga SP, Nikjoo D, Vuddanda PR, Experimental Studies and Modeling of the Drying Kinetics of Multicomponent Polymer Films, AAPS PharmSciTech, 19 (2018) 425–435. [DOI] [PubMed] [Google Scholar]
- [12].Vrentas JS, Vrentas CM, Drying of solvent-coated polymer films, Journal of Polymer Science Part B: Polymer Physics, 32 (1994) 187–194. [Google Scholar]
- [13].Alsoy S, Duda JL, Modeling of multicomponent drying of polymer films, AIChE journal, 45 (1999) 896–905. [Google Scholar]
- [14].Dabral M, Francis L, Scriven L, Drying process paths of ternary polymer solution coating, AIChE journal, 48 (2002) 25–37. [Google Scholar]
- [15].Guerrier B, Bouchard C, Allain C, Benard C, Drying kinetics of polymer films, AIChE Journal, 44 (1998) 791–798. [Google Scholar]
- [16].Hadj Romdhane I, Price PE, Miller CA, Benson PT, Wang S, Drying of glassy polymer films, Industrial & engineering chemistry research, 40 (2001) 3065–3075. [Google Scholar]
- [17].Vinjamur M, Cairncross RA, Non-Fickian nonisothermal model for drying of polymer coatings, AIChE Journal, 48 (2002) 2444–2458. [Google Scholar]
- [18].Mesbah A, Ford Versypt AN, Zhu X, Braatz RD, Nonlinear Model-Based Control of Thin-Film Drying for Continuous Pharmaceutical Manufacturing, Industrial & Engineering Chemistry Research, 53 (2014) 7447–7460. [Google Scholar]
- [19].Masaro L, Zhu X, Physical models of diffusion for polymer solutions, gels and solids, Progress in polymer science, 24 (1999) 731–775. [Google Scholar]
- [20].Ramesh N, Davis PK, Zielinski JM, Danner RP, Duda JL, Application of free-volume theory to self-diffusion of solvents in polymers below the glass transition temperature: A review, Journal of Polymer Science Part B: Polymer Physics, 49 (2011) 1629–1644. [Google Scholar]
- [21].Vrentas JS, Duda JL, Diffusion in polymer—solvent systems. I. Reexamination of the free-volume theory, Journal of Polymer Science: Polymer Physics Edition, 15 (1977) 403–416. [Google Scholar]
- [22].Vrentas JS, Duda JL, Diffusion in polymer–solvent systems. II. A predictive theory for the dependence of diffusion coefficients on temperature, concentration, and molecular weight, Journal of Polymer Science: Polymer Physics Edition, 15 (1977) 417–439. [Google Scholar]
- [23].Fujita H, Diffusion in polymer-diluent systems, in: Fortschritte Der Hochpolymeren-Forschung, Springer, 1961, pp. 1–47. [Google Scholar]
- [24].Price PE, Wang S, Romdhane IH, Extracting effective diffusion parameters from drying experiments, AIChE Journal, 43 (1997) 1925–1934. [Google Scholar]
- [25].Verros GD, Malamataris NA, Computer-Aided Estimation of Diffusion Coefficients in Non-Solvent/Polymer Systems, Macromolecular Theory and Simulations, 10 (2001) 737–749. [Google Scholar]
- [26].Han X, Ghoroi C, To D, Chen Y, Davé R, Simultaneous micronization and surface modification for improvement of flow and dissolution of drug particles, International journal of pharmaceutics, 415 (2011) 185–195. [DOI] [PubMed] [Google Scholar]
- [27].Haward R, Occupied volume of liquids and polymers, Journal of Macromolecular Science—Reviews in Macromolecular Chemistry, 4 (1970) 191–242. [Google Scholar]
- [28].Hong S-U, Prediction of polymer/solvent diffusion behavior using free-volume theory, Industrial & Engineering Chemistry Research, 34 (1995) 2536–2544. [Google Scholar]
- [29].Jiang W, Han R, Prediction of solvent-diffusion coefficient in polymer by a modified free-volume theory, Journal of applied polymer science, 77 (2000) 428–436. [Google Scholar]
- [30].Wang B-G, Yamaguchi T, Nakao S-I, Solvent diffusion in amorphous glassy polymers, Journal of Polymer Science Part B: Polymer Physics, 38 (2000) 846–856. [Google Scholar]
- [31].Gordon M, Taylor JS, Ideal copolymers and the second-order transitions of synthetic rubbers. I. Non-crystalline copolymers, Journal of Applied Chemistry, 2 (1952) 493–500. [Google Scholar]
- [32].Kalogeras IM, A novel approach for analyzing glass-transition temperature vs. composition patterns: application to pharmaceutical compound+ polymer systems, European Journal of Pharmaceutical Sciences, 42 (2011) 470–483. [DOI] [PubMed] [Google Scholar]
- [33].Tobyn M, Brown J, Dennis AB, Fakes M, Gao Q, Gamble J, Khimyak YZ, McGeorge G, Patel C, Sinclair W, Timmins P, Yin S, Amorphous drug–PVP dispersions: Application of theoretical, thermal and spectroscopic analytical techniques to the study of a molecule with intermolecular bonds in both the crystalline and pure amorphous state, Journal of Pharmaceutical Sciences, 98 (2009) 3456–3468. [DOI] [PubMed] [Google Scholar]
- [34].Van den Mooter G, Wuyts M, Blaton N, Busson R, Grobet P, Augustijns P, Kinget R, Physical stabilisation of amorphous ketoconazole in solid dispersions with polyvinylpyrrolidone K25, European Journal of Pharmaceutical Sciences, 12 (2001) 261–269. [DOI] [PubMed] [Google Scholar]
- [35].Donth EJ, Relaxation and thermodynamics in polymers, Akademie Verlag GmbH, Berlin, 1992. [Google Scholar]
- [36].Ju S, Liu H, Duda J, Vrentas J, Solvent diffusion in amorphous polymers, Journal of Applied Polymer Science, 26 (1981) 3735–3744. [Google Scholar]
- [37].Orwoll RA, The Polymer-Solvent Interaction Parameter X, Rubber Chemistry and Technology, 50 (1977), pp. 451–479. [Google Scholar]
- [38].Zielinski JM, Hanley BF, Practical friction-based approach to modeling multicomponent diffusion, AIChE Journal, 45 (1999) 1–12. [Google Scholar]
- [39].Foster KR, Cheever E, Leonard JB, Blum FD, Transport properties of polymer solutions. A comparative approach, Biophysical journal, 45 (1984) 975. [DOI] [PMC free article] [PubMed] [Google Scholar]
- [40].Flory PJ, Principles of polymer chemistry, Cornell University Press, 1953. [Google Scholar]
- [41].Stull DR, Vapor Pressure of Pure Substances. Organic and Inorganic Compounds, Industrial & Engineering Chemistry, 39 (1947) 517–540. [Google Scholar]
- [42].Sheehan CJ, Bisio AL, Polymer/Solvent Interaction Parameters, Rubber Chemistry and Technology, 39 (1966) 149–192. [Google Scholar]
- [43].Schuld N, Wolf BA, Solvent quality as reflected in concentration- and temperature-dependent Flory–Huggins interaction parameters, Journal of Polymer Science Part B: Polymer Physics, 39 (2001) 651–662. [Google Scholar]
- [44].Kamide K, Sugamiya K, Kawai T, Miyazaki Y, The Concentration Dependence of the Polymer–Solvent Interaction Parameter for Polystyrene–Methylcyclohexane System, Polymer Journal, 12 (1980) 67. [Google Scholar]
- [45].Lindvig T, Michelsen ML, Kontogeorgis GM, A Flory–Huggins model based on the Hansen solubility parameters, Fluid Phase Equilibria, 203(1–2) (2002) 247–260. [Google Scholar]
- [46].Laksmana FL, Kok PJAH, Vromans H, Van K der Voort Maarschalk, Predicting the diffusion coefficient of water vapor through glassy HPMC films at different environmental conditions using the free volume additivity approach, European Journal of Pharmaceutical Sciences, 37 (2009) 545–554. [DOI] [PubMed] [Google Scholar]
- [47].Vrentas J, Duda J, Lau M, Solvent diffusion in molten polyethylene, Journal of Applied Polymer Science, 27 (1982) 3987–3997. [Google Scholar]
- [48].Vrentas JS, Jarzebski CM, Duda JL, A Deborah number for diffusion in polymer-solvent systems, AIChE Journal, 21 (1975) 894–901. [Google Scholar]
- [49].Houska K, Valchar J, Viktorin Z, Computer-aided design of dryers, in: Mujumdar AS (Eds.), Advances in drying, 4 (1987), pp. 1–95. [Google Scholar]
- [50].McCabe WL, Smith JC, Harriott P, Unit operations of chemical engineering, McGraw-hill, New York, 1993. [Google Scholar]
- [51].Seader JD, Henley EJ, Separation process principles, John Wiley and Sons, Hoboken (NJ), 2006. [Google Scholar]
- [52].Schmidt-Hansberg B, Baunach M, Krenn J, Walheim S, Lemmer U, Scharfer P, Schabel W, spatially resolved drying kinetics of multi-component solution cast films for organic electronics, Chemical Engineering and Processing: Process Intensification, 50 (2011) 509–515. [Google Scholar]
- [53].Fuller EN, Schettler PD, Giddings JC, New method for prediction of binary gas-phase diffusion coefficients, Industrial & Engineering Chemistry, 58 (1966) 18–27. [Google Scholar]
- [54].Tsilingiris PT, Thermophysical and transport properties of humid air at temperature range between 0 and 100°C, Energy Conversion and Management, 49 (2008) 1098–1110. [Google Scholar]
- [55].Chilton TH, Colburn AP, Mass transfer (absorption) coefficients prediction from data on heat transfer and fluid friction, Industrial & engineering chemistry, 26 (1934) 1183–1187. [Google Scholar]


