Abstract
We have constructed a spatio-temporal model of Ca2+ dynamics in parotid acinar cells, based on new data about the distribution of inositol trisphophate receptors (IPR). The model is solved numerically on a mesh reconstructed from images of a cluster of parotid acinar cells. In contrast to our earlier model (Sneyd et al., 2017b) , which cannot generate realistic Ca2+ oscillations with the new data on IPR distribution, our new model reproduces the Ca2+ dynamics observed in parotid acinar cells. This model is then coupled with a fluid secretion model described in detail in a companion paper: A Mathematical Model of Fluid Transport in an Accurate Reconstruction of a Parotid Acinar Cell, Vera-Sigenza E, Pages N, Rugis J, Yule DI, Sneyd J. 2018.
Based on the new measurements of IPR distribution, we show that Class I models (where Ca2+ oscillations can occur at constant [IP3]) can produce Ca2+ oscillations in parotid acinar cells, whereas Class II models (where [IP3] needs to oscillate in order to produce Ca2+ oscillations) are unlikely to do so. In addition, we demonstrate that coupling fluid flow secretion with the Ca2+ signalling model changes the dynamics of the Ca2+ oscillations significantly, which indicates that Ca2+ dynamics and fluid flow cannot be accurately modelled independently. Further, we determine that an active propagation mechanism based on Calcium Induced Calcium Release (CICR) channels is needed to propagate the Ca2+ wave from the apical region to the basal region of the acinar cell.
Keywords: Calcium dynamics, Inositol Triphosphate Receptors, Fluid Secretion, Finite Element modeling, Parotid acinar cells
1. Introduction
The parotid glands are one of the principal pairs of exocrine glands responsible for saliva secretion. Parotid acinar cells are the cells responsible for saliva secretion and are organised in a clustered fashion in order to form a fluid-collecting region called the acinar lumen. Their secretion is commonly referred to as primary saliva. After its collection in the acinar lumen, the fluid is deposited into the ducts of the gland where its electrolyte composition is altered.
A particular property of parotid acinar cells is that their membrane is polarised. The basal region faces the extracellular space, whereas the apical membrane faces the acinar lumen. The apical membrane is defined to be the section of the membrane bordered by the tight junctions. Ca2+ signals modulate the conductance of apical Ca2+-dependent Cl− channels and basal Ca2+-dependent K+ channels to generate an ionic gradient from the interstitial space to the lumen, which water follows by osmosis.
Upon olfactory and gustatory stimuli, agonists bind to receptors in the basal and lateral membrane of acinar cells leading to the oscillation of cytosolic [Ca2+]. The mechanisms behind this process can be seen in Fig. 1. First the agonists bind to cell membrane receptors, resulting in the production of a chemical messenger, inositol trisphosphate (IP3), in the basal region. IP3 then diffuses to the apical region, triggering the IP3 receptors (IPR) which release Ca2+ from the endoplasmic reticulum (ER) to the cytosol. The sarco/endoplasmic reticulum Ca2+ ATPase (SERCA) pumps then transport the Ca2+ from the cytosol back to the ER.
Fig. 1:
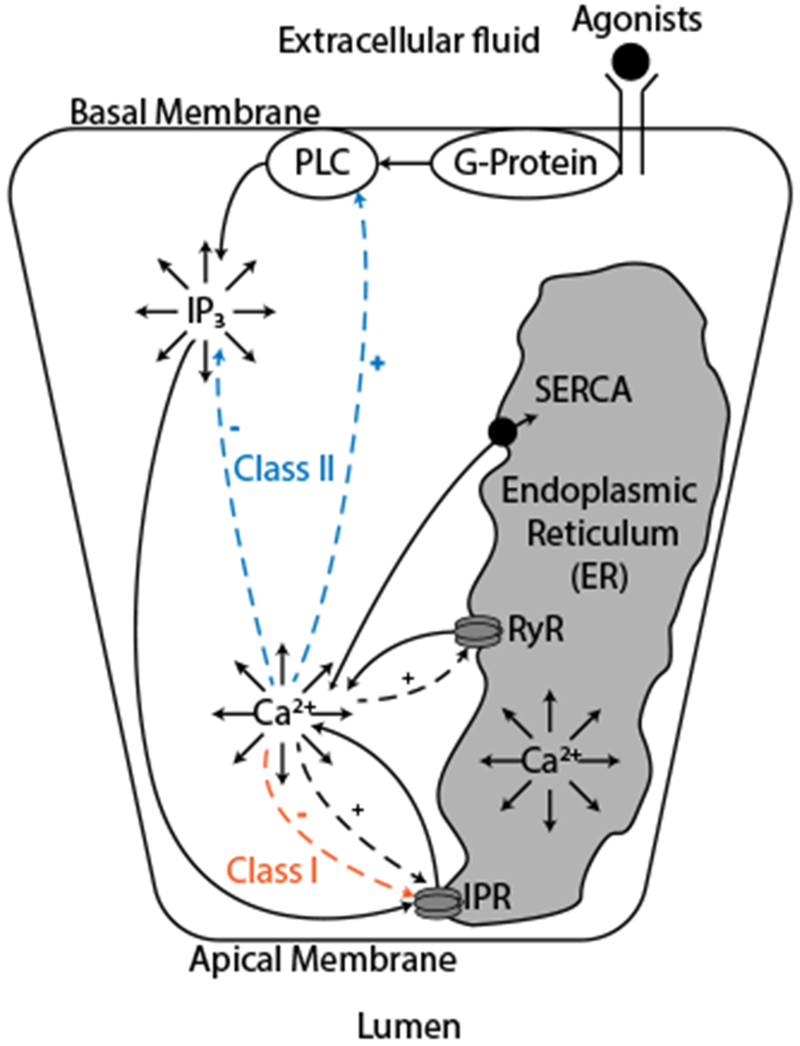
Mechanisms underlying oscillations of intracellular [Ca2+]. The binding of agonists to basal membrane G-protein coupled receptors leads to the activation of phospholipase C (PLC) and triggers the production of inositol trisphosphate (IP3). This cascade of events happens only close to the basal membrane because the precursor of IP3 is bound to the membrane. IP3 then diffuses everywhere in the cell and reaches the IP3 receptors (IPR) close to the apical membrane, releasing Ca2+ from the endoplasmic reticulum (ER) into the cytosol. Those Ca2+ ions then diffuse through the cell, act on the production and degradation of IP3 and act on the rate of Ca2+ released by IPR and the ryanodine receptors (RyR). SERCA pumps transport the Ca2+ from the cytosol into the ER at the expense of ATP. The Ca2+ has a fast positive feedback on the IPR and a slow negative feedback on the IPR (red). The slow feedback is the main mechanism underlying oscillations in so-called Class I models. The effects of Ca2+ on the production and degradation of IP3 (blue) are the main mechanisms for oscillations in so-called Class II models.
There are two main classes of models of Ca2+ oscillations involving IPR (Sneyd et al., 2006). In Class I models (De Young and Keizer, 1992; Dupont and Erneux, 1997; Sneyd et al., 2017a), the principal mechanism underlying oscillations is a sequential fast positive then slow negative feedback of Ca2+ on the IPR. After an initial increase of [Ca2+], the IPR will release even more Ca2+ in the short term and then will be inhibited, which will reduce the flow of Ca2+ delivered by the IPR. Ca2+ is then removed from the cytosol by the SERCA pumps and the cycle can start again. In this case Ca2+ oscillations can occur at a constant [IP3], although a constant [IP3] is not required.
In Class II models (Gaspers et al., 2014; Politi et al., 2006; Sneyd et al., 2017b), the [IP3] must also oscillate in order to achieve Ca2+ oscillations. In this case, the oscillatory mechanism is Ca2+ feedback on IP3 production and degradation. Ca2+ has a positive feedback on PLC, (Harootunian et al., 1991), which leads to an increase in [IP3] and a negative feedback on IP3 production through activation of protein kinase C (PKC) which leads to phosphorylation of PLC (Harootunian et al., 1991), terminating the production of IP3. Ca2+ also has a positive feedback on the IP3 degradation mechanisms (Dupont and Erneux, 1997). This, in turn, leads to a decrease in [IP3]. Those different feedbacks can give rise to Ca2+ oscillations. In the study of Ca2+ oscillations, one of the most important goals is the identification of the feedback mechanisms that generate the oscillations, and thus it is important to determine whether or not an oscillation is generated by a Class I mechanism, a Class II mechanism, a combination of both, or something else entirely.
Parotid acinar cells are spatially inhomogeneous: the distribution of Ca2+ channels in each cell is non-homogeneous, the ion channels are different on the apical and basal membranes, and IP3 is produced only in the basal region. In this article, we show that the structure of the parotid acinar cell imposes severe constraints on the possible mechanisms driving Ca2+ oscillations. In addition we propose a model of Ca2+ oscillations in parotid acinar cells, that is valid on an accurate representation of those cells and show that, when our Ca2+ model is coupled to an existing model of fluid transport in parotid acinar cells, physiological amounts of fluid are transported.
Several spatial models have been proposed to replicate oscillations of Ca2+ that arise from agonist stimulation in parotid acinar cells (Sneyd et al., 2003, 2017b). In Sneyd et al. (2003) a Class I mechanism is proposed and the cell is modelled as being one-dimensional with different regions: apical, mitochondrial and basal. Sneyd et al. (2017b) propose a Class II model on an anatomically accurate three-dimensional mesh of a parotid acinar cell; the mesh of the cells and the lumen were reconstructed from physiological data and the distribution of the IPR and of the proteins creating the IP3 have been estimated using physiological data. However, new experimental data on the distribution of the IPR in parotid acinar cells show that the region containing most of the IPR is much thinner than previously thought and extends to only about 50 nm from the apical membrane (previous models assumed that IPR were situated up to 4 μm from the apical membrane). The structure of the IPR distribution appears to be crucial for the oscillatory mechanism; when the model proposed in Sneyd et al. (2017b) is simulated using the updated distribution of IPR in the cells it can no longer produce oscillations. This is because the release of Ca2+ is in such a small region of the cell that the feedback of Ca2+ on IP3 degradation is very limited and cannot by itself generate Ca2+ oscillations. A new model is thus needed, based on an oscillatory mechanism consistent with the spatial structure of the cell.
In this paper, first we show the new data on the distribution of IPR in parotid acinar cells. Then we present the spatial structure of the cell with the particularities of the apical and basal regions and the meshes we used for the computation. The method used to create the meshes is described in the appendix. Further we describe our new model of Ca2+ dynamics as well as the coupling of the model with the fluid flow model described in the companion paper (Sigüenza et al., 2018b). Finally we present the results of our simulations, studying the behaviour of the apical region and showing the importance of an active propagation mechanism for the Ca2+ wave and the coupling with the fluid flow model.
2. Experimental data
2.1. Distribution of the IPR
In exocrine acinar cells IPR are mainly expressed in the apical region (Kasai et al., 1993; Lee et al., 1997; Nathanson et al., 1994; Thorn et al., 1993; Yule et al., 1997). TMEM16a Ca2+-activated Cl− channels and KCa1.1 and KCa3.1 Ca2+-activated K+ channels are also expressed in this region. Numerous studies have used confocal imaging to show that those proteins essentially co-localize despite being in separate membranes. However, with the limited precision due to the diffraction of light in confocal imaging, the only conclusion that can be reached from these data is that those various proteins are located within 200 nm of each other.
We acquired data using the Leica STED system (Fig. 2). The 3D STED capability facilitated imaging over a relatively large distance vertically (7 μm), which was necessary to localize populations of IPR and TMEM16a because the structure is invaginated.
Fig. 2:
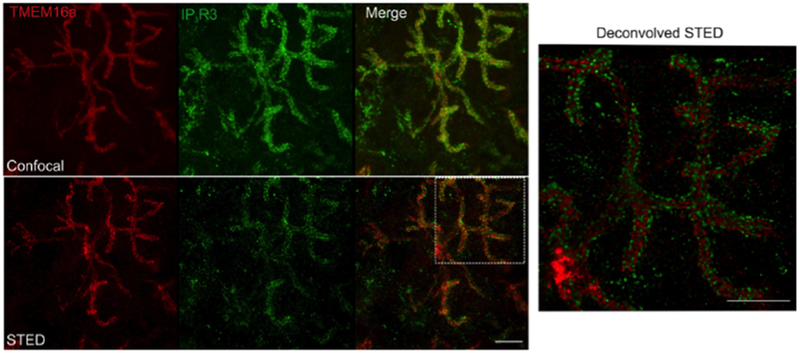
Upper panel: maximum projection of a confocal z stack (7 μm) showing TMEM16a and type 3 IPR. The entire section was 80 μm thick. Lower panel: maximum projection of a Stimulated Emission Depletion (STED) image. The STED image clearly shows that the proteins have distinct localization. Right panel: Huygens deconvolution of the boxed region of the STED merged image. Scale bars= 5 μm.
This allows us to clearly resolve the TMEM16a distribution on the apical membrane and the IPR distribution on the ER membrane. Those new data show that IPR and TMEM16a are rarely further than 100 nm apart from each other and the two proteins reside within 50 nm most of the time. Further, both proteins appear to be clustered as puncta, rather than as homogeneous distributions in their respective membranes, suggesting the proteins are distributed to smaller specialized regions, possibly through tethering or anchoring.
2.2. Experimental Stimulation
In order to compare our simulations to real data, we induced Ca2+ oscillations in parotid acinar cells. These, previously unpublished, data can be seen in Fig. 3 and in the supplementary material. Excised parotid gland lobules were loaded with 5 μM fluo4 and mounted in a superfusion chamber on the stage of an Olympus FV1000 multiphoton microscope. The Ca2+ indicator was excited by a Mai Tai femtosecond pulsed laser at 880 nm and emission measured at >510 nm. The lobule was exposed to the IP3-generating agonist, Carbachol (300 nM) resulting in the oscillatory changes in fluorescence observed for the duration of the agonist exposure. Figure 3 shows the fluorescence ratio before and after the exposure of the cell to Carbachol. The oscillations are above the resting baseline with a period of about 10 seconds.
Fig. 3:
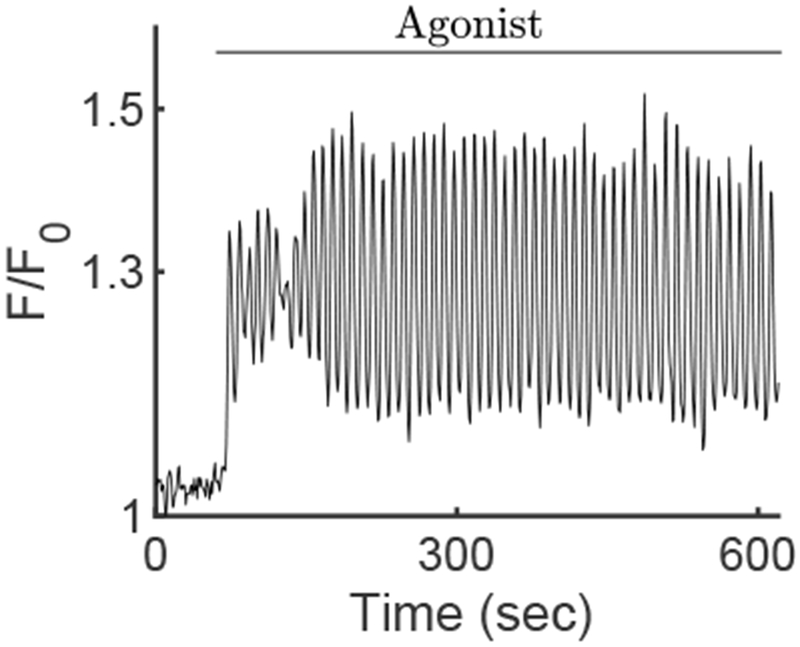
Time series of the mean fluorescence of the Ca2+ indicator Fluo-4, averaged over the whole cell. Ca2+ oscillations appear after the exposure of the cell to Carbachol. These data have been extracted from a movie given in the supplementary material.
3. Spatial organization of the cell
We run our simulations on a domain which represents accurately some actual parotid acinar cells. To do that we use meshes extracted from the same data used by Sneyd et al. (2017b) and constructed by the method described in the appendix. The meshes used for the computation of the finite element scheme were constructed using z stacks of confocal images of parotid tissue, with staining of the basal Na/K ATPase and the apical TMEM16a Cl channel. The method described in the appendix takes into account the fact that parotid acinar cells are organized in clusters and thus the cellular meshes have conformal common surfaces. The distribution of curvature of the meshes is approximately determined by the distribution of the curvature in the data to generate a more realistic representation of the cells. The result is a finite element mesh of a cluster of parotid acinar cells as depicted in Fig. 4. From those data we also extracted a mesh of the lumen.
Fig. 4:
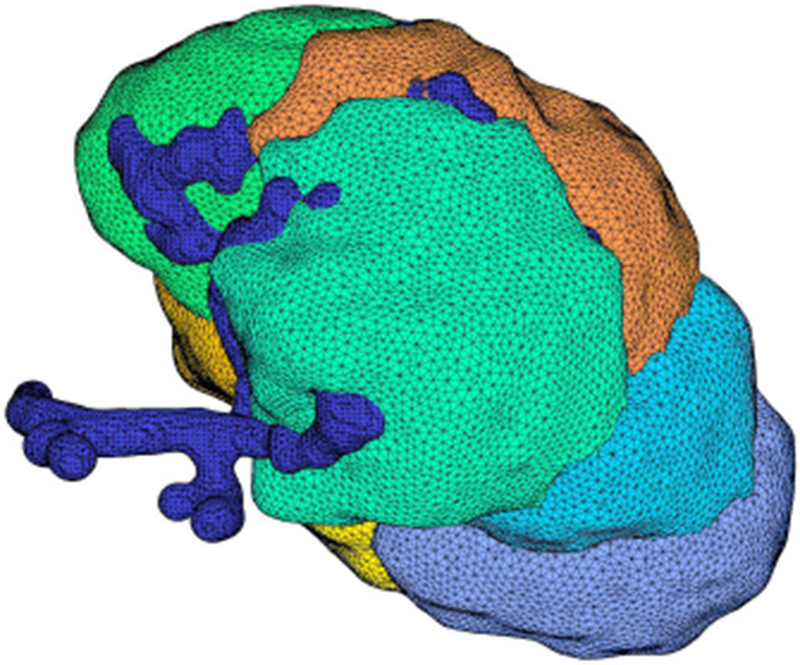
Mesh for a cluster of seven cells. Each cell is shown in a different color and the blue tubular structure is the lumen. This cluster has been reconstructed from a z-stack of images and smoothed according to the process described in the appendix.
The apical membrane of the cell is defined as the region of the plasma membrane between the tight junctions, where the Cl− channels TMEM16a are situated. The apical membrane in each cell mesh is defined as the intersection of the common surfaces of the cell mesh and the lumen mesh. According to the data on the distribution of the IPR in the cells, described in the previous section, we need to represent the IPR in a region 50 nm deep from the apical membrane into the cell. This region is so thin that we cannot properly take it into account as a volume using our mesh. To do so would mean either greatly increasing the resolution of the mesh which would lead to a high computational cost, or overestimating the region where the IPR are. To overcome this issue we treat all IPR Ca2+ fluxes as boundary fluxes. Figure 5 shows the apical and basal membranes in a volumetric mesh of one of the cells. The apical region is the critical driving region for Ca2+ oscillations; the oscillations start there when Ca2+ is released by the IPR from the ER and oscillations in the rest of the cell then follow (Nezu et al., 2015). At low agonist concentration, oscillations are sometimes limited to the apical region (Tojyo et al., 1997).
Fig. 5:
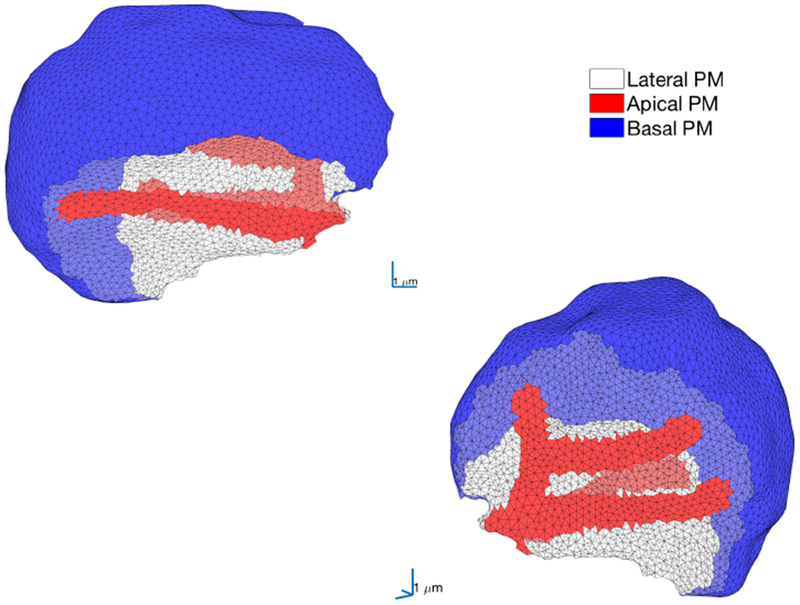
Two views of the volumetric mesh of a single parotid acinar cell, chosen arbitrarily from the group of seven cells presented in Fig. 4. The basal membrane is shown in blue, the apical membrane is shown in red and the lateral region is in white. This arbitrarily chosen cell is used for the majority of the computations in this paper. Computations in other cells are presented in 6.7 and in the supplementary material.
The basal and lateral membrane where the agonists bind to the G-protein-coupled receptors (GCPR) faces the exterior of the cluster of cells. Also present on that membrane will be Cl− channels, K+ channels and Na-H exchangers for controlling saliva secretion. After the coupling of the agonist to the GCPR, G proteins are activated, which activate PLC leading to the production of IP3. Even though PLC is present throughout the cytoplasm we assume that this reaction occurs only near the basal membrane because the IP3 precursor is membrane-bound.
4. New model
As discussed above, previous models could no longer produce oscillations after the spatial location of the IPR had been modified to match the experimental data. This motivated us to construct a new model that can reproduce Ca2+ oscillations with those new constraints. Based on earlier results (Sneyd et al., 2006), it has been common to assume that pancreatic acinar cells, and by extension parotid acinar cells, are driven primarily by Class II mechanisms. However, in a more recent paper (Sneyd et al., 2017a), it was shown that a Class I mechanism could reproduce features of the dynamics seen in experimental data. We use a Class I model here, because a Class II model failed to produce oscillations. A Class I model does not depend on the feedback of [Ca2+] on IP3 production and degradation, so even if the regions where Ca2+ is released and the [Ca2+] feedback happens are far apart, or if the feedback happens only locally, oscillations can still occur.
The generation of oscillations in a Class I model is necessarily limited to the apical region, where most of the IPR are situated. Although this is consistent with some experimental evidence showing oscillations that are restricted to the apical region (Tojyo et al., 1997) such a mechanism cannot by itself, explain the periodic intracellular waves that are often observed travelling from the apical to the basal region (Nezu et al., 2015). Therefore the model must include a mechanism that can propagate the wave from the apical to the basal region.
Parotid acinar cells can produce Ca2+ oscillations for multiple oscillation periods without exchange of Ca2+ with the exterior of the cell (Bruce et al., 2002). For simplicity our three dimensional model is a closed cell model, because, in both experiment and the model, we can get oscillations without the external exchanges. Although this means that oscillations can occur without any flux of calcium across the plasma membrane, it does not mean that such fluxes have no effect on the properties of the oscillations. Thus, we will also study briefly the impact of an open-cell model on the fluid flow using an homogenised version of the model.
4.1. IPR dynamics
We model the IPR dynamics according to Sneyd et al. (2017a). The open probability of the channel is given by
| (1) |
where
| (2) |
| (3) |
with c and p representing, respectively, the concentration of Ca2+ and IP3 in the cytosol. h is a variable that controls the delay between the activation of the IPR and the negative feedback of Ca2+ on the IPR. The other functions are defined as
| (4) |
| (5) |
| (6) |
The dynamics of h is given by
| (7) |
where
| (8) |
4.2. SERCA pump
SERCA pumps transport free Ca2+ from the cytosol to the ER at the cost of ATP hydrolysis. The model for this pump can be unidirectional, which means that the pump only takes Ca2+ from the cytosol to the ER. In that case a leak from the ER is required to ensure that the ER [Ca2+] remains bounded at rest. Alternatively, the pump can be made bidirectional by assuming that the reaction can proceed in reverse as proposed in MacLennan et al. (1997). In that case the model for the SERCA pump is similar to the one proposed in Sneyd et al. (2017a). We assume a bidirectional SERCA pump and write the flux as
| (9) |
where Vp is the maximum forward velocity of the pump.
4.3. IP3 dynamics
The model that we propose takes into account the production and degradation of IP3. [IP3] is, in general, treated as a parameter in Class I models, because in such models [IP3] does not need to oscillate in order to have Ca2+ oscillations. However, we know that in HSY cells, which are closely related to parotid acinar cells, the [IP3] oscillates along with the [Ca2+] (Tanimura et al., 2009); although this has not yet been shown to be the case in parotid acinar cells, we treat [IP3] as a variable in our model.
There are several mechanisms for Ca2+ feedback on IP3 production and degradation. The activity of PLC is sensitive to [Ca2+], as has been shown in fibroblasts (Harootunian et al., 1991; Politi et al., 2006) or other types of cells (De Young and Keizer, 1992). Our model of this feedback is based on the models proposed in Penny et al. (2014); Politi et al. (2006) and De Young and Keizer (1992):
| (10) |
where μ represents the spatial distribution of the maximal rate of IP3 production, and KPLC is the half-saturation constant. This whole process takes place only near the basal membrane as explained in the previous section. To model the PLC distribution we consider that PLC can be activated at any point closer than a distance dPLC from the basal membrane (Fig. 6A) and further than a distance dlPLC to the lumen. The distance dlPLC is included to ensure that the PLC is not activated too close to the lumen in the simulations, so we have an effective separation between the apical and the basal regions. This last condition has been added because during the reconstruction of the meshes it happened that the basal and apical membrane were sometimes partially superimposed (see cell 1 in the supporting material). This might be due to cells missing in the imaging data or artefacts from the optical slicing. We can write μ as
| (11) |
where db(x) and da(x) represent, respectively, the distance of point x to the basal and apical regions.
Fig. 6:
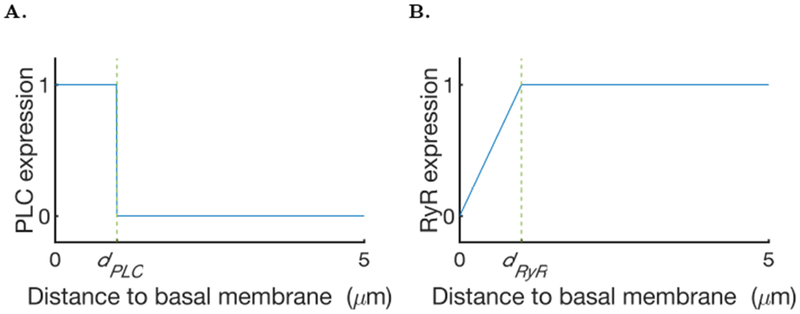
A: Model of the distribution of PLC. B Ryanodine receptor density model as a function of the distance to the lumen.
Degradation of IP3 in the cell occurs by two different mechanisms. Either IP3 is dephosphorylated by IP3-5-phosphatase or it is phosphorylated by IP3-3-kinase to create IP4 (Dupont and Erneux, 1997). The dephosphorylation of IP3 is not Ca2+ sensitive, whereas its phosphorylation is Ca2+ sensitive, but only triggered at high [Ca2+] (Politi et al., 2006). Thus, we model IP3 degradation by
| (12) |
where V5K is the degradation of IP3 by dephosphorylation by the IP3-5-phosphatase, V3K is the maximum degradation of IP3 by phosphorylation by IP3-3-kinase and K3K is the sensitivity of the latter degradation to [Ca2+]. In contrast to IP3 production, IP3 degradation takes place everywhere in the cell.
4.4. Wave propagation model
In order to investigate how the Ca2+ wave is propagated from the apical region to the rest of the cell, we propose an active model of wave propagation. The presence of RyR in parotid acinar cells has been demonstrated in studies by Zhang et al. (1997) and has been suggested to explain the propagation of Ca2+ from the apical to the basal and lateral regions (Bruce et al., 2002; Leite et al., 2002). However, the limited expression of the IPR with low affinity to IP3 outside the apical region could also be a mechanism involved in the propagation of the Ca2+ wave (Kasai et al., 1993; Thorn et al., 1993). Here we propose a model based on the distribution and the behaviour of RyR; but the final dynamics rely only on the behaviour of Calcium Induced Calcium Release (CICR) channels with slow negative feedback from Ca2+, which is not specific to the RyR and could describe IPR with low affinity to IP3.
RyR are expressed everywhere in the cell, but are less dense close to the apical membrane (Zhang et al., 1999). To model their inhomogeneous expression in the cell we consider the density of RyR as a function of the distance to the apical membrane; from the apical membrane the RyR density grows linearly up to a distance dRyR and then reaches a plateau (Fig. 6B).
Based on data from sympathetic neurons, Friel (1995) proposed a simple model, with no time dependence, for the RyR. RyR have also been heavily studied in cardiac muscle cells, because they are a key component of the Ca2+ dynamics in those cells. In those cells a first influx of Ca2+ triggers a fast and large influx of Ca2+ from the RyR and then this release spontaneously terminates. This behaviour has been modelled by Stern et al. (1997) using a Markov chain and by Keizer and Levine (1996). Here we take an approach similar to Keizer and Levine (1996) and simply use a single additional variable, g, to model the inactivation of the RyR:
| (13) |
where Jwav represents the Ca2+ influx from the ER to the cytosol via the RyR, Kwav1 is the sensitivity of the channel and g∞ is defined by
| (14) |
Thus, our wave propagation model is a purely phenomenological model, designed solely to generate a Ca2+ wave from the apical to the basal region. It is similar in structure to our IPR model, with sequential positive and negative feedback from the cytosolic Ca2+ and could, in principle, be replaced by any excitable system capable of propagating a wave.
4.5. Open-cell model
The spatial model is considered a closed-cell model. However, it is important to know if external exchanges of Ca2+ would affect the shape of the oscillations or the fluid flow. To do so we included three additional Ca2+ channels: Store Operated Calcium Channels (SOCC), Receptor Operated Calcium Channels (ROCC) and plasma membrane Ca2+ ATPase (PMCA) pumps.
The SOCC model is the one used in Sneyd et al. (2017a):
| (15) |
with α0 the constant leak of Ca2+ from the exterior of the cell to the cytosol, α1 the maximum rate of the SOCC and Ke the sensitivity of the SOCC to [Ca2+] in the ER.
The ROCC model is the one theorized in Dupont and Goldbeter (1993) and used in Palk et al. (2010):
| (16) |
where α2 is the agonist-dependent influx.
The PMCA model is the one used in Sneyd et al. (2017a):
| (17) |
where VPM is the maximum Ca2+ flux through the PMCA and KPM is the half activation.
4.6. Complete spatial model
We model the movement of Ca2+ and IP3 in the cell with diffusion. Dc, De and Dp are, respectively, the diffusion coefficients, of Ca2+ in the cytosol, of Ca2+ in the ER and of IP3.
We assume that buffering occurs on a faster time scale than other processes in the model, that buffers are immobile and that they have low affinity. So, all fluxes are effective fluxes; for more details see Dupont et al. (2016).
The ER is modelled as being everywhere in the cell, but with a smaller volume than the cytosol. γ represents the ratio between the cytosolic volume and the ER volume.
Our model is then written in two parts: on the interior of the cell
| (18) |
and on the apical membrane
| (19) |
5. Coupling with saliva secretion and volume change
Release of Ca2+ from the ER into the cytosol modulates the opening of apical Cl− channels and basal K+ channels. This modulates the Cl− gradient between the lumen and the interstitium and water follows by osmosis. This process has been modelled in Sigüenza et al. (2018a), by taking into account several other ionic exchangers and channels to reproduce the saliva flow after an increase in [Ca2+]. The model keeps track of the main ionic species concentrations, relevant to water transport, in the interstitium, the cytosol and the acinar lumen.
The volume of the parotid acinar cell decreases during the transport of water from the interstitium to the lumen (Krane et al., 2001). This change of volume affects the concentrations of Ca2+ and IP3 inside the cell and consequently the Ca2+ oscillations. Hence, a model for Ca2+ oscillations in a parotid acinar cell cannot be solved independently of a model of volume control.
In this paper there is insufficient space to give a complete description of our model for fluid transport by a three-dimensional parotid acinar cell, and so all the details of our fluid transport model can be found in the companion paper (Sigüenza et al., 2018b). Here, we just give a brief description of how changes in volume (which are caused by the fluid transport) are incorporated into the Ca2+ oscillation model. In constructing our model we assume that changes in volume affect the cell uniformly, so both the cytosol and the ER are affected in a similar fashion.
The modified equations are
| (20) |
where Ω(t) is the volume of the cell, Jin is the Ca2+ influx into the cytosol expressed as number of ions per second and Jout is the Ca2+ efflux from the cytosol expressed as number of ions per second.
We can then rewrite equation (20) as follows:
| (21) |
Complete details of the saliva secretion model can be seen in the supporting material and in the companion paper (Sigüenza et al., 2018b).
6. Results
6.1. A homogeneous model
In order to understand the dynamics of the model, we study it in a simplified framework, i.e., in a case of an homogeneous cell. In this case, we assume that diffusion is infinitely fast inside the cell, that the distribution of the IPR is homogeneous as well as the distribution of Ca2+ channels involved in the wave propagation mechanism and the PLC. Note that this homogeneous version of the model can be considered a simplified model of the apical region of the cell. Since whole-cell oscillations are driven by the apical region, analysis of this homogeneous version of the model will give some insight into when whole-cell oscillations might exist. The Ca2+ part of the homogeneous model is given by:
| (22) |
The ce equation disappears because the cell is closed, and is replaced by an algebraic condition between ct, c and ce. The dynamics of the volume is given in the companion paper Sigüenza et al. (2018b).
Simulations of a homogeneous model allow us to determine the order of magnitude of the agonist stimulation for which there can be oscillations in the cell. We then use those results as a guide for our complete spatial model. We also use the homogeneous model to verify the impact of external Ca2+ exchange. The [Ca2+] time series of the stable periodic orbit for μ = 0.0013 is shown in Fig. 7.
Fig. 7:
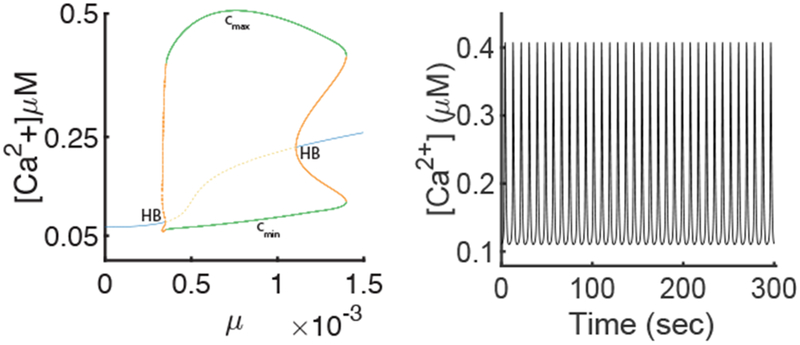
A: Bifurcation diagram of the model of the apical region (Eq 22). The blue and the yellow dashed curves indicate, respectively, stable and unstable equilibria. The green, respectively orange dashed, curves show the maximum (the cmax branch) and minimum (the cmin branch) values of [Ca2+] on the stable, respectively saddle, periodic orbit. HB is a Hopf bifurcation. B: Time series for [Ca2+] of the stable periodic orbit from panel A for μ = 0.0013.
Varying μ in our model is equivalent to changing the level of agonist stimulation of the cell. Figure 7 shows a bifurcation diagram for the apical model, when varying μ. The model has a branch of periodic orbits that begins and ends at Hopf bifurcations. This bifurcation diagram is consistent with previous results for related models (Politi et al., 2006; Sneyd et al., 2017b), as well as with the behaviour observed experimentally; stable oscillations are observed for an interval of μ values (see Fig. 7).
6.2. Impact of the external Ca2+ exchange
Exchanges of Ca2+ with the exterior of the cell might affect the [Ca2+] oscillations as well as the average fluid flow output of the cell. By modifying equations (22) to include the external Ca2+ exchanges given by equations (15), (16) and (17), we get the following system:
| (23) |
The [Ca2+] time series for μ = 0.013 is shown in Fig. 8. This time series is qualitatively similar to the one in Fig. 7 and has comparable period and amplitude.
Fig. 8:
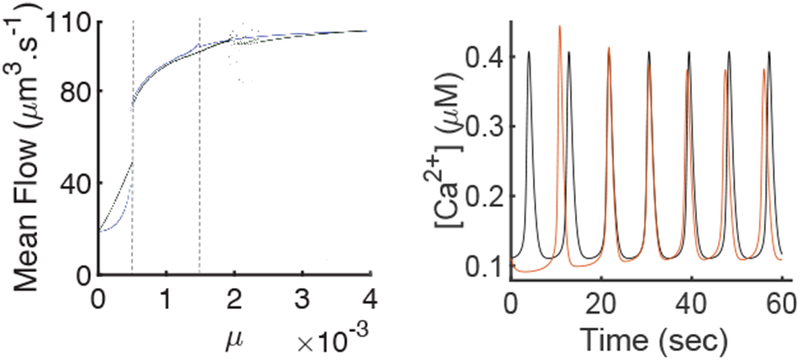
A: Comparison of the average fluid flow between the closed-cell model, in blue, (Eq. 22) and the open cell model, in black, (Eq. 23). To get each point of this graph we integrated the system numerically to get either a periodic orbit or an equilibria. In the case of a periodic orbit we computed the average fluid flow during one period and in the case of the equilibria we computed the constant fluid flow. The region between the two dashed lines is the region where both models have stable periodic orbits. The cloud of points in the right part of the open-cell model is due to periods of the solutions getting too long which induces errors in the estimations of the average fluid flow. B: Time series of [Ca2+] in the closed-cell model, in black, (Eq. 22) and the [Ca2+] in the open-cell model, in red, (Eq. 23) for μ = 0.0013. Both models are integrated from the same initial condition. We can see that the transient is different in the open-cell model, but the stable periodic orbits are similar.
The most important metric to understand the impact of the external exchanges of Ca2+ on the fluid flow rate is to look at the average fluid flow produced. Figure 8 shows the average fluid flow for the open and closed cell model for different values of μ. In the region in which both models have stable periodic orbits the average fluid flow is extremely similar.
The introduction of external Ca2+ exchange does not affect significantly the average fluid flow output. The properties of the Ca2+ oscillations are slightly changed as the transient is different as well as the amplitude. However, we consider those changes to be minor and we conclude that using an open-cell model is not necessary in order to model fluid flow.
6.3. The complete model
Our full model is spatially heterogeneous; IP3 is produced only close to the basal membrane, Ca2+ is released from the ER to the cytosol only close to the apical membrane, the mechanism that actively propagate the Ca2+ wave is not uniformly expressed and the ionic channels present on the apical and basal membrane are different. We simulated, with a finite element method on the mesh of each of the cells shown in Fig. 4, the complete spatial model. In this section we present only the results on the cell shown in Fig. 5; results from the other cells are available in the supporting material.
Figure 9 shows output from a typical simulation of the full model. Oscillations in [Ca2+] are observed, but these are not homogeneous in the cell; the spikes of concentration decrease with distance to the apical membrane. The behaviour of the Ca2+ oscillations is similar to the experimental result presented Fig. 3. Figure 10A shows the water flow of the model. Water flow oscillates with the same frequency as the Ca2+ oscillations.
Fig. 9:
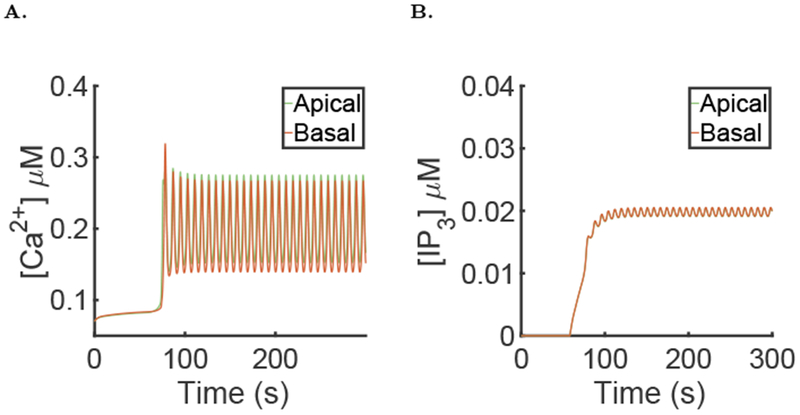
Results of the simulation of the full model with μ = 0 for the first 60 seconds then followed by μ = 0.007, with the parameter values given in the supporting material. A: Spatial mean [Ca2+] time series in the apical and basal region during a typical simulation of the full model. B: Spatial mean [IP3] time series in the apical and basal region during a typical simulation of the full model.
Fig. 10:
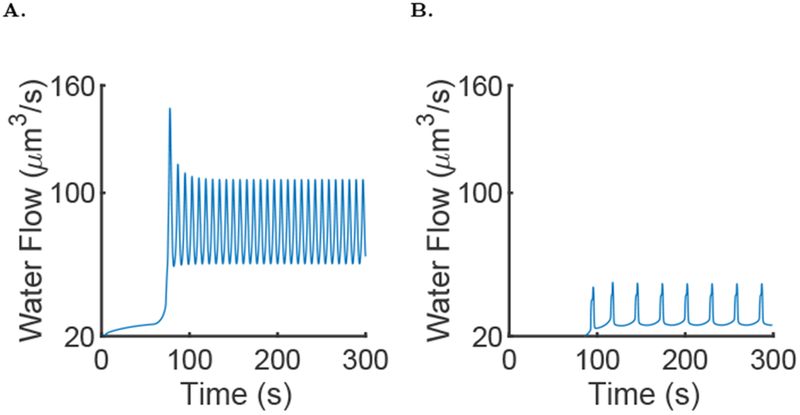
Results of simulation of the full model, with μ = 0 for the first 60 seconds then followed by μ = 0.007 and the parameters given in the supporting material A: Fluid flow in the full model during a typical simulation of the model. It is the same simulation as in Fig. 9. B: Fluid flow in the full model during a typical simulation with the active propagation knocked out.
The [IP3] in the cell is close to being homogeneous during the oscillations. Figure 9B shows the time series for [IP3] in the apical and basal regions; these two time series are essentially indistinguishable on the scale of the panel. For more details on the quantitative differences in the different simulations of this section refer to Table 1.
Table 1:
This table contains metrics on the [Ca2+] and [IP3] oscillations and the average fluid flow obtained in sections 6.3, 6.4, 6.5 and 6.6.
| Simulation | Normal (section 6.3) | De = 0.5(section 6.6) | Dp = 10 (section 6.6) | VRyR = 0 (section 6.4) | No Fluid flow (section 6.5) |
|---|---|---|---|---|---|
| Period (s) | 7.83 | 7.875 | 7.93 | 28.25 | 29.05 |
| Average fluid flow (μm3.s−1) | 79.5291 | 79.5824 | 79.8598 | 29.1078 | - |
| Average [IP3] in the apical region (μM) | 0.019885 | 0.019787 | 0.01917 | 0.014381 | 0.014628 |
| Average [IP3] in the basal region (μM) | 0.019953 | 0.019854 | 0.020996 | 0.014381 | 0.014658 |
| Average [Ca2+] in the apical region (μM) | 0.20511 | 0.20224 | 0.20404 | 0.0909 | 0.093435 |
| Maximum [Ca2+] in the apical region (μM) | 0.27498 | 0.27711 | 0.27699 | 0.18795 | 0.19375 |
| Minimum [Ca2+] in the apical region (μM) | 0.15266 | 0.14797 | 0.14931 | 0.082495 | 0.079097 |
| Average [Ca2+] in the basal region (μM) | 0.18591 | 0.18737 | 0.18671 | 0.078095 | 0.0801 |
| Maximum [Ca2+] in the basal region (μM) | 0.26674 | 0.27133 | 0.26878 | 0.092754 | 0.10316 |
| Minimum [Ca2+] in the basal region (μM) | 0.13931 | 0.13872 | 0.13848 | 0.076265 | 0.077053 |
The range of μ values where oscillations occur is different in the full model (Eqns. 18 and 19) than in the homogeneous model (Eqns. 22). This is because PLC does not produce IP3 uniformly in the cell, but only in the basal region, so a larger value of μ is needed in the heterogeneous model. However, the value of μ for which oscillations occur is of the same order of magnitude in both models. The period is around 7.83 seconds which is similar to the homogeneous model, with a period of 9 seconds The spikes in the apical region have amplitude close to 0.27 μM, which is lower than seen in the homogeneous model.
6.4. Importance of active wave propagation
To show the importance of a mechanism that actively transports the Ca2+ waves we simulated a knock-out of this mechanism by setting Vwav = 0. Figure 11A shows that in this case, the oscillations are still present in the cell. This is because the apical region is the driving region, so even if the [Ca2+] does not oscillate in the rest of the cell, there can still be oscillations in the apical region.
Fig. 11:
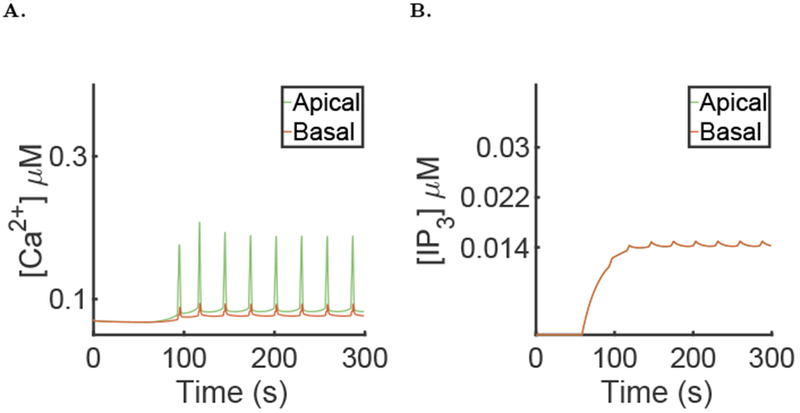
Results of the simulation of the full model, with μ = 0 for the first 60 seconds then followed by μ = 0.007, the parameters given in the supporting material and with active propagation knocked (Vwav = 0). A: Spatial mean [Ca2+] time series in the apical and basal regions during a typical simulation. B: Spatial mean [IP3] time series in the apical and basal regions during a typical simulation.
However, there are major differences without the active propagation of the wave. First, the amplitudes of the Ca2+ spikes in both the apical and basal regions are significantly decreased, and the period of the oscillation is significantly increased when the active propagation is removed (see Table 1). Second, the [IP3] (Fig. 11B) is on average lower; this could be explained by the fact that the positive feedback of Ca2+ on IP3 production happens only in the basal region. Thus, a lower [Ca2+] in the basal region means a lower [IP3]. Third, fluid flow is significantly affected by removing the active propagation mechanism; in the simulation shown in Fig. 10B, the fluid flow is halved when the active propagation is turned off. This is because K+ channels are present on the basolateral membrane and are Ca2+ sensitive. Thus, a lower [Ca2+] in the basal region means that the channels will not open and less water can flow through the cell.
These results show the importance of including in the model a mechanism for propagating the Ca2+ wave from the apical region to the basal region.
6.5. Importance of coupling with the fluid flow model
To show the importance of the coupling between the Ca2+ model and the fluid secretion model, we simulated the Ca2+ dynamics without computing the saliva secretion part. In this case the volume of the cell is constant and no parameters are changed from the reference simulation.
In that case Ca2+ oscillations are still present (Figure 12A), but their behaviour is changed significantly. The period of the oscillation is almost four times longer and the heights of the spikes in the apical and basal regions are reduced by around 30% and 60% respectively (see Table 1). The fact that the [Ca2+] in the basal region is significantly lower means that the effect of the active propagating model of the Ca2+ waves is amplified by the volume change.
Fig. 12:
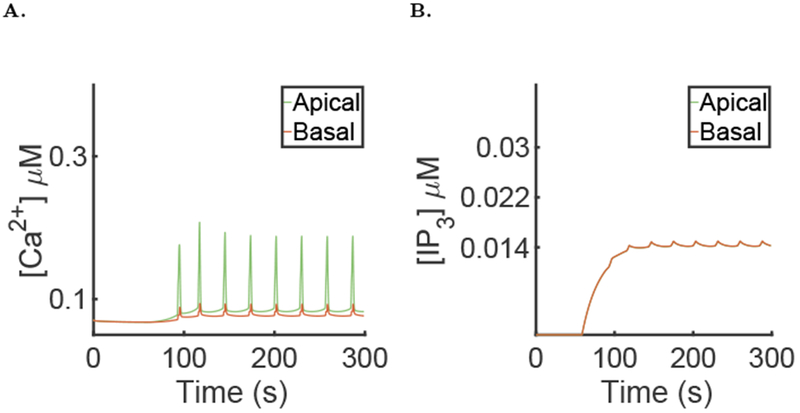
Results of the simulation of the model without fluid secretion (Eq 18 and 19), with μ = 0 for the first 60 seconds then followed by μ = 0.007 and the parameters presented in the supplementary material. A: Spatial mean [Ca2+] time series in the apical and basal regions during a typical simulation. B: Spatial mean [IP3] time series in the apical and basal regions during a typical simulation.
The amplitude of the [IP3] oscillation (Figure 12B) is also reduced compared with the simulations in which the cell volume is allowed to change. When water is transported by the cell, the volume of the cell diminishes which raises the [IP3].
The results that we get from a model without volume change are significantly different from the full model; using the same parameters, the height of the Ca2+ spikes, the average [IP3] and the frequency are substantially changed. We conclude that the dynamics of Ca2+ in parotid acinar cell cannot effectively be modelled independently from the saliva secretion process.
6.6. Influence of diffusion
In all previous simulations we considered the diffusion of Ca2+ in the ER to be the same as the diffusion of Ca2+ in the cytosol. However, previous studies (Means et al., 2006) suggest that the actual diffusion of Ca2+ in the ER is an order of magnitude slower than in the cytosol.
To verify the impact of the diffusion of Ca2+ in the ER we simulated the model using a value of De, the diffusion of Ca2+ in the ER, ten times smaller than Dc, the diffusion of Ca2+ in the cytosol. The results of the simulation can be seen Fig. 13 and characteristic metrics of the simulation can been seen in Table 1. The diffusion of Ca2+ in the ER seems to have little effect on the behaviour of our model.
Fig. 13:
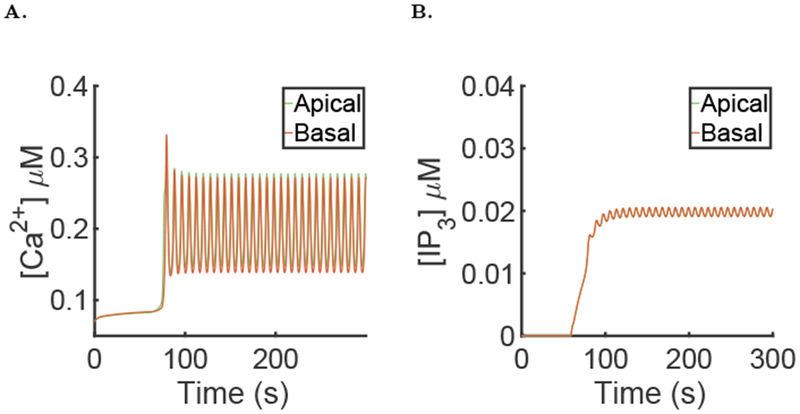
Results of the simulation of the full model with μ = 0 for the first 60 seconds then followed by μ = 0.007, using the diffusion coefficient of Ca2+ in the ER De = 0.5μm2.s−1 and the parameters values given in the supporting material. A: Spatial mean [Ca2+] time series in the apical and basal region during a typical simulation of the full model. B: Spatial mean [IP3] time series in the apical and basal region during a typical simulation of the full model. The basal and apical curves are almost identical and superimposed.
A recent study (Dickinson et al., 2016) suggest that the diffusion of IP3 in the cytosol is not Dp = 283 μm2s−1 but much smaller, around Dp = 10 μm2s−1. We tried this lower values in our model and the results can be seen Fig. 14, with characteristic metrics of the simulation presented in Table 1. We see that the [Ca2+] oscillations have similar period, shapes and amplitude and that the average fluid flow is also similar. The only difference is that now the [IP3] is not homogeneous any more inside the cell and that the [IP3] in the basal region is larger than in the apical region. This is explained by the fact that PLC is restricted to the basal membrane.
Fig. 14:
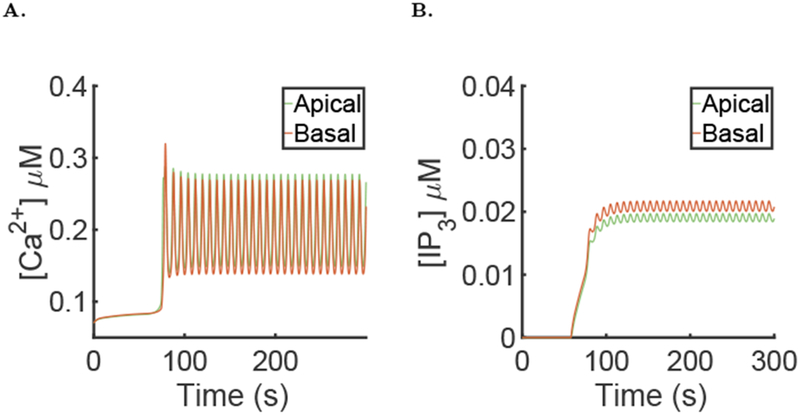
Results of the simulation of the full model with μ = 0 for the first 60 seconds then followed by μ = 0.007, using the diffusion coefficient of IP3 Dp = 10μm2.s−1 and the parameters values given in the supporting material. A: Spatial mean [Ca2+] time series in the apical and basal region during a typical simulation of the full model. B: Spatial mean [IP3] time series in the apical and basal region during a typical simulation of the full model.
6.7. Results from other cells
The data that we used to reconstruct the cell mesh used in the simulations of the full model shown above were from a cluster of seven parotid acinar cells, so we have six other cells on which we can test our model. Figure 15 shows the mesh for another cell. The simulation results from this cell are shown in Fig. 16. Note that, because of the structural differences between the cells, the average [IP3] is higher and the average [Ca2+] in the apical region is higher. The [Ca2+] time series, [IP3] time series and periods for each of the other cells are available in the supporting material. The fluid flow in the other cells is described in the companion paper (Sigüenza et al., 2018b).
Fig. 15:
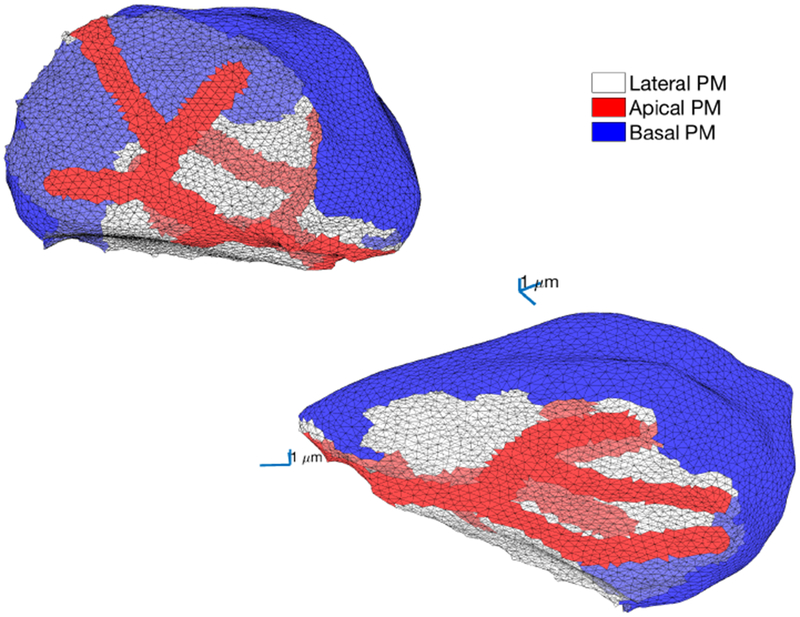
Two views of the apical and basal membranes of another parotid acinar cell, from the mesh presented in Fig. 4. The basal membrane is shown in blue, the apical membrane is shown in red and the lateral region is shown in white.
Fig. 16:
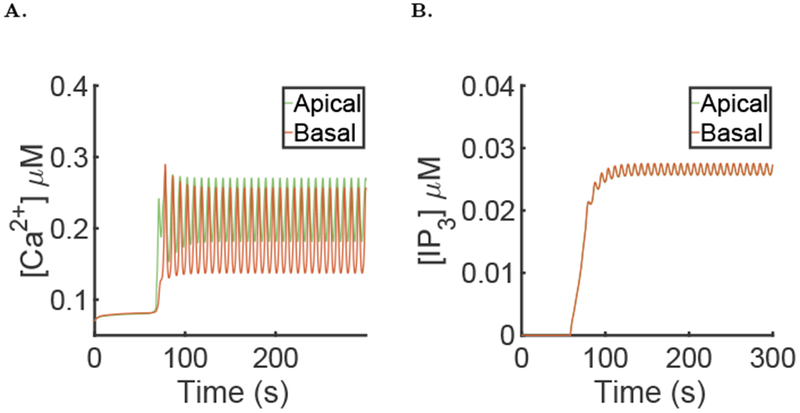
Results of the simulation on another cell, using the same parameters as in Fig. 9 A: Spatial mean [Ca2+] time series in the apical and basal region during a simulation of the model. B: Spatial mean [IP3] time series in the apical and basal region during a simulation of the model.
The volumes of the seven cells vary from 500 μm3 to 1100 μm3, the surface area of the apical region varies from 50 μm2 to 100 μm2 and the surface area of the basal membrane varies from 150 μm2 to 330 μm2. Even with those disparities Ca2+ oscillations are still present in each of the cells. The difference in frequencies can be more than 15% and the height of the [Ca2+] spikes varies by 8% but the overall shape of the oscillations is qualitatively unchanged for most cells. The cell with label five has Ca2+ oscillations without the presence of agonist. This is due to the fact that the cell has a volume that is close to half of the other cells, but that the parameters used are the same as the other cells. The variation in the average fluid flow rate can be up to 40%, within the group of cell we simulated. More details are given in the companion paper.
7. Discussion
Using an accurate three-dimensional representation of parotid acinar cells and new precise data on the distribution of the IPR within the cell we have shown that the spatial organization of the cell is crucial for understanding the mechanisms underlying Ca2+ oscillations in this type of cell. Mechanisms that rely on the modulation of IP3 production and/or degradation (Class II models; see Sneyd et al. (2017a)) did not generate oscillations in a cell where the IPR are in such a thin region. However, Class I models, where the oscillation is generated by the modulation by [Ca2+] of the IPR open probability, can generate Ca2+ oscillations in the apical region of the cell. These local oscillations can then spread to the basal region via some process of active wave propagation leading to whole-cell periodic waves. When linked to the modulation of Ca2+-sensitive Cl and K channels, as discussed in detail in the companion paper (Sigüenza et al., 2018b), these Ca2+ oscillations generate physiological amounts of fluid flow in every one of the seven cells studied.
For each of the cells studied the Ca2+ oscillations are driven only by the apical region. The fact that IP3 is produced only in the apical region does not affect Ca2+ oscillations because the diffusion coefficient of IP3 is orders of magnitude greater than that of Ca2+ and so the [IP3] is practically homogeneous within the cell.
The Ca2+ model has been coupled to the saliva secretion model presented in the companion paper (Sigüenza et al., 2018b). Saliva secretion affects the volume of the cell and thus the concentration of Ca2+ and IP3, and this change in volume has a significant quantitative effect on the oscillations. If the change in volume is not taken into account, the period of the oscillations is increased by almost four times, while the oscillation amplitude is decreased by approximately 30%. It thus follows that an accurate quantitative model for Ca2+ oscillations in parotid acinar cells can be constructed only in combination with a model for the fluid flow through the cell. On the other hand, since there are many other sources of quantitative error in the model, the importance of the error introduced by the assumption of constant volume is unclear.
External exchanges of Ca2+ through SOCC, ROCC and PMCA did not seem to affect significantly the Ca2+ oscillation shape or the average fluid flow, in the homogeneous model. Thus, for simplicity, we did not include those external exchanges of Ca2+ in the full spatial model.
Different measurements of the coefficient of diffusion of both the IP3 in the cytosol and Ca2+ in the ER gave values of orders of magnitude of difference (Dickinson et al., 2016; Means et al., 2006), in comparison with the one classically used. We simulated our model with different values of both diffusion coefficient and the results were quantitatively the same. The only difference is the fact that the [IP3] is not homogeneous in the cell if the value of the diffusion coefficient of IP3 is the one found in Dickinson et al. (2016).
We did not consider the IPR distributed as puncta as suggested by the data. We chose not to do that for computational reasons as it would mean refining the mesh drastically and introducing stochastic simulations. A local study on the effect of having puncta of IPR and not a homogeneous distribution could be interesting for future work.
For simplicity in the model we considered that the degradation of IP3 by 5-phosphatase happens everywhere in the cell. However, 5-phosphatase is membrane bound and the degradation should only happen at the border of the cell. We consider it unlikely that this would have a major impact on the outcome as the diffusion of IP3 is high and IP3 is homogeneous inside the cell.
When the model is simulated without an active wave propagation mechanism, then only diffusion is present to propagate the wave from the apical to the basal region, which fails at propagating the wave. Because of that we included an active wave propagation mechanism in our model, which propagates Ca2+ waves from the apical to the basal region. This mechanism is based on RyR, but the final result is purely phenomenological and could represent also low IPR expression with low affinity to IP3. In an alternate model for the RyR we took into account the influence of SR overloading (Wang et al., 2010). However there were no major changes in the dynamics as a result, and so, for simplicity, we decided not to include that feature for the results presented here.
The Ca2+ oscillations obtained in the model are not homogeneous, either spatially or temporally. However, the apical and basal regions behave relatively uniformly. It might be possible to simplify our model to look only at the apical and basal regions without taking in consideration the complex structure of the cells. The information carried by those two regions is enough for the saliva secretion model, for the production of IP3 and for the driving mechanism of the oscillations. Only the height and temporal difference between the basal and apical regions are important for the fluid flow. An open question is to see if we can simplify the Ca2+ model part to eliminate the spatial component and still have the different behaviour in the apical and basal region.
Parotid acinar cells are organized in clusters and the cells exchange Ca2+ and IP3 through gap junctions. In this work, each cell has been treated as independent. Allowing interaction between cells could strongly modify the dynamics: the frequency of oscillation could vary, cells might synchronise their dynamics or the interaction could kill the oscillations in certain cells. Moreover, the cells in a cluster share a common lumen. Hence, the concentration in the lumen will be affected by all the cells, which will then affect all the cells’ volumes and their internal chemical concentrations. Consideration of all these issues is left for future work, which would require much more extensive computations on the entire acinus.
Supplementary Material
Acknowledgements
This work was supported by the National Institutes of Health grant number RO1DE019245-10 and by the Marsden Fund of the Royal Society of New Zealand. High-performance computing facilities and support were provided by the New Zealand eScience Infrastructure (NeSI) funded jointly by NeSI’s collaborator institutions and through the Ministry of Business, Innovation and Employment’s Research Infrastructure programme. Thanks to NVIDIA Corporation for a K40 GPU grant.
Appendix; construction of the finite-element mesh
In this appendix we describe how we used experimentally measured optical slices to construct a multicellular finite element mesh, in which the cells have conformal intercellular faces. Our work flow has three sequential steps:
Image segmentation
Surface triangulation and refinement
Volumetric meshing
Image segmentation
By visual inspection we identified and selected a contiguous clump of seven cells within our source data image stack. This clump spanned thirty of the images and covered a maximum of approximately one-quarter of each image. Segmentation was done manually by tracing the outline of each cell in each image with a distinct colour, followed by matched colour flood-fill. One-quarter of original image number 16, along with its segmentation, is shown in Fig 17.
Fig. 17:
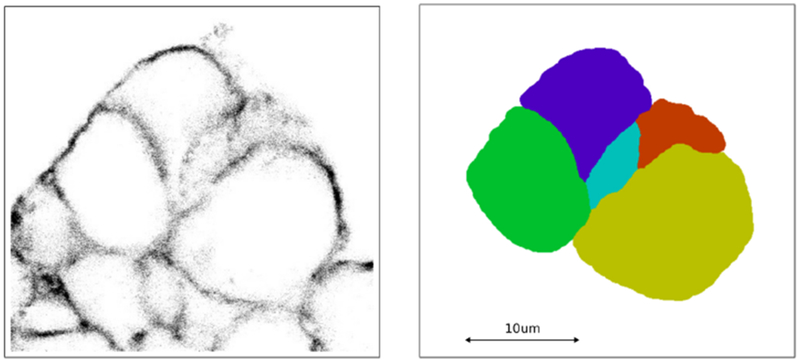
Subsection of a microscopy image slice on the left and its segmentation on the right.
Note that with our image stack the ratio of stack spacing to pixel resolution is 11.6 (being 0.069/0.80). To bring this closer to a ratio of one-to-one, we reduced the X and Y dimensions in the segmented image stack by a factor of four using nearest neighbour interpolation (to retain the distinct colouring of each cell) resulting in a pixel spacing of approximately 0.28μm. The reduced images were then combined into a single XYZ TIFF stack for convenience.
Curvature
We also wanted to extract some information from the segmented image stack about the smoothness of the surface of each cell. We chose line curvature as a surface smoothness characteristic indicator (Rugis, 2005; Rugis and Klette, 2006a,b).
To calculate the curvature, we used the 1024 × 1024 segmented images and extracted pixels associated with the closed curve boundary outline for each cell in each image, then selected the outline containing the maximum number of pixels for each cell as being the closest to a “great arc” slice through that cell. This great arc criterion was based on the fact that only the curvature associated with a great arc of a sphere is equal to the sphere surface mean curvature.
Next, considering that fact that image pixels are all located on a regular rectangular grid (not very useful for calculating actual local curvature!), a smoothed version of each cell outline was created using a 2D Savitzky-Golay (least-squares) fitting filter (Savitzky and Golay, 1964). Fig 18 shows a sample cell outline with the original pixel locations as well as the smoothing process result.
Fig. 18:
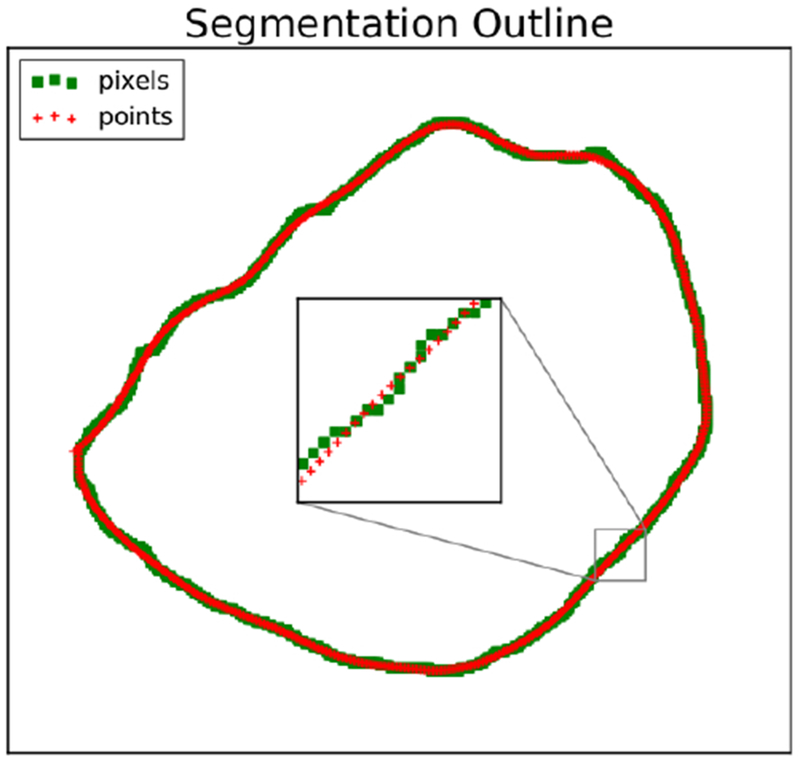
A sample segmentation pixel outline in green with smoothed node points in red.
Planar line curvature was calculated at each point on the smoothed outlines. We used weighted histograms to visualise the curvature distribution for each of the seven cells. Two of the histograms are shown in Fig 19. Note that in both cases the curvature distribution is biased towards the positive, as would be expected with any closed curve from the outside using the convention that positive curvature is associated with convex line segments.
To simplify our characterisation of cell surface shape we chose the weighted standard deviation of the curvatures for each cell as a single valued characterization of surface smoothness and, in that sense, a signature for the shape of each cell. This signature is indicative (i.e., not unique) because standard deviation is only an unambiguous characterisation given normally distributed data. The weighted curvature standard deviation for each of the seven cells is shown in Table 2.
Fig. 19:
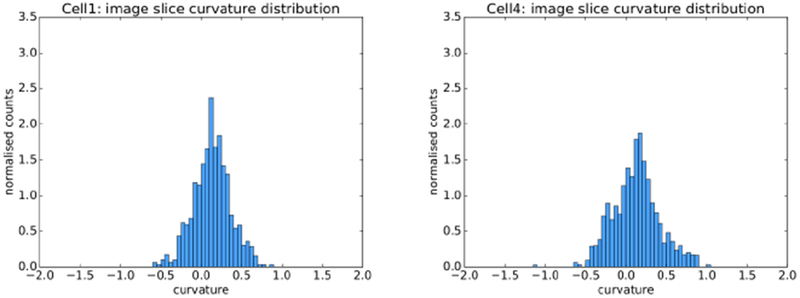
Reference curvature histograms for two of the cells (in μm−). The distributions are “near normal”.
Table 2:
The standard deviation of curvature values for seven cells extracted from the microscopy image stack.
| cell | curvature std (μm−1) |
|---|---|
| 1 | 0.2305 |
| 2 | 0.3567 |
| 3 | 0.3864 |
| 4 | 0.2832 |
| 5 | 0.6868 |
| 6 | 0.3627 |
| 7 | 0.4226 |
Surface triangulation and refinement
For the surface triangulation and refinement process we started with the reduced XYZ TIFF image stack described in the previous section. We treated this reduced stack as a 256 × 256 × 31 solid voxel block within which each voxel is labelled with a colour associated with the cell that it belongs to.
Surface triangulation
Significant prior work in extracting triangle surface meshes from labelled voxel blocks has been done by Boltcheva et al. (2009) and we used their technique. Sample computer code implementing this technique was found on the Computational Geometry Algorithms Library (CGAL) web site (www.cgal.org). Note that we needed to convert our voxel block data to Inria format (www.inria.fr) before passing it to the CGAL code.
The output from the CGAL code was a multi-domain triangle surface mesh, as shown in Fig 20, where each of the cell faces are labelled in colour by cell. However, there are two problems with this mesh: there are “steps” as a result of the relatively limited stack resolution and, on close inspection, the surfaces are rather rough (as can be seen more clearly in the cell labelled “no smoothing” in the top of Fig 21). This lack of surface smoothness has the net effect of increasing the surface area of each cell to a value larger than what it most likely is in the real cells.
Fig. 20:
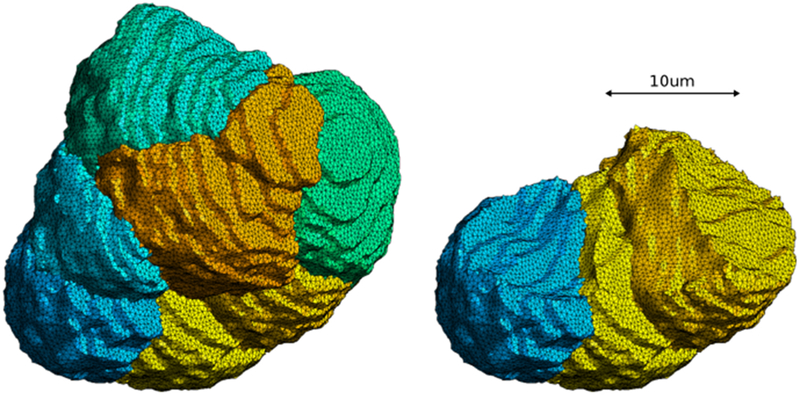
Rough multi-domain surface mesh: all seven cells (left) and three exposed cells (right).
Surface smoothing
To reduce the surface area closer to what it should be, we used a constrained surface smoothing process. Note that the smoothing process should: 1) minimise the surface area of each cell, 2) maintain the volume of each cell and 3) keep the shared conformal faces between cells as being shared.
A pseudo-code outline for our iterative smoothing process is as follows:
Main Loop
{
Cell Loop (for each cell)
{
Smooth the cell.
Restore volume of cell.
Calculate the cell surface curvature.
}
Have all cells reached the target curvature?
Yes: DONE, exit loop.
No: Go back to top of Main Loop.
}
Fig. 21:
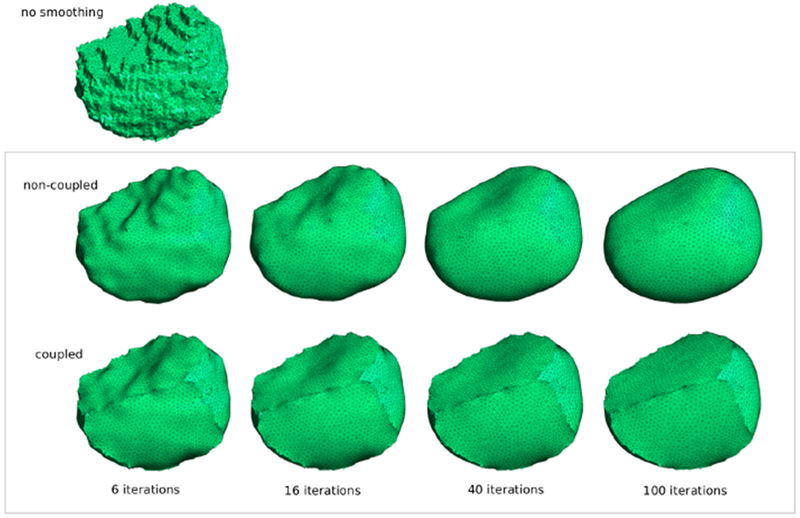
Cell smoothing evolution, with and without inter-cell coupling.
For each cell we used the curvature-flow based smoothing operation described in Desbrun et al. (1999). Note that the cell smoothing process works by slightly moving the position of the surface mesh vertices for each cell in turn (with no new faces added or any faces removed). Therefore, vertices associated with shared faces get moved twice in each pass through the Main Loop, i.e. once for each cell in every adjacent pair of cells. In this sense, the smoothing is a coupled process. With our approach, if the vertices associated with shared faces were allowed to split from each other, the result would be non-coupled as shown in the middle row of Fig 21, which is not what is required.
Coupled smoothing results after each of 6, 16, 40 and 100 iterations are shown in the bottom row of Fig 21. The question remains: after how many iterations should we stop? This is where we found the weighted curvature standard deviation values from Table 2 useful as will be described in the next section.
Iteration termination
Recall from the previous section that reducing cell surface area while at the same time maintaining cell volume was an important consideration. The smoothing step in our process has the effect of reducing surface area as shown for one hundred iterations in the left-hand side of Fig 22. The greatest rate of surface area reduction occurs within the first ten iterations or so. Cell volume is explicitly restored in our process, and thus remains almost unchanged, as can be seen in the right-hand side of Fig 22. For further guidance as to when to terminate the iterative process we looked to surface curvature.
Fig. 22:
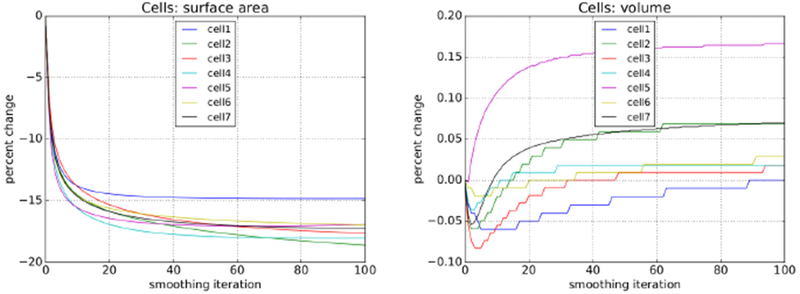
Cell surface area and volume evolution over one hundred coupled smoothing iterations. (Note the much smaller scale range with the plot on the right.)
For each cell, in every iteration, we calculated the 2D surface curvature at every mesh vertex. Additionally, for each cell, in every iteration, we calculated the weighted standard deviation of those curvatures to get a single smoothness characteristic value. We then compared this value to the associated target standard deviation in Table 2 and expressed it as a ratio as shown in Fig 23.
With this information in hand, we decided to terminate the iterative process and accept the results after ten iterations by which time all of the cells had more than dropped below their target characteristic curvature.
For further insight and confirmation of our results we produced initial and final iteration weighted surface curvature histograms for each of the seven cells. Histograms for two of the cells are shown in Fig 24. Note that in all cases, as expected, the initial curvature spread was relatively wide and the final curvature distribution narrower, peaking just to the right (positive) side of zero. The final curvature histograms compared favourably to those associated with the image stacks including those shown earlier in Fig 19.
Volumetric meshing
In the final step of our process, we filled in the surface mesh for each cell with tetrahedrons using the Gmsh software tool (Geuzaine and Remacle, 2009). This volumetric meshing employed a 3-D Delaunay refinement algorithm that reduces the instance of tetrahedral slivers, making the tetrahedrons more equilateral, thereby improving the mesh quality from the point of view of the finite element method. Note that the volumetric meshing did not alter the associated surface meshes, insuring that the meshes remained conformal. Fully meshed cells are shown in Fig 25.
Fig. 23:
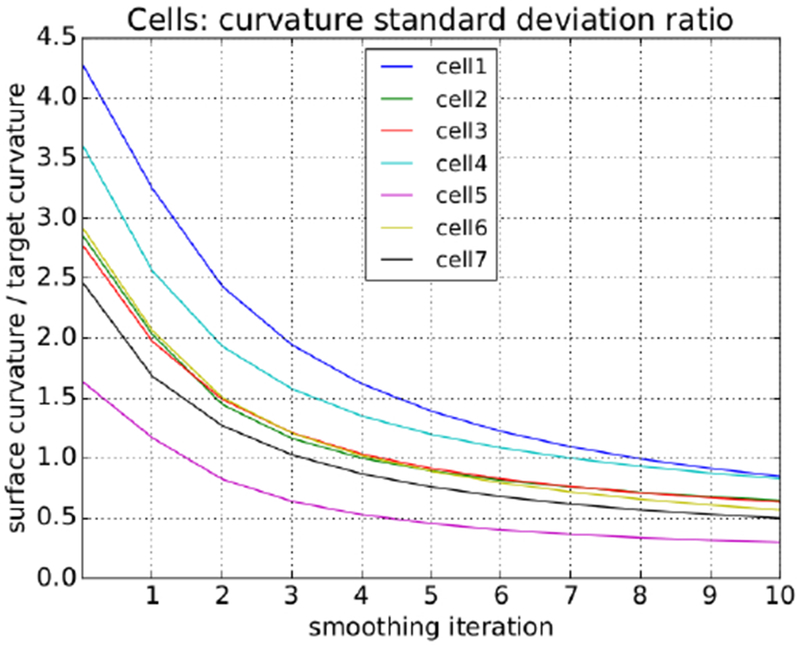
All of the cells hit the target curvature standard deviation ratio of one after nine iterations.
Fig. 24:
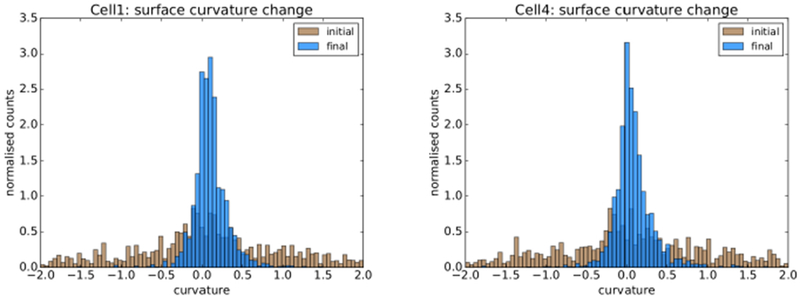
Initial surface curvature distribution in brown and smoothed surface curvature in blue.
Fig. 25:
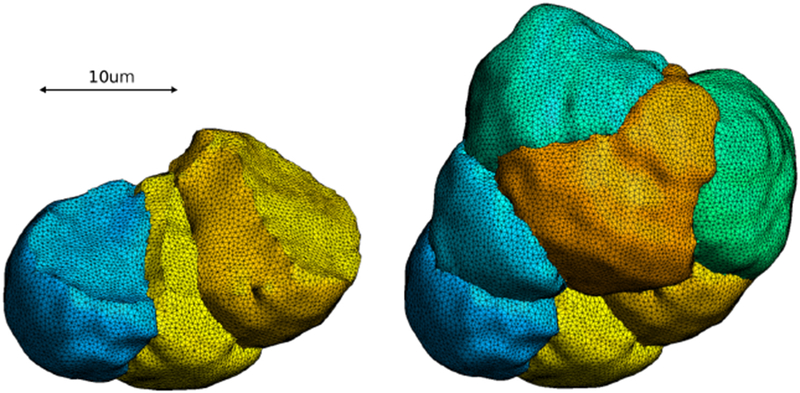
Fully meshed smoothed cells: three exposed cells (left) and all seven cells (right).
References
- Boltcheva D, Yvinec M, Boissonnat J (2009) Mesh generation from 3d multi-material images. Medical Image Computing and Computer-Assisted Intervention [DOI] [PubMed] [Google Scholar]
- Bruce JI, Shuttleworth TJ, Giovannucci DR, Yule DI (2002) Phosphorylation of Inositol 1, 4, 5-Trisphosphate Receptors in Parotid Acinar Cells. A mechanism for the synergistic effects of cAMP on Ca2+ signaling. Journal of Biological Chemistry 277(2):1340–1348, 10.1074/jbc.M106609200 [DOI] [PubMed] [Google Scholar]
- De Young GW, Keizer J (1992) A single-pool inositol 1, 4, 5-trisphosphate-receptor-based model for agonist-stimulated oscillations in Ca2+ concentration. Proceedings of the National Academy of Sciences 89(20):9895–9899, 10.1073/pnas.89.20.9895 [DOI] [PMC free article] [PubMed] [Google Scholar]
- Desbrun M, Meyer M, Schröder P, Barr A (1999) Implicit fairing of irregular meshes using diffusion and curvature flow. Proceedings of the 26th Annual Conference on Computer Graphics and Interactive Techniques SIGGRAPH ’99 pp. 317–324, 10.1145/311535.311576 [DOI] [Google Scholar]
- Dickinson GD, Ellefsen KL, Dawson SP, Pearson JE, Parker I (2016) Hindered cytoplasmic diffusion of inositol trisphosphate restricts its cellular range of action. Sci Signal 9(453):ra108–ra108 [DOI] [PMC free article] [PubMed] [Google Scholar]
- Dupont G, Erneux C (1997) Simulations of the effects of inositol 1, 4, 5-trisphosphate 3-kinase and 5-phosphatase activities on Ca2+ oscillations. Cell calcium 22(5):321–331, 10.1016/S0143-4160(97)90017-8 [DOI] [PubMed] [Google Scholar]
- Dupont G, Goldbeter A (1993) One-pool model for Ca2+ oscillations involving Ca2+ and inositol 1, 4, 5-trisphosphate as co-agonists for Ca2+ release. Cell calcium 14(4):311–322 [DOI] [PubMed] [Google Scholar]
- Dupont G, Falcke M, Kirk V, Sneyd J (2016) Models of calcium signalling, vol 43 Springer [Google Scholar]
- Friel D (1995) [Ca2+]i oscillations in sympathetic neurons: an experimental test of a theoretical model. Biophysical journal 68(5):1752–1766, 10.1016/S0006-3495(95)80352-8 [DOI] [PMC free article] [PubMed] [Google Scholar]
- Gaspers LD, Bartlett PJ, Politi A, Burnett P, Metzger W, Johnston J, Joseph SK, Höfer T, Thomas AP (2014) Hormone-induced calcium oscillations depend on cross-coupling with inositol 1, 4, 5-trisphosphate oscillations. Cell reports 9(4):1209–1218, 10.1016/j.celrep.2014.10.033 [DOI] [PMC free article] [PubMed] [Google Scholar]
- Geuzaine C, Remacle J (2009) Gmsh: A 3-d finite element mesh generator with built-in pre- and post-processing facilities. International Journal for Numerical Methods in Engineering 79:1309–1331, 10.1002/nme.2579 [DOI] [Google Scholar]
- Harootunian AT, Kao JP, Paranjape S, Tsien RY (1991) Generation of Calcium Oscillations in Fibroblasts by Positive Feedback Between Calcium and IP3. Science pp. 75–78, 10.1126/science.1986413 [DOI] [PubMed] [Google Scholar]
- Kasai H, Li YX, Miyashita Y (1993) Subcellular distribution of Ca2+ release channels underlying Ca2+ waves and oscillations in exocrine pancreas. Cell 74(4):669–677, 10.1016/0092-8674(93)90514-Q [DOI] [PubMed] [Google Scholar]
- Keizer J, Levine L (1996) Ryanodine receptor adaptation and Ca2+ (−) induced Ca2+ release-dependent Ca2+ oscillations. Biophysical journal 71(6):3477–3487, 10.1016/S0006-3495(96)79543-7 [DOI] [PMC free article] [PubMed] [Google Scholar]
- Krane CM, Melvin JE, Nguyen H-V, Richardson L, Towne JE, Doetschman T, Menon AG (2001) Salivary acinar cells from aquaporin 5-deficient mice have decreased membrane water permeability and altered cell volume regulation. Journal of Biological Chemistry 276(26):23,413–23,420, 10.1074/jbc.M008760200 [DOI] [PubMed] [Google Scholar]
- Lee MG, Xu X, Zeng W, Diaz J, Wojcikiewicz RJ, Kuo TH, Wuytack F, Racymaekers L, Muallem S (1997) Polarized Expression of Ca2+ Channels in Pancreatic and Salivary Gland Cells. Correlation with initiation and propagation of [Ca2+]i waves. Journal of Biological Chemistry 272(25):15,765–15,770, 10.1074/jbc.272.25.15765 [DOI] [PubMed] [Google Scholar]
- Leite MF, Burgstahler AD, Nathanson MH (2002) Ca2+ waves require sequential activation of inositol trisphosphate receptors and ryanodine receptors in pancreatic acini. Gastroenterology 122(2):415–427, 10.1053/gast.2002.30982 [DOI] [PubMed] [Google Scholar]
- MacLennan DH, Rice WJ, Green NM (1997) The mechanism of Ca2+ transport by sarco (endo) plasmic reticulum Ca2+-ATPases. Journal of Biological Chemistry 272(46):28,815–28,818, 10.1074/jbc.272.46.28815 [DOI] [PubMed] [Google Scholar]
- Means S, Smith AJ, Shepherd J, Shadid J, Fowler J, Wojcikiewicz RJ, Mazel T, Smith GD, Wilson BS (2006) Reaction diffusion modeling of calcium dynamics with realistic ER geometry. Biophysical journal 91(2):537–557 [DOI] [PMC free article] [PubMed] [Google Scholar]
- Nathanson MH, Fallon MB, Padfield PJ, Maranto AR (1994) Localization of the type 3 inositol 1, 4, 5-trisphosphate receptor in the Ca2+ wave trigger zone of pancreatic acinar cells. Journal of Biological Chemistry 269(7):4693–4696 [PubMed] [Google Scholar]
- Nezu A, Morita T, Tanimura A (2015) In vitro and in vivo imaging of intracellular Ca2+ responses in salivary gland cells. Journal of Oral Biosciences 57(2):69–75, 10.1016/j.job.2015.02.003 [DOI] [Google Scholar]
- Palk L, Sneyd J, Shuttleworth TJ, Yule DI, Crampin EJ (2010) A dynamic model of saliva secretion. J Theor Biol 266(4):625–640, 10.1016/j.jtbi.2010.06.027 [DOI] [PMC free article] [PubMed] [Google Scholar]
- Penny CJ, Kilpatrick BS, Han JM, Sneyd J, Patel S (2014) A computational model of lysosome–ER Ca2+ microdomains. J Cell Sci 127(13):2934–2943, 10.1242/jcs.149047 [DOI] [PubMed] [Google Scholar]
- Politi A, Gaspers LD, Thomas AP, Höfer T (2006) Models of IP3 and Ca2+ oscillations: frequency encoding and identification of underlying feedbacks. Biophysical journal 90(9):3120–3133, 10.1529/biophysj.105.072249 [DOI] [PMC free article] [PubMed] [Google Scholar]
- Rugis J (2005) Surface curvature maps and Michelangelo’s David. Image and Vision Computing New Zealand 2005 pp. 218–222 [Google Scholar]
- Rugis J, Klette R (2006a) A scale invariant surface curvature estimator. LNCS: Advances in Image and Video Technology 4319:138–147 [Google Scholar]
- Rugis J, Klette R (2006b) Surface registration markers from range scan data. LNCS: Combinatorial Image Analysis 4040:430–444 [Google Scholar]
- Savitzky A, Golay M (1964) Smoothing and differentiation of data by simplified least squares procedures. Analytical Chemistry 36:1627–1639, 10.1021/ac60214a047 [DOI] [PubMed] [Google Scholar]
- Sigüenza E, M. A. Catalàn, Peña-Münzenmayer G, J E. Melvin, Sneyd J (2018a) A Mathematical Model Supports a Key Role for Ae4 (Slc4a9) in Salivary Gland Secretion. Bulletin of Mathematical Biology 80(2):255–282, DOI 10.1007/s11538-017-0370-6 , 10.1007/s11538-017-0370-6 10.1007/s11538-017-0370-6, https://doi.org/10.1007/s11538-017-0370-6 [DOI] [PMC free article] [PubMed] [Google Scholar]
- Sigüenza E, Pages N, Yule D JR, Sneyd J (2018b) A Mathematical Model of Fluid Transport in an Accurate Reconstruction of a Parotid Acinar Cell. Submitted [DOI] [PMC free article] [PubMed] [Google Scholar]
- Sneyd J, Tsaneva-Atanasova K, Bruce J, Straub S, Giovannucci D, Yule D (2003) A model of calcium waves in pancreatic and parotid acinar cells. Biophysical journal 85(3):1392–1405, 10.1016/S0006-3495(03)74572-X [DOI] [PMC free article] [PubMed] [Google Scholar]
- Sneyd J, Tsaneva-Atanasova K, Reznikov V, Bai Y, Sanderson M, Yule D (2006) A method for determining the dependence of calcium oscillations on inositol trisphosphate oscillations. Proceedings of the National Academy of Sciences of the United States of America 103(6):1675–1680, 10.1073/pnas.0506135103 [DOI] [PMC free article] [PubMed] [Google Scholar]
- Sneyd J, Han JM, Wang L, Chen J, Yang X, Tanimura A, Sanderson MJ, Kirk V, Yule DI (2017a) On the dynamical structure of calcium oscillations. Proceedings of the National Academy of Sciences p. 201614613, 10.1073/pnas.1614613114 [DOI] [PMC free article] [PubMed] [Google Scholar]
- Sneyd J, Means S, Zhu D, Rugis J, Won JH, Yule DI (2017b) Modeling calcium waves in an anatomically accurate three-dimensional parotid acinar cell. Journal of theoretical biology 419:383–393, 10.1016/j.jtbi.2016.04.030 [DOI] [PMC free article] [PubMed] [Google Scholar]
- Stern MD, Pizarro G, Ríos E (1997) Local Control Model of Excitation–Contraction Coupling in Skeletal Muscle. The Journal of General Physiology 110(4):415–440, DOI 10.1085/jgp.110.4.415 , http://jgp.rupress.org/content/110/4/415 , 10.1085/jgp.110.4.415http://jgp.rupress.org/content/110/4/415http://jgp.rupress.org/content/110/4/415.full.pdf, http://jgp.rupress.org/content/110/4/415 , http://jgp.rupress.org/content/110/4/415.full.pdf [DOI] [PMC free article] [PubMed] [Google Scholar]
- Tanimura A, Morita T, Nezu A, Tojyo Y (2009) Monitoring of IP3 dynamics during Ca2+ oscillations in HSY human parotid cell line with FRET-based IP3 biosensors. The Journal of Medical Investigation 56(Supplement):357–361, 10.2152/jmi.56.357 [DOI] [PubMed] [Google Scholar]
- Thorn P, Lawrie AM, Smith PM, Gallacher DV, Petersen OH (1993) Local and global cytosolic Ca2+ oscillations in exocrine cells evoked by agonists and inositol trisphosphate. Cell 74(4):661–668, 10.1016/0092-8674(93)90513-P [DOI] [PubMed] [Google Scholar]
- Tojyo Y, Tanimura A, Matsumoto Y (1997) Imaging of intracellular Ca2+ waves induced by muscarinic receptor stimulation in rat parotid acinar cells. Cell calcium 22(6):455–462, 10.1016/S0143-4160(97)90073-7 [DOI] [PubMed] [Google Scholar]
- Wang IY, Bai Y, Sanderson MJ, Sneyd J (2010) A mathematical analysis of agonist-and KCl-induced Ca2+ oscillations in mouse airway smooth muscle cells. Biophysical journal 98(7):1170–1181, 10.1016/j.bpj.2009.12.4273 [DOI] [PMC free article] [PubMed] [Google Scholar]
- Yule DI, Ernst SA, Ohnishi H, Wojcikiewicz RJ (1997) Evidence That Zymogen Granules Are Not a Physiologically Relevant Calcium pool. Defining the distribution of inositol 1, 4, 5-trisphosphate receptors in pancreatic acinar cells. Journal of Biological Chemistry 272(14):9093–9098, 10.1074/jbc.272.14.9093 [DOI] [PubMed] [Google Scholar]
- Zhang X, Wen J, Bidasee KR, Besch HR, Rubin RP (1997) Ryanodine receptor expression is associated with intracellular Ca2+ release in rat parotid acinar cells. American Journal of Physiology-Cell Physiology 273(4):C1306–C1314, 10.1152/ajpcell.1997.273.4.C1306 [DOI] [PubMed] [Google Scholar]
- Zhang X, Wen J, Bidasee KR, Besch HR, Wojcikiewicz RJH, LEE B, Rubin RP (1999) Ryanodine and inositol trisphosphate receptors are differentially distributed and expressed in rat parotid gland. Biochemical Journal 340(2):519–527, DOI 10.1042/bj3400519 , http://www.biochemj.org/content/340/2/519 , 10.1042/bj3400519http://www.biochemj.org/content/340/2/519http://www.biochemj.org/content/340/2/519.full.pdf, http://www.biochemj.org/content/340/2/519 , http://www.biochemj.org/content/340/2/519.full.pdf [DOI] [PMC free article] [PubMed] [Google Scholar]
Associated Data
This section collects any data citations, data availability statements, or supplementary materials included in this article.


