

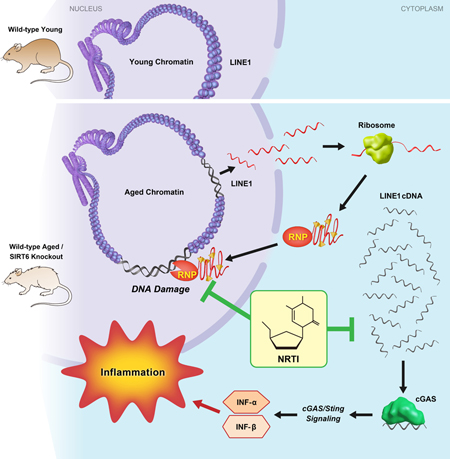
SUMMARY
Mice deficient for SIRT6 exhibit a severely shortened lifespan, growth retardation, and highly elevated LINE1 (L1) activity. Here we report that SIRT6 deficient cells and tissues accumulate abundant cytoplasmic L1 cDNA which triggers strong type I interferon response via activation of cGAS. Remarkably, nucleoside reverse transcriptase inhibitors (NRTIs), which inhibit L1 retrotransposition, significantly improved health and lifespan of SIRT6 knockout mice and completely rescued type I interferon response. In tissue culture, inhibition of L1 with siRNA or NRTIs abrogated type I interferon response, in addition to a significant reduction of DNA damage markers. These results indicate that L1 activation contributes to the pathologies of SIRT6 knockout mice. Similarly, L1 transcription, cytoplasmic cDNA copy number and type I interferons were elevated in the wild type aged mice. As sterile inflammation is a hallmark of aging we propose that modulating L1 activity may be an important strategy for attenuating age-related pathologies.
Keywords: Retrotransposition, longevity, SIRT6, nucleotide reverse transcriptase inhibitors
Graphical Abstract
eTOC Blurb
Simon et al. show that LINE1 retrotransposon elements are de-repressed in aged and progeroid mice. Cytoplasmic accumulation of LINE1 cDNA copies induced a type I interferon response, through the cGAS DNA sensing pathway, resulting in pathological inflammation. Inhibiting L1 replication significantly improved the health and lifespan of aged mice.
INTRODUCTION
The process of progressive organismal and cellular decline known as aging remains one of the most challenging problems in biology and medicine. Investigating and understanding the underlying mechanisms that promote aging is of paramount importance to elucidating interventions in age-related diseases. Of the multiple observations that have been made in aging systems, one of the more mysterious has been the role of the transposable elements that have colonized the mammalian genome. While most of these elements lack the ability to replicate beyond their host cell, they are nonetheless still capable of replicating their DNA and pose a potential threat to the integrity of the host genome. One of the more successful retrotransposons is the class of long interspersed nuclear element 1 (L1), which is a ubiquitous feature of mammalian genomes, comprising approximately 20% of the genomic DNA in mice and humans (Lander et al., 2001; Mouse Genome Sequencing et al., 2002). These 6 kb, fully functional retrotransposons can not only replicate themselves, but also other retroelements that use L1-encoded proteins necessary for retrotransposition: ORF1, a nucleic acid chaperone, and ORF2, an endonuclease and reverse transcriptase (Dewannieux et al., 2003; Hancks and Kazazian, 2012; Richardson et al., 2015). As this ability to replicate and expand within a host genome requires DNA breakage and insertion, L1 activity has been linked to DNA damage and mutagenesis (Gasior et al., 2006; Gilbert et al., 2002; Iskow et al., 2010).
While the preponderance of research on L1s has focused on their activity in the germ line, recent evidence has suggested that L1 activity in somatic tissues contributes to a number of age-related diseases, such as neurodegeneration and cancer (Hancks and Kazazian, 2012; Iskow et al., 2010; Lee et al., 2012; Reilly et al., 2013). Given the potential harm that L1s can cause, host genomes have evolved a number of molecular mechanisms for silencing these parasitic elements (Crichton et al., 2014; Levin and Moran, 2011). Recent studies have reported, however, that these mechanisms become less efficient during the aging process, resulting in the derepression of L1s (De Cecco et al., 2013; St Laurent et al., 2010; Van Meter et al., 2014). Much of this derepression appears to stem from redistribution and reorganization of the heterochromatin that normally constrains the activity of these elements and can lead to inflammation through the innate immune response (Ablasser et al., 2014; Oberdoerffer et al., 2008; Thomas et al., 2017; Van Meter et al., 2014). Despite the results which suggest that upregulation of L1 expression is a hallmark of aging, it is unclear to what extent, if any, L1s contribute to age-related pathologies and whether inhibiting L1 activity can delay these pathologies.
Mice deficient in the mono-ADP-ribosylase/deacetylase protein SIRT6 develop a severe premature aging phenotype, characterized by a failure to thrive, intestinal sloughing, hypoglycemia and a severely shortened lifespan (Mostoslavsky et al., 2006). Recently, SIRT6, has been demonstrated to be involved in silencing of L1 promoters (Van Meter et al., 2014). SIRT6 mono-ADP-ribosylates KAP1 and promotes its complex formation with HP1 thereby packaging the L1 DNA into transcriptionally silent heterochromatin (Van Meter et al., 2014). Remarkably, SIRT6 knockout (KO) mice show a strong activation of L1, suggesting a role for L1 misexpression in their age-related phenotypes (Mostoslavsky et al., 2006; Van Meter et al., 2014). Additionally, SIRT6 KO cells display excess genomic instability and DNA damage (Mostoslavsky et al., 2006). Considering the short lifespan of SIRT6 deficient mice, they provide a unique model to test whether inhibition of L1 activity can extend lifespan and alleviate the pathology of these mice.
Given the multiple progeroid phenotypes and highly elevated L1 activity inherent to SIRT6 KO mice, we sought to use this system to address the role for L1s in age-related pathology. We used anti-reverse transcriptase drugs to treat SIRT6 KO cell lines and animals to inhibit L1 retrotranspositon and found that many of the pathologies in these animals were alleviated. L1-specific RNAi knockdown was able to recapitulate the results with the anti-reverse transcriptase drugs. We also discovered that SIRT6 KO associated L1 activity triggers activation of the innate immune response via type I interferon production. Finally, we show that L1 DNA accumulates in the cytoplasm in SIRT6 KO tissues, triggering the cytoplasmic DNA sensor, cGAS, and initiating the innate immune response. Our data reveal that L1 activity directly contributes to the progeroid phenotypes of SIRT6 mice and correlates with observations in normal aging tissues and animals.
RESULTS
NRTI treatment abrogates L1 activity in SIRT KO cells and tissues
Nucleoside reverse transcriptase inhibitors (NRTI) are a powerful class of clinical antiviral compounds used to treat HIV-1 infection via poisoning of reverse transcriptase (RT) enzymes by terminating chain elongation (Painter et al., 2004). This activity effectively blocks retroviruses and retroelements from completing genomic invasion. Several studies have reported that in addition to impeding the activity of viral polymerases, NRTIs such as 3TC and d4T, are also potent inhibitors of L1 RT (Dai et al., 2011; Jones et al., 2008). In order to assess the efficacy of NRTIs in inhibiting L1 in the context of SIRT6 KO, we transfected WT and SIRT6 KO mouse embryonic fibroblasts with either human or mouse L1-enhanced green fluorescent protein (EGFP) reporter cassettes (Ostertag et al., 2000) to measure de novo retrotransposition events. In brief, successful retrotranspostion is detected when the GFP marker is retrotranscribed with the interrupting intron spliced out during mRNA processing. Successful events are measured as percent of GFP-positive cells. L1s were approximately 3-times more active in SIRT6 KO relative to WT cells (Figure 1A, B; Figure S1A). Both 3TC or d4T treatments abrogated L1 retrotransposition events in both WT and SIRT6 KO cells, demonstrating a robust antagonistic activity to the L1 lifecycle (Figure 1A, B; Figure S1A). Additionally, we found that SIRT6 KO MEFs demonstrate a progressive accumulation of L1 DNA with each population doubling (PD) (Figure 1C). NRTI treatment of WT and SIRT6 KO fibroblasts over the course of 40 PDs effectively inhibited the expansion of L1 DNA copies in SIRT6 KO cells, demonstrating that NRTIs are sufficient for ameliorating L1 DNA accumulation (Figure 1C).
Figure 1 |. NRTI treatment inhibits L1 retrotransposition and rescues DNA damage in SIRT6 KO cells.

A, B Treatment with either 3TC or d4T inhibits L1 retrotransposition events. WT and SIRT6 KO MEF were cultured with 10 μM 3TC or d4T and then transfected with a human (A) or mouse (B) L1-EGFP reporter plasmids containing full length L1 elements including native L1 5’ UTRs from human (Ostertag et al., 2000) or mouse (An et al., 2011). De novo retrotransposition events leading to activation of the GFP gene were scored by flow cytometry. The values were normalized for transfection efficiency using co-transfection with DsRed expression plasmid (see Figure S1A).
C, NRTI treatment reduces L1 DNA copy number in cultured cells. WT and SIRT6 KO MEFs were cultured and assayed for L1 copy number every 10 population doublings (PDs). In addition (right part of the panel), cells were grown for 40 PDs with 10 μM NRTI and then assayed by qPCR. The values were normalized to 5S ribosomal RNA gene.
D-E, SIRT6 KO MEFs show elevated levels of DNA damage that is alleviated by NRTI treatment. MEFs were isolated from embryos of NRTI-treated or control dams, cultured for two passages with or without NRTIs and spontaneously arising γH2AX (D) and 53BP1 (E) foci were quantified by immunostaining. ≥80 cells were counted for each treatment. Representative images are shown in Figure S1B.
F, SIRT6 KO MEFs show elevated levels of DSBs as measured by the neutral comet assay, and these breaks are rescued by NRTI treatment. Values represent percent of population with excessive DNA damage denoted by tail DNA content in excess of 10%. At least 80 cells were counted for each treatment. Representative images are shown in Figure S1B.
G, L1-specific knockdown rescues elevated L1 expression in SIRT6 KO cells. SIRT6 KO MEF lines were generated with siRNA or shRNA cassettes targeting conserved sequences at the 5’ portion of MdA L1 family. The knock down cassettes were stably integrated. Both cassettes repressed L1 expression. qRT-PCR data was normalized to actin. Three clones were analyzed per genotype.
H, L1 RNAi rescued elevated γH2AX foci in SIRT6 KO cell lines. At least 80 cells were counted for each cell line. For PCR experiments, three independent MEF cultures of each genotype were used. Error bars show s.d. Statistical significance was determined by t-test and asterisks indicate p < 0.05.
Inhibition of L1s rescues elevated DNA damage in SIRT6 KO cells
DNA breaks induced by L1 ORF2 protein and de novo insertion events pose a threat to genomic stability. Overexpression of ORF2p is known to induce excessive DNA damage and can induce senescence, demonstrating the potential danger in endogenous misregulation of L1 activity (Gasior et al., 2006; Gilbert et al., 2002; Kines et al., 2014). In order to assess the effect of NRTI treatment on L1-mediated DNA damage, we treated mouse fibroblasts with NRTIs for 10 PDs. SIRT6 KO cells showed elevated double strand breaks by both γH2AX (Figure 1D, Figure S1B) and 53BP1 staining (Figure 1E, Figure S1B) and by neutral comet assay (Figure 1F). This DNA damage was significantly ameliorated by NRTI treatment (Figure 1D-F, Figure S1B). Thus, NRTI treatment significantly reduces genomic instability linked to L1 RT in SIRT6 KO cells.
NRTIs function as broad reverse transcriptase inhibitors. SIRT6 KO tissues demonstrate misregulation and increased expression of many retroelements, including SINEs and other retrotransposons (Van Meter et al., 2014), any of which could also contribute to SIRT6 KO phenotypes and would potentially be suppressed by NRTI treatment. Consistent with the previous report, we found several evolutionarily active L1 families to be elevated in MEF SIRT6 KO cells using several primer pairs targeting different regions (Figure S1C-E). To elucidate the direct role of L1 activity in SIRT6 KO biology, we generated two L1 RNAi vector systems to directly target L1s using conserved sequences between different L1 families, especially the more active families, including L1MdA_I, II, III and L1MdTf (Hardies et al., 2000; Sookdeo et al., 2013). RNAi cassettes, or control vectors, were integrated into SIRT6 KO MEFs. Both RNAi systems demonstrated significant reduction in L1 RNA abundance (Figure 1G). Immunostaining was conducted on these cell lines to assess DNA damage. Strikingly, both RNAi systems rescued the elevated γH2AX foci observed in the SIRT6 KO cells (Figure 1H). Thus, L1 activity alone in SIRT6 KO cells is the major contributor to the excessive DNA damage observed.
Elevated L1 activity in SIRT6 KO mouse organs is suppressed by NRTI treatment
Based on the successful in vitro inhibition of L1 RT activity in SIRT6 KO cells and the significant amelioration of cellular DNA damage, we began administering 3TC and d4T to SIRT6 KO mice. Heterozygous SIRT6+/− mice were bred and pregnant animals were administered either 3TC or d4T in the drinking water immediately after mating. NRTIs continued to be administered in the drinking water throughout the postnatal period; in addition, the pups were given NRTIs orally once a day using a pipette, while the control pups were given water. As expected, in the homozygous SIRT6 KO control group, multiple tissues showed upregulation of L1 transcription compared to WT littermates (Figure 2A). This was complemented by observed increases in the LINE1 protein, ORF1p, in SIRT6 KO MEFs (Figure 2B). Total L1 DNA content (Figure 2D) was also highly elevated in these tissues. Remarkably, this increase in L1 DNA was suppressed by NRTI treatments (Figure 2D). Additionally, WT littermate cohorts treated with NRTIs also demonstrated significant decreases in L1 DNA content (Figure 2E). These data demonstrate that NRTIs can suppress L1 activity to a significant extent in these animals, regardless of the baseline level of L1 activity.
Figure 2 |. L1 expression is induced in SIRT6 KO and aged mice and is suppressed by NRTI treatment.

A, L1 transcripts are elevated in several tissues of SIRT6 KO mice. Organs were harvested from 27 days old WT and SIRT6 KO mice. L1 mRNA was assayed via qRT-PCR and normalized to actin and WT heart was used as a reference.
B, Western blot analysis of L1 ORF1p . Both WT and KO MEFs, as well as sample young (4 month; black bars) and old (24 month; while bars) WT mouse tissue, were subjected to Western blot analysis. KO cells and old WT tissue both displayed significantly elevated ORF1p staining (p < 0.001, t-test). The mouse LINE-1 ORF1p antibody (EA13 Rb Monoclonal) was developed and validated in the lab of J.D. Boeke by transfection experiments and peptide blocking.
C, Immunostaining of young (5 month) and old (25 month) fixed liver tissue. Tissue samples were stained using LINE1 ORF1p (EA13). Cells were scored for positive signal and counted. n=3 animals per age group. p < 0.001, t-test
D, NRTI treatment reduces L1 DNA content in SIRT6 KO mice.
E, L1 DNA content in NRTI treated WT mouse tissues. L1 DNA content was assayed at 27 days old and normalized to 5S rRNA gene. Four animals were assayed for each treatment and error bars indicate s.d. Significance was determined by t-test and asterisks indicate p < 0.05.
Cytoplasmic L1 DNA is enriched in SIRT6 KO cells and tissues
It has previously been reported that conditions such as autoimmunity (Thomas et al., 2017), (Stetson et al., 2008) are associated with accumulation of extrachromosomal L1 cDNA copies. Additionally, it has been reported that extranuclear DNA sensing is essential for cellular senescence (Dou et al., 2017; Li and Chen, 2018; Takahashi et al., 2018; Yang et al., 2017), which is elevated with SIRT6 deficiency and increases in aging mammals (Mao et al., 2012; Nagai et al., 2015). To test whether an increased L1 copy number is associated with the increase in the extrachromosomal L1 cDNA copies, immunofluorescence staining was performed using an anti-ssDNA antibody. Extranuclear ssDNA foci were consistently observed in SIRT6 KO cells, but not in WT cells (Figure 3A). Further, FISH staining using a L1 DNA-specific probe revealed multiple foci in SIRT6 KO cells, indicating that L1 DNA is present to a significant degree in the cytoplasm of these cells (Figure 3A, S1F). Cell fractionation and subsequent qPCR quantification demonstrated SIRT6 KO fibroblasts contained 2-fold greater number of cytoplasmic L1 DNA than the WT cells, and this increase was completely rescued by the NRTIs (Figure 3B). Similarly, cytoplasmic L1 DNA content was also highly elevated in tissues that had demonstrated high L1 expression and total DNA content (Figure 3C-F). These data indicate that much of the elevated L1 DNA observed in SIRT6-deficient tissues are not integrated copies and exist as extra-chromosomal cytoplasmic DNA.
Figure 3 |. Cytoplasmic L1 DNA is enriched in SIRT6 KO and aged WT tissues.

A, SIRT6 KO cells have cytoplasmic ssDNA and L1 DNA. Cytoplasmic ssDNA foci were observed in cultured SIRT6 KO MEFs but absent in WT cells. SIRT6 KO MEFs staining using a DNA FISH probe displayed multiple foci in the cytoplasm that were rare or absent in WT cells. 5S rDNA probes were used as control. Quantification of FISH data is shown on the right.
B, Cytoplasimic L1 DNA is elevated in SIRT6 KO MEFs. Cells cultured with NRTIs show reduced cytoplasmic L1 DNA content. Cells were counted and lysed to extract cytoplasmic fraction. Serial dilutions were used to standardize loading amount. Data is presented as a ratio of L1 DNA to 5S rDNA. Dashed red line indicates the baseline ratio of L1 DNA to 5S rDNA in the nucleus (established by PCR on isolated nuclei). Black asterisks indicate p < 0.05 compared to WT, red asterisks indicated p < 0.05 compared to SIRT6 KO.
C-F, Cytoplasmic L1 DNA copies are elevated in the tissues of aged (24 month old) and SIRT6 KO mice. C, liver; D, spleen; E, brain; F, skin. Data is presented as a ratio of L1 DNA to 5S rDNA. Dashed red line indicates the baseline ratio of L1 DNA to 5S rDNA in the nucleus (established by qPCR on isolated nuclei).
G, cGAS expression and type I interferon expression are elevated in SIRT6 KO MEFs. Expression levels were normalized to actin.
H, RNAi knockdown of cGAS correlates with decrease in type I interferon expression in SIRT6 KO MEFs. Three separate cGAS targeting shRNAs were transfected into MEF SIRT6 KO cells. A scramble shRNA sequence was used as a control. Expression levels were normalized to actin.
I, cGAS-bound DNA is enriched for L1s in SIRT6 KO cells. Immunoprecipitation of cGAS from MEFs using two separate antibodies shows an average 17- and 34-fold enrichment for L1 DNA. Abundance of cGAS-bound DNA was normalized to 5S rDNA.
Three independent MEF cultures or four animals of each genotype were used. Error bars show s.d. Statistical significance determined by t-test. Asterisks indicate p < 0.05.
L1 activity correlates with type I interferon response and is rescued by NRTI treatment
L1 transposition intermediates such as L1 RT reverse transcribed cytoplasmic cDNA can be recognized by cellular antiviral defense machineries triggering a type I interferon response (Volkman and Stetson, 2014). Indeed, we observed a significant increase in total L1 DNA copies, as well as cytoplasmic L1 cDNA in SIRT6 KO cells and tissues (Figure 3B-F) which could trigger a type I interferon response (McNab et al., 2015). In SIRT6 KO MEFs, the cytosolic DNA sensor, cGAS, exhibited significantly higher expression, which coincided with elevated expression of type I interferons (IFN-α and IFN-β1) (Figure 3G). To confirm that cGAS signaling was responsible for the observed interferon response, RNAi against cGAS was used. Using 3 separate shRNAs with varying degrees of efficacy, cGAS knockdown correlated with suppression of both IFN-α and IFN-β1 (Figure 3H). Finally, MEF cells were crosslinked with UV radiation and cGAS was immunoprecipitated using two separate antibodies. Subsequent purification and analysis of the bound DNA revealed a ~17 and ~34 –fold increase in the abundance of L1 DNA in SIRT6 KO cells compared to WT, depending of the antibody used (Figure 3I). Thus, cytosolic L1 DNA triggers type I interferon expression via the cGAS signaling pathway.
Consistent with the results in MEFs, multiple tissues of SIRT6 KO mice showed a dramatic increase in type I interferon (IFN-α and IFN-β1) expression, which was completely rescued by NRTI treatment (Figure 4A, B). Additionally, both L1 RNAi systems completely rescued IFN-α and IFN-β1 expression, demonstrating similar trends to those observed in the NRTI-treated animals and indicating that L1 activity is the cause of the innate immune response (Figure 4C, D). Further, suppression of basal levels of type I interferons by NRTI treatment was also observed in WT tissues (Figure S2A, B). Other inflammation markers were also elevated in SIRT6 KO mice, many of which were reversed by NRTI treatment (Figure S2C).
Figure 4 |. Inhibition of reverse transcriptase rescues type I interferon response in SIRT6 KO mice.

A, B, SIRT6 KO mice display a robust type I interferon-α (A) and β (B) response that is rescued by NRTI treatment. Organs were harvested from 27 days old mice and interferon mRNA was quantified by qRT-PCR. Data normalized to actin and WT heart was used as a reference. Impact NRTI treatment on the WT control mice is shown in Figure S2A, B. n=5 animals per group, error bars show s.d. Black asterisks indicate significant differences from WT, and red asterisks indicate significant differences from water-treated SIRT6 KO.
C, D, SIRT6 KO MEF lines were generated with stably integrated siRNA or shRNA cassettes targeting conserved sequences at the 5’ portion of L1 MdA family. Both cassettes rescued IFN-α/β expression.
E-G, NRTI anti-RT activity is essential for L1 suppression and rescue of type I interferon response. Cells were treated with 10 μM/ml of unmodified NRTI or methylated d4T (mD4T) for 30 PD. See Figure S2D for additional analysis of methylated D4T. L1 DNA content (E) and IFN-α/β expression (F, G) were assayed by qPCR and qRT-PCR. The data was normalized to actin and WT values were used as a reference.
Statistical significance was determined by the Student’s t-test and asterisks indicate p < 0.05.
Previously, it was reported that NRTIs possess an intrinsic anti-inflammatory activity independent of their anti-RT activity (Fowler et al., 2014), raising the possibility that the observed rescue of interferon response is independent of L1 inhibition. To address this possibility, we synthesized a 5’-O-methyl (meStav) version of d4T, which was previously reported to lack anti-RT activity due to the removal of the 5’-OH group but still retained anti-inflammatory activity (Fowler et al., 2014). SIRT6 KO MEFs treated with meStav at the same dosage as d4T (10 μM) failed to suppress IFN-α and IFN-β1 expression, but did display suppression of SASP factors associated with the NLRP3 inflammasome. Importantly, Fowler et al observed inhibition of NLRP3 inflammasome at 100 μM. Here, we confirm their finding that meStav inhibits inflammasome even at a lower concentration, however, it does not inhibit the type-I interferon response. This indicates that NRTI anti-RT activity is essential for suppression of the Type-1 interferon response (Figure 4E-G, S2D).
NRTI-treatment alleviates progeroid phenotypes and extends lifespan in SIRT6 KO mice
Consistent with previous studies (Mostoslavsky et al., 2006), the control (water treated) SIRT6 KO mice rapidly developed progeria and postnatal wasting with complete penetrance. Remarkably, the NRTI-treated mice presented as generally healthier, with shiny fur, improved body size, and less kyphosis (Figure 5A). While the control SIRT6 KO mice all died within 35 days, the NRTI-treated SIRT6 KO mice exhibited a more than two-fold increase in their mean and maximum lifespans (Figure 5B). Additionally, we observed that NRTI-treated SIRT6 KO mice had improved body mass and delayed wasting compared to the controls (Figure 5C). Thus, NRTI treatment significantly improves SIRT6 KO lifespan and healthspan.
Figure 5 |. Treatment with NRTIs extends lifespan and improves health of SIRT6 KO mice.

A, NRTI treatment improves the appearance and alleviates wasting phenotype of SIRT6 KO animals. Pictures were taken at 30 days of age.
B, NRTI treatment extends mean and maximum lifespans of SIRT6 KO mice. The survival curves for SIRT6 KO NRTI-treated mice were significantly different from untreated SIRT6 KO controls. n=10 animals, p < 0.0001, log-rank test.
C, NRTI treatment improved body weight of SIRT6 KO animals. n=10 animals. p < 0.0001, One Way ANOVA.
D-F, NRTI treatment rescues physical impairments in SIRT6 KO mice. D, Open field test: healthy mice avoid unfamiliar open spaces and rapidly run to the corners when placed in the center. Time to exit the field was measured. E, Foraging activity. F, Inverted screen test measures the time a mouse holds on to an inverted mesh screen. For each animal the point score was calculated as a sum of the scores for three trials, then an average was calculated for six animals. n=6 animals per group, and three replicate tests were performed for each animal.
G, Bone density of SIRT6 KO animals is significantly reduced, and is partially rescued by NRTI treatment. Data were determined by CT-scan and analysis of 27-day old animals. n=3 animals per group and error bars show s.d. Representative images of the bones are shown in Figure S4D.
H, I, Hind leg muscle mass (H) and fiber thickness (I) are significantly reduced in SIRT6 KO animals and are partially rescued by NRTI treatment. Hind quarters (feet, tibia, femur were separated at pelvis, including all muscle groups, with exception of gluteus maximus) were removed and weighed. Fiber thickness was measured in quadriceps muscles fixed and stained with hematoxylin & eosin. At least 50 fibers were measured for cross sectional diameter per group at similar lateral locations on the quadriceps. n=3 animals per group, error bars show s.d. Representative images of the muscles are shown in Figure S4E.
J, K, NRTIs attenuate apoptosis in the thymus (J) and spleen (K) of SIRT6 KO mice. Apoptosis was measured in single cell suspensions by annexin V/PI staining and flow cytometry. n=5 animals per group, error bars show s.d. asterisks indicate p < 0.01.
Unless stated otherwise, statistical significance was determined by the Student’s t-test and asterisks indicate p < 60.05.
One of the phenotypes of SIRT6 KO mice is hypoglycemia (Xiao et al., 2010; Zhong et al., 2010), which was not rescued by NRTI treatment (Figure S3A). Blood glucose levels continued to decline with age in NRTI-treated SIRT6 KO animals, similar to the control animals (Figure S3A). Previous reports have indicated that SIRT6 KO postnatal wasting can be partially rescued by providing animals with supplemental glucose (Xiao et al., 2010). To test the potential contribution of blood glucose to NRTI-mediated rescue, we provided SIRT6 KO animals with 10% glucose with and without NRTIs. Glucose supplementation alone did not significantly improve median SIRT6 KO lifespan, but yielded two (out of ten) “survivor” mice that outlived the untreated KO mice (Figure S3B). However, when glucose supplementation was combined with the NRTIs it abrogated the NRTI rescue (Figure S3C, D). While the mechanism of this effect was not clear, we hypothesize that the animals may have suffered from increased NRTI dosage due to increased consumption of glucose-containing water. The fact that hypoglycemia was not rescued by NRTIs, and the negative impact of glucose supplementation on the lifespan of NRTI-treated animals indicates that NRTI-mediated rescue occurs independently of blood glucose changes.
In addition to improved body weight and lifespan, NRTI-treated animals showed dramatic improvements in mobility and behavior. Typically, SIRT6 KO animals demonstrate low mobility and unresponsiveness. However, NRTI-treated SIRT6 KO animals displayed a normal flight reflex from exposed locations (Figure 5D and Supplemental videos Video S1-4), foraging activity (Figure 5E), and greatly improved physical function on an inverted screen test (Figure 5F). Postnatal ophthalmological development is also stunted in SIRT6 KO mice, with pups unable to fully-open their eyes. NRTI-treated animals showed significant improvements over control animals (Figure S4A-C). SIRT6 KO animals demonstrated reduced bone density (Figure 5G and Figure S4D) and muscle mass and muscle fiber thickness (Figure 5H, I and Figure S4E), which were significantly improved by NRTI treatment. Additionally, SIRT6 KO animals showed deficiencies in hematopoietic (Figure S5) and intestinal (Figure S6A) stem cell compartments, which were significantly ameliorated by NRTI treatment. SIRT6 KO mice have also been reported to display severe lymphopenia (Mostoslavsky et al., 2006). In agreement with this, we observed elevated levels of apoptosis in thymus and spleen of the SIRT6 KO mice that were attenuated by the NRTI treatment (Figure 5J, K). Cumulatively, these data show that NRTI treatment drastically improves the healthspan of animals displaying elevated L1 activity, indicating an active role for L1s in these pathologies.
NRTI treatment reduces apoptosis and improves health of SIRT6 KO intestines
SIRT6 KO mice have been previously reported to suffer from a severe colitis phenotype (Mostoslavsky et al., 2006). Intestines of SIRT6 KO animals exhibited dramatically reduced thickness of the epithelial layer, atrophied villi and pockets of inflammation, whereas the WT intestines did not (Figure 6A, B). Intestines of SIRT6 KO animals treated with either 3TC or d4T showed improved epithelial thickness and reduced inflammation (Figure 6B, D). In the small intestine, knockout mice displayed shortened villi (Figure 6A, E), decreased number of lamina propria plasma cells and lymphocytes, and pockets of neutrophilic acute inflammation dispersed throughout the lamina propria (Figure 6B). Additionally, apoptosis was significantly elevated in SIRT6 KO intestinal tissue and mucus-producing goblet cells were severely depleted (Figure 6C, F, G). NRTI treatment partially rescued these phenotypes, increasing villi size, vastly reducing debris, ameliorating apoptosis and suppressing inflammation (Figure 6). Restoration of tissue integrity in the intestine stands out in the context of extending SIRT6 KO lifespan, as the mice are characterized by a failure to thrive. Disruption of intestinal integrity is a well-characterized symptom of aging and perturbing intestinal permeability and barrier function is thought to contribute to age-related enteric diseases. No obvious histological differences were seen in the brains, kidneys, hearts, livers and lungs of the different mouse groups (Figure S6B). Combined with the data described in Figure 5, these results suggest that some tissues (specifically, the intestines) are much more effected by LINE1 misregulation. Given the severity of the intestinal phenotypes in SIRT6 KO animals, we hypothesize that the improvements NRTI treated mice display are greatly attributed to improved nutrient uptake facilitated by amelioration of the intestinal pathology.
Figure 6 |. NRTIs improve gut health and reduce villi apoptosis in SIRT6 KO mice.
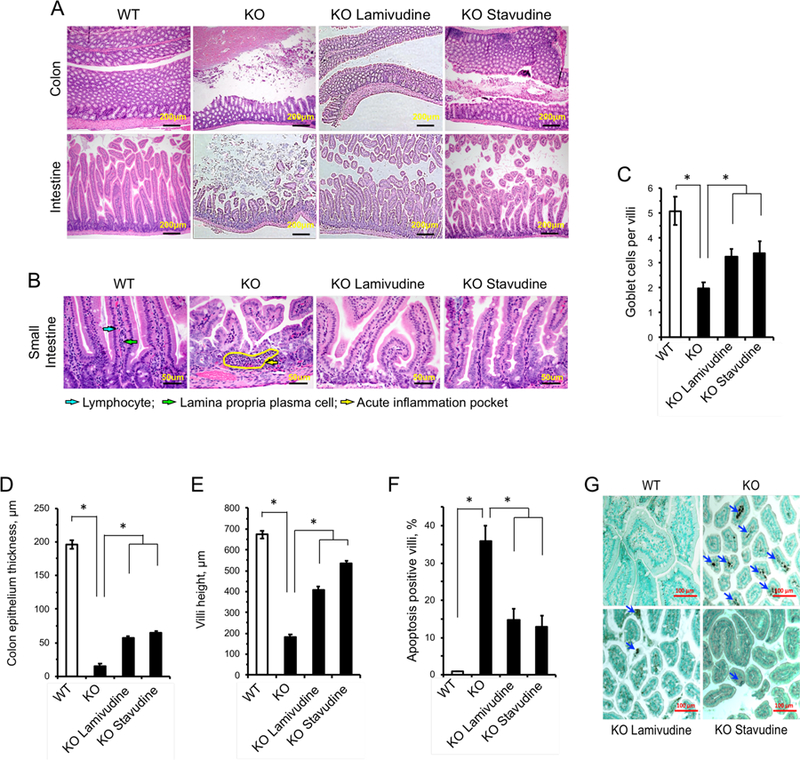
NRTI treatment alleviates tissue pathology in the SIRT6 KO colon and small intestine. Histological examination was performed on four 27 day old animals for each group and representative images are shown.
A, Tissues were stained with Hematoxylin & Eosin and are shown at 100x magnification (scale bars = 200 μm).
B, SIRT6 KO small intestines displayed neutrophilic acute inflammation pockets (yellow arrow) and reduced villi size, in addition to reduced epithelial thickness. Normally abundant plasma cells (green arrow) and lymphocytes (blue arrow) found in WT tissues were rarely seen in SIRT6 KO lamina propria and were not restored by NRTI treatment. Tissues were stained with Hematoxylin & Eosin (scale bars = 50 μm).
C, SIRT6 KO villi have depleted goblet cell populations that are partially restored by NRTI treatment. ≥20 villi were scored.
D, E, NRTI treatment restores the thickness of the epithelial layer (D) and villi height (E) in SIRT6 KO intestines.
F, G, NRTI treatment partially rescues elevated apoptosis observed in SIRT6 KO villi (F). Apoptosis was analyzed by TUNEL staining and villi containing apoptotic cells were scored. G, Representative images of TUNEL results. Blue arrows indicate apoptotic cells.
Statistical significance was determined by the Student’s t-test and asterisks indicate p < 0.05.
L1 misexpression and sterile inflammation in aged mice coincide with cytoplasmic L1 DNA
Since sterile inflammation is a hallmark of aging (Lopez-Otin et al., 2013), we hypothesize that a type I interferon response mediated by age-related activation of L1 elements could play a causal role in this process. Consistent with this hypothesis, L1 expression and type I interferon expression were elevated in several tissues in the WT aged mice (Figure 7A-C), suggesting that L1 activation may be contributing to sterile inflammation associated with normal aging. Consistent with the RNA expression, aged tissues also demonstrated elevated L1 ORF1p accumulation, indicating that L1s are biologically active (Figure 2B, C). WT aged mice also showed increased L1 cytoplasmic DNA (Figure 3C-F). This result indicates that L1 activation is not limited to progeroid SIRT6 mice but is a hallmark of aging. Increase in L1 RNA and DNA in old tissues has been previously reported (De Cecco et al., 2013b).
Figure 7 |. L1 transcripts and interferon response are elevated in WT aged mice and are rescued by treatment with NRTIs and SIRT6 overexpression.

A, L1 transcripts are elevated in tissues of aged (24 month old) animals, and are repressed in aged MOSES mice overexpressing SIRT6.
B, C, Aged tissues show elevated IFN-α/β expression whereas MOSES mice show decreased expression.
Tissues from 4 months and 24 months old BL/6 and 28 months old MOSES animals were analyzed for L1 expression. Young intestine was used as a reference for the other samples after normalization to actin. Statistical significance determined by t-test asterisk indicate p < 0.05.
D, E, F, Treatment with NRTI reduces IFN-α/β and L1 DNA content in 55-week old mice. The data was normalized to actin and WT heart used as a reference. n=5 animals per group, error bars show SEM. Statistical significance was determined by t-test; asterisk indicate p < 0.05.
G, H, MMP3 and IL6 show significant reduction in several tissues of d4T-treated 55-week old mice. The data was normalized to actin and WT heart was used as a reference. n=5 animals per group, Error bars show SEM. Statistical significance was determined by t-test. Asterisks indicate p < 0.05.
I, D4T treatment ameliorates age-related increase in p16 expression in female p16(LUC) reporter mice. n=10 animals per sex per treatment. Statistical significance determined by t-test, asterisk indicate p < 0.05.
J, DNA methylation age estimated with a multi-tissue DNA methylation clock. Analysis is based on 370 out of 435 clock sites. Each group included aged-matched male (n = 3) and female (n = mice. The mean normalized age was 32 weeks for the control (water) group and 23 weeks for the d4T-treated samples. p = 0.046, two-tailed Mann–Whitney U test.
K, Model. L1 activation causes age-related pathologies through induction of DNA damage and a type I interferon response. These pathologies are rescued or attenuated by inhibition of L1 reverse transcriptase with NRTIs.
In order to assess if reverse transcription inhibition impacts normal physiological aging, WT mice were treated with 2 mg/ml d4T from weaning age and tissue type I interferon expression was assayed at 55 weeks. We found that treatment of WT aged mice with d4T significantly reduced type I interferons in several tissues (Figure 7D, E), similar to what was observed in SIRT6 KO animals. Additionally, several tissues demonstrated reduced L1 DNA content (Figure 7F). D4T treatment also showed a trend towards reducing plasma concentration of multiple cytokines and chemokines, including those belonging to senescence-associated secretory phenotype (SASP), e.g., IL-6, IGFBP-3, IGFBB-6, CXCL1, CXCL4, TNF RI, CCL5, G-CSF, MCP-1 as measured by antibody arrays in WT aged mice (Figure S7). Inducibility of these cytokines by poly(I:C), the inducer of interferon response, remained the same with and without d4T treatment suggesting that d4T does not affect interferon signaling pathway per se but rather reduces the levels of endogenous inducers such as cytoplasmic L1 cDNAs.
To further assess the impact of L1 inhibition in aging WT animals, p16 expression was evaluated using control and d4T-treated WT mice harboring a reporter where p16 promoter is fused to the Luciferase gene p16(LUC) (Burd et al., 2013). p16(LUC) mice were started on a regiment of 2 mg/ml d4T at 46 weeks and luciferase activity was measured at 46, 55 and 68 weeks of age. As expected, the luminescence of p16(LUC) mice increased with age. Regardless of a high degree of variability that is typical for this biomarker (Burd et al., 2013), significant differences between control and d4T treated groups were observed in p16(LUC) female mice assessed on the 55th week of life (Figure 7I). Similar tendency was observed in males, which, however, did not reach statistical significance within the group sizes used. Deaths from chronological aging occurred by the time of the next measurement of luminescence (68th week) resulting in drops of group sizes leading to increase in signal variability and reduction of statistical power.
In order to address the effect of d4T treatment on the DNA methylation age (DNAm age), Reduced Representation Bisulfite Sequencing (RRBS) was performed on 12 blood samples of treated and untreated mice of both sexes applying the lifespan multi-tissue DNA methylation clock (Meer et al., 2018). The clock showed that the DNAm age of d4T-treated samples was lower (p = 0.046, two-tailed Mann–Whitney U test), indicating that d4T treatment reduced mouse methylation age (Figure 7J). Given these results, it is reasonable to suggest that the progressive loss of L1 silencing in aged systems significantly contributes to age-related sterile inflammation and other hallmarks of aging, including p16 expression and the methylation clock.
To test whether SIRT6 can suppress L1 in the wild type aged mice, we tested RNA from the livers of aged mice constitutively overexpressing SIRT6 (MOSES mice) (Kanfi et al., 2012). Remarkably, the age-related increase in L1 and type I interferon transcription were rescued in aged MOSES mice compared to their littermate controls (Figure 7A-C) indicating that elevated SIRT6 activity prevents age-related L1 activation during normal aging. Taken together, these data indicate that L1 suppression not only impacts the progeroid phenotypes observed in SIRT6 KO animals, but similarly impacts normal aging pathologies.
DISCUSSION
L1s are elevated and, in some cases, causative in pathologies, including inflammation, cancer and neurodegenerative diseases. Here, we demonstrate an active role for these retrotransposons in the progeroid phenotypes associated with SIRT6 deficiency in mice. In this study, we demonstrate that inhibiting L1 RT activity not only alleviates the cellular and physiological dysfunctions of SIRT6 KO mice, it also extends the lifespan of these animals and correlates with observations in WT aged animals. Specifically, we show that L1 activity results in increased cytoplasmic L1 DNA, inducing a type I interferon response through cGAS cytosolic DNA sensing and promoting pathological inflammation. These results, combined with similar observations in aged, WT mice, strongly support a detrimental role for L1s in the process of normal aging. Moreover, this study indicates that L1 activity contributes to the pathology of SIRT6 deficient mice.
It should be noted that NRTIs are not specific to specific reverse transcriptases. There remains the possibility that other retroelements, such as endogenous retroviruses, may contribute to aging pathologies. However, we were able to strongly recapitulate the results in cell culture experiments using NRTIs by using RNAi targeting several conserved regions on L1 families, indicating that L1 activity is the major contributor to the observed pathologies. Indeed, with L1s constituting the most abundant class of retroelements, it is reasonable to surmise that they make the major contribution to the RT-related type I interferon response.
Interestingly, we found that WT aged mouse tissues display elevated L1 expression and induction of type I interferons, similarly to the progeroid SIRT6 KO. These observations compliment those reported for the higher incidence of DNA damage in aged tissues, similar to that seen in SIRT6 deficient models. Taken together, these results suggest that activation of L1 elements contributes to both age-related genomic instability and sterile inflammation associated with aging. The progressive activation of L1s with age may occur due to loss of silencing (De Cecco et al., 2013a; Villeponteau, 1997) and redistribution of chromatin modifiers such as SIRT1 and SIRT6 (Oberdoerffer et al., 2008; Van Meter et al., 2014).
NRTI treatment was able to greatly improve the health and cellular pathologies in SIRT6 KO mice, however it did not fully rescue the shortened lifespan. This indicates that there are other factors outside of L1 activity impacting these pathologies such as misregulation of glucose homeostasis (Mostoslavsky et al., 2006; Zhong et al., 2010). Furthermore, NRTIs rescue the accumulation of cytoplasmic L1s and type I interferon response but do not target L1 transcription which may also be contributing to the burden these abundant retroelements impose on the cell.
NRTIs, themselves, can pose adverse health effects, as patients treated chronically with NRTIs have demonstrated hepaptoxicity and other pathologies due to inhibition of mitochondrial DNA polymerase gamma (Montessori et al., 2003; Wu et al., 2017). Consistent with these reports, we did not observe an improvement in inflammation markers in the liver tissue, save for type I interferons. Additionally, NRTIs are known to inhibit telomerase and are believed to contribute to observations of accelerated aging in HIV patients (Hukezalie et al., 2012; Leeansyah et al., 2013). In mice, these drugs may have deleterious effects due to inhibition of telomerase, either by contributing to telomere erosion or by interfering with other functions of telomerase. While NRTI may prove an effective treatment to conditions predicated by L1 activity, it would not be an ideal solution to combat normal, physiological aging. As such, the development of more targeted, anti-L1 interventions is now a necessary extension of these and other recent findings linking aberrant L1 activation to human disease. Such interventions may include specific non-NRTI inhibitors of L1 RT that do not inhibit other cellular polymerases. Additionally, as L1s rely on several components to form an active RNP, there exists the exciting possibility of developing small molecule inhibitors target these assemblies more specifically. Novel strategies to combat inflammation triggered by cytoplasmic L1s such as more efficient degradation of cytoplasmic L1 DNAs or inhibition of cGAS/STING sensing pathways may be equally effective. As SIRT6 plays a key role in silencing L1s, SIRT6 activators may prove to be effective at counteracting age-related loss of L1 silencing. The development of less toxic NRTIs in recent years may provide solutions in the interim.
Several studies have demonstrated that cytosolic DNAs can trigger innate immune responses that contribute to cellular senescence and aging (Dou et al., 2017; Gluck et al., 2017; Thomas et al., 2017; Yang et al., 2017). The identity of the cytosolic DNAs, however, has been a mystery. Recently, it has been reported that accumulation of L1 cDNA in the cytosol of TREX1 deficient neurons drives type I interferon production and leads to apoptosis (Thomas et al., 2017). In this study, we demonstrate that these repetitive elements significantly contribute to the cellular and physiological pathologies experienced by SIRT6 deficient animals including type I interferon response and other inflammation markers. Many of these pathologies are mirrored in both mouse and human physiological aging, including L1 activation and sterile inflammation. Importantly, L1 inhibition in the WT aged mice leads to reduced inflammation and decrease in aging biomarkers including p16 expression and methylation age. Here we propose that the L1 activation and the resulting cytosolic L1 cDNAs, along with L1-mediated genomic instability contribute to age-related inflammation and other aging pathologies (Figure 7K). Thus, L1 inhibition may be a viable strategy for treatment of age-related diseases. Interventions aimed at inhibiting L1 activity and the related inflammation, may hold the potential to supplement other treatments or serve as a new form of therapy for age-related pathologies. Future work on effective dosages, late life animal treatments, and developing specific and less toxic anti-L1 inhibitors will pave the way for the future translational applications.
Limitations of Study
While the work presented here has demonstrated the role of L1s in aging and SIRT6-deficiency related pathologies, several aspects of this process remain to be clarified. We do not know the mechanism leading to formation of cytoplasmic cDNA copies. Such copies can potentially arise from reverse transcription in the cytoplasm primed by random RNA fragments or L1 DNAs can escape from the nucleus. Additionally, our analysis was limited to active families of L1 transposons. As such, the activity of other transposable elements in aged tissues remains to be examined.
STAR★METHODS
CONTACT FOR REAGENT AND RESOURCE SHARING
Further information and requests for resources and reagents should be directed to and will be fulfilled by the Lead Contact, Vera Gorbunova (vera.gorbunova@rochester.edu).
EXPERIMENTAL MODEL AND SUBJECT DETAILS
Mice and cell lines
SIRT6 KO and WT mice were acquired from Jackson laboratories (strain 129 Sirt6tm1Fwa/J, 006050) and maintained in accordance with the regulations designated and approved by the University of Rochester Committee on Animal Resources (UCAR), which adheres to FDA and NIH animal care guidelines and reviews all animal protocols prior to approval (UCAR 2017–027). Animals were housed using microisolator technology in SPF conditions in a one-way facility. All mouse-derived cell lines were isolated from these animals. All primary cells were maintained in physiological 3% O2 concentration. All cell lines were tested every month for mycoplasma contamination. Both cell line and mouse reagents were derived from mixed sex cohorts determined by anogenital distance (in the case of organ derived cell lines) or by Sry PCR genotyping (in the case of MEFs). Experimental WT and SIRT6 KO MEF cell lines were represented by both male and female-derived cell lines. The SIRT6 identity of the cell lines was authenticated by PCR genotyping. MOSES mice (Kanfi et al., 2012) were all male and provided from Bar Ilan University.
METHODS DETAILS
NRTI treatments
Pregnant SIRT6 heterozygous mice were administered 2 mg/ml 3TC or d4T in drinking water starting immediately after mating. Postnatally, the pups were given 400 mg/kg/day d4T, or 600 mg/kg/day 3TC, or water (control) by a flexible pipette into the animal’s mouth once a day.
For treatment of the WT mice, male and female C57BL/6 mice, after weaning, received d4T in drinking water at 2 mg/ml. Mice were euthanized for blood and tissue collection at 55 weeks of age.
Analysis of cytokines in mouse plasma following d4T treatment
55-week-old C57BL/6 mice were maintained either with or without 2 mg/ml d4T in drinking water (neutral pH) since weaning (4–5 week old). After reaching 61 weeks of age, mice from each group were either treated or untreated with i.p.-injected poly(I:C), 25 mg/mouse, to induce interferon type I response. Control groups were injected with the vehicle (PBS). Blood was collected 6 hours post treatment using heparin tubes. Equal volumes of plasma were combined from two males and two females from each group for the detection of circulating cytokines and chemokines using Mouse Cytokine Antibody Array C3 kit (RayBiotech, Norcross, GA) according to the manufacturer’s protocol. Briefly, the membranes precoated with capture antibodies were blocked and then incubated with plasma overnight at 4°C (plasma was diluted two-fold with blocking buffer). The membranes were then washed with washing buffer and incubated with biotinylated detection antibody cocktail overnight at 4°C. Following this step, the membranes were washed once again and incubated with streptavidin-HRP for two hours and developed using detection buffers provided in the kit. The immunoblot images were captured and visualized using the BioRad Molecular Imager GelDoc and the intensity of each spot was analyzed using ImageJ software.
Cell culture
All cell lines were maintained in humidified incubators at 5% CO2, 5% O2, at 37°C. Cells were grown in Eagle’s minimum essential medium with 15% fetal bovine serum and 1x penicillin/streptomycin. Drug treated cells were supplemented with 10 μM 3TC or D4T. The cell lines are routinely tested for mycoplasma contamination.
Transfections
Transfections were carried out by plating cells at a density of 500,000 cells/10 cm plate two days prior to transfection. Transfections were carried out using the Amaxa Nucleofector with Normal Human Dermal Fibroblast transfection solution.
Quantitative RT-PCR
Total RNA was isolated from cells at 80% confluence using Trizol Reagent and then treated with DNase. cDNA was synthesized using Superscript III (Life Technologies) cDNA kit with the Random Hexamer primer. qRT-PCR was performed on the BioRad CFX Connect Real Time machine with SYBR Green Master Mix (BioRad) using 30 ng of cDNA per reaction with 4x reactions/sample. Probes targeting a conserved region of the L1MdA1 family the first 108 bp of ORF1 coding region were used to assess full length L1 transcripts. Additonal primers targeting bp 2288–2430 of the L1MdA ORF2 reading frame were assessed, along with primers to the L1MdTf family ORF1 and ORF2 reading frames (bp 706–900 and bp 3362–3536, respectively). All primer sets were tested for specificity and efficiency. All primer sets produced comparable results and expression trends equivalent to the L1MdA ORF1 primer pair. Efficiency verified L1MdA1 (mL1) primers previously described were used to assess L1 transcript abundance standardized to QuantumRNA Actin Universal primers (Van Meter et al., 2014). All primers can be found in Key Resources Table.
KEY RESOURCES TABLE.
| Antibodies | Source | Identifyer |
| Mouse Anti- γH2AX | Abcam | ab22551 |
| Rabbit Anti-53BP1 | Abcam | ab36823 |
| Goat Anti-Rabbit Alexa Fluor 488 | ThermoFisher | A-11008 |
| Goat Anti-Mouse Alexa Fluor 488 | ThermoFisher | A-11001 |
| Anti-Mouse Lineage-Pacific blue | BioLegend | 133310 |
| APC Anti-Mouse Ly-6A/E | BioLegend | 122511 |
| Anti-Mouse c-Kit-PE/Cy7 | BioLegend | 105813 |
| APC/Cy7 Anti-Mouse CD48 Antibody | BioLegend | 103431 |
| PerCP/Cy5.5 Anti-Mouse CD150 Antibody | BioLegend | 115921 |
| Rabbit Anti-cGAS 1 | Cell Signaling | D3080 |
| Rabbit Anti-cGAS 1 | Millipore | ABF124 |
| Anti-ssDNA | Millipore | MAB3868 |
| Anti-L1 ORF1p Mouse momoclonal | Jef Boeke | EA13 |
| Rabbit β-Tubulin | Abcam | ab6046 |
| Goat Anti-Rabbit HRP | Abcam | ab6721 |
| Critical Commercial Assays | Source | Identifyer |
| Annexin V Staining Kit | Roche | 11828681001 |
| DNeasy Blood and Tissue Kit | QIAGEN | 69504 |
| Superscript III First Strand Synthesis System | ThermoFisher | 18080051 |
| PureLink RNA Mini Kit | ThermoFisher | 12183018A |
| PureLink Dnase | ThermoFisher | 12185010 |
| In situ Apoptosis Detection Kit | Abcam | ab206386 |
| SsoAdvanced Universal SYBR Green Supermix | BioRad | 1725270 |
| CometAssay System | Trevigen | 4250–050-K |
| BLOCK-iT Pol II miR RNAi Expression Vector Kit | ThermoFisher | K4935–00 |
| iLenti™ siRNA Expression System | Abmgood | LV310 |
| Mouse Cytokine Antibody Array C3 | RayBiotech | AAM-CYT-3–2 |
| Chemicals, Peptides, and Recombinant Proteins | Source | Identifyer |
| Stavudine | Sigma | 1620209–250MG |
| Lamivudine | Aurobindo Pharma | 65862055330 |
| Ribozol | VWR | 97064–948 |
| Experimental Models: Cell Lines | Source | Identifyer |
| Mouse Embryonic Fibroblasts | Isolated from SIRT6 KO and WT mice | N/A |
| Experimental Models: Organisms/Strains | Source | Identifyer |
| 129S6 SIRT6 KO | Jackson Labs | 006050 |
| 129S6 WT | Jackson Labs | 006050 |
| C57BL/6J | Jackson Labs | 000664 |
| Oligonucleotides | Source | Identifyer |
| mL1 Fwd-ATGGCGAAAGGCAAACGTAAG | IDT | N/A |
| mL1 Rev-ATTTTCGGTTGTGTTGGGGTG | IDT | N/A |
| IFN-α Fwd-TCTGATGCAGCAGGTGGG | IDT | N/A |
| IFN-α Rev-AGGGCTCTCCAGACTTCTGCTCTG | IDT | N/A |
| IFN-β Fwd-GCACTGGGTGGAATGAGACT | IDT | N/A |
| IFN-β Rev-AGTGGAGAGCAGTTGAGGACA | IDT | N/A |
| Genomic GAPDH Fwd-TGGCCTTCCGTGTTCCTACC | IDT | N/A |
| Genomic GAPDH Rev-ACCAGAGACAAGCCCAGCTC | IDT | N/A |
| 5S Fwd-CTCGTCTGATCTCGGAAGCTAAG | IDT | N/A |
| 5S Rev-GCGGTCTCCCATCCAAGTAC | IDT | N/A |
| For Additional Primers See Supplemental Table 1 | ||
| Recombinant DNA | Source | Identifyer |
| CAG-mLINE1-EGFP | Wenfeng An, et al 2009 | pESD202 |
| Software | Source | Identifyer |
| CASP | N/A | http://casplab.com/ |
| GraphPad Prism 7 | GraphPad Software | https://www.graphpad.com/scientific-software/prism/ |
| ImageJ | N/A | https://imagej.nij.com/ij/ |
| FlowJo 7.6.5 | FlowJo LLC | https://www.flowjo.com/ |
| ImageLab | BioRad |
L1 DNA content
Tissues were harvested from animals and immediately frozen in liquid nitrogen. Tissues were cold processed with pestle and mortar and then genomic DNA was isolated using Quiagen’s DNeasy Blood and Tissue kit. DNA concentration was measured in quadruplicate and then serially diluted to 3 picograms/μl. Two μl of diluted genomic DNA was then loaded into SYBR Green Master Mix reaction and assayed using mL1 primers on BioRad CFX Connect Real Time machine.
Cytoplasmic DNA extraction
For MEFs, cells were grown to 75% confluence, gently trypsinized from the plate, counted and collected by centrifugation. A cytoplasmic lysis solution (Shen et al., 2015) was used to resuspend cells, which were incubated at 4°C on a rotor for 10 min. Nuclei were removed by centrifugation and the supernatant was treated as previously described (Shen et al., 2015). A solution of 3M CsCl, 1M potassium acetate, and 0.67M acetic acid was added to supernatant, incubated on ice for 15 min, then centrifuged to remove any residual cellular debris and genomic DNA before column purification using Qiaquick PCR cleanup columns. Final elutions were quantified and assayed for nuclear genomic contamination using primers for GAPDH and 5S ribosomal subunit with 10 ng of DNA via qPCR.
For organs, organs were harvested from animals and mixed cell-type cultures were generated from the organs in F12 media (Gibco). Cells were passaged once after initial colonies formed from processed tissue. At 75% confluence, cyptoplasmic fractions were isolated by direct application of cytoplasmic lysis solution direction to the plate and incubated at 4°C with gentle shaking for 10 min. Lysates were then collected and processed in the same manner as described above.
Mouse activity assays
For flight response assays, animals were placed in an open arena in the center of a 4” radius stage and then timed until they fully exited the stage. Full exit is defined as all four limbs outside of the circle. Each animal was tested 3 times, with 30 min rest intervals in normal housing between trials.
Foraging and exploration activity were assayed by placing animals in a gridded arena for 30 sec at a time. A camera was used to record animal movement, which was then quantified using Tracker software. Animals were allowed to rest in 30 min intervals between trials in normal housing to prevent acclimation to the arena.
Mouse strength was assayed by inverted screen test as described in (Deacon, 2013). A mouse was placed in the center of the wire mesh screen, the screen was rotated to an inverted position over 2 sec, with the mouse’s head declining first. The screen was kept above a padded surface. The time when the mouse fell off was recorded. The following scoring was used: Falling between 1–10 sec = 1; Falling between 11–25 sec = 2; Falling between 26–60 sec = 3; Falling after 60 sec = 4. For each animal the point score was calculated as a sum of the scores for three trials.
Immunofluorescence and apoptosis
γH2AX and 53PB immunostaining was carried out as previously described (Mao et al., 2011). Anti-γH2AX and anti-53BP1 antibody was purchased from Abcam (ab22551 and ab36823). For ssDNA immunostaining, cells were fixed with PFA, followed by 24hr methanol incubation at −20°C. Cells were then incubated at 37°C for 4hrs with RNaseA. Antibody from Millipore (MAB3868). Apoptosis in fibroblasts was measured using the Annexin V Staining Kit (Roche). Apoptosis in tissues was measured using TUNEL method with in situ apoptosis detection kit, Abcam (ab206386).
Western blotting
Cells and tissues were collected using a 5% SDS, 100mM Tris pH=7 solution and incubated on ice for 15 min, during which time the samples were passed through a large guage needle several times and vortexed every 5min. Samples were then spun at 14,000 RPM to remove debris and the supernatant was mixed 1:1 with 2x laemmli buffer. Samples were boiled for 20min before being centrifuged at 14,000 RPM for 1min and loaded into a BioRad Criterion 4–20% gel. After transfer to PDVF membrane and blocked (5% dehydrated milk) for 2hr at RT, membranes were incubated overnight with 1:500 dilution of ORF1p or 1:10,000 β-tubulin in 2.5% blocking buffer. Membranes were washed 3x with TBST for 10 min each before secondary antibody in TBST was added for 2hr incubation at RT. Membranes were washed and then imaged.
ORF1p Immunostaining
Liver specimens from 5m and 25m old animals were embedded in OCT and cyrosectioned to 8 μm. Slides were then fixed with 4% PFA and 0.5% Triton X-100 in PBS for at room temp for 20min. Slides were blocked with 4%BSA, 2% donkey serum and 0.1% Triton X-100 for 1hr at RT. Anti-ORF1p antibody diluted in blocking solution (1:200) was incubated on slides overnight at 4°C in a rocking humidified chamber. Slides were washed with PBS+0.2% Triton X-100 3x for 15min. Secondary antibody (AlexaFluor 546, Life Technologies) diluted in blocking buffer was added and incubated for 2hr at RT, followed by 3× 15min washes with PBS+Triton X-100. Slides were stained with 2ug/ml DAPI in PBS+0.2% Triton X-100 for 15 min, prior to mounting with ProLong Antifade Mountant.
Histology
Mouse tissue was fixed in Bouin’s fixative prior to being embedded in paraffin. Fixed tissues were then sectioned at 6 μm and hematoxylin/eosin staining was performed by standard methods at the University of Rochester Medical Center’s HBMI core.
Synthesis of 5’-O-Methyl d4T
Reaction was conducted in oven-dried glassware under an argon atmosphere. Reaction solvents were obtained from a solvent system by Innovative Technologies Inc. Reagent grade solvents were used for all work-up procedures and extractions. D4T was purchased from Matrix-Scientific, sodium hydride (60 % dispersion in mineral oil) and methyl iodide were purchased from Sigma-Aldrich. Nuclear magnetic resonance spectra were obtained on a Bruker Avance 500 MHz spectrometer. Mass spectra were obtained using a Shimadzu LCMS-2010 mass spectrometer.
To a solution of d4T (224 mg, 1 mmol) in dry THF/DMF (6 mL, 5:1 v/v) was added sodium hydride (400 mg, 10 mmol). The reaction mixture was stirred for 10 min under an argon atmosphere. The reaction mixture was then cooled to 0°C, and methyl iodide (67 μL, 1 mmol) was added slowly. The reaction mixture was stirred overnight while temperature was slowly raised from 0°C to room temperature. The reaction was quenched by methanol, neutralized by acetic acid, then volatiles were removed by evaporation. DMF was removed by azeotropic distillation with toluene. The resulting solid was suspended in DCM, and the mixture was washed with aq. NaHSO3. The organic layer was dried over magnesium sulfate, concentrated in vacuo, and then purified by silica gel chromatography (elution by 1:1 then 1:4 hexanes/EtOAc) to afford 148 mg of the final product, > 97% purity. The spectroscopic and spectrometric data were consistent with those reported in the literature (Fowler et al., 2014). 1H NMR (500 MHz, DMSO, ppm): δ 11.31 (s, 1H), 7.50 (d, 1H), 6.82 (dd, 1H), 6.42 (dd, 1H), 5.91 (dd, 1H), 4.88 (s, 1H), 3.56 (m, 2H), 3.28 (s, 3H), 1.75 (s, 3H)
Comet assays
Mouse embryonic fibroblasts were maintained in control or drug treated media for 15 population doublings and then analyzed for DNA damage using the Trevigen CometAssay system. In brief, non-confluent cells were embedded in agarose, fixed, and then subjected to electrophoresis in a neutral buffer solution. Cells were then stained using SYBR Gold and analyzed by microscopy. Quantitative analysis was performed using CASP software.
Blood glucose analysis
Blood was collected from tail bleeds at the indicated age, and serum glucose was measured. Serum glucose was measured using One-Touch Ultra-2 blood glucose glucometer kit, per the manufacturer’s instructions.
Bone marrow stem cell counting
Bone marrow nucleated cells were isolated from 2 femurs and 2 tibias from each mouse, stained with trypan blue and counted. Two million bone marrow cells were stained with DAPI and antibodies (BioLegend): anti-mouse lineage-Pacific blue, anti-mouse Sca1-APC, anti-mouse c-Kit-PE/Cy7, anti-mouse CD48-APC/Cy7, anti-mouse CD150-PerCP/Cy5.5, followed by flow cytometry analysis. In methylcellulose assay, 50,000 cells per ml were plated onto ultra-low attachment 35mm plates, incubated in a humidified 37°C incubator with 5% CO2 and 20% O2. Colonies were scored 12–14 days later.
LINE1 RNAi vector systems
The ABM Good iLenti siRNA vector system was used to generate the siRNA cassette using the conserved L1 sequence, TGGACCAGAAAAGAAATTCCTC.
The BLOCK-iT Pol II miR RNAi Expression Vector was used to generate the shRNA expressing vector. Five shRNAs were combined into the final vector. The targeting sequences are as follows; shRNA 1: TCCAAATAGACTGGACCAGAA, shRNA 2: AGAGCCTGGACAGATGTTATA, shRNA 3: GAGGAGTAGACGGCAGGAAAT, shRNA 4: TGGGATTAGTGCAGAGTTCTA, shRNA5: CCATACTTATCTCCTTGTACT
DNA FISH
Cells were rinsed with PBS and then fixed with 4% paraformaldehyde for 10 min at 37°C, followed by a wash with ice-cold PBS and cold 100% methanol for 10 min. 70% ethanol was added and incubated at RT for 10 min. Cells were incubated with 1mg/ml RNase A for 30min at RT. 1M Tris pH 8.0 was added for 5 min prior to addition 2 ng/μl of 5’ AlexaFluor 288 labeled probe in hybridization buffer (1mg/ml yeast tRNA, 0.005% BSA, 10% dextran sulfate, 25% dionized formamide, 2X SCC). Slides were incubated overnight in a humidity box at 37°C. Cell were then washed once with 4x SCC for 5min, followed by 3 washes with 2x SCC for 5min. Mounting media with DAPI was added and the slides sealed. For controls, slides were incubated with PureLink DNase for 15min prior to probe hybridization.
Immunoprecipitation of cGAS
Cultured MEFs were washed with PBS prior to crosslinking and fixation. 200mJ of UV radiation was applied using a Stratolinker UV system, followed by cell harvest and counting. Cells were then fixed for 10 min in 4% PFA and washed 3x with PBS. Cells were then lysed for 30 min at 4 °C while rotating using a lysis buffer containing 20 mM Tris-HCl [pH 7.5], 0.5 mM EDTA, 150 mM NaCl, 10 mM KCl, 0.5% Triton, 1.5 mM MgCl2, 10% glycerol, 0.2 mM PMSF, 10 mM β-mercaptoethanol. Lysates were cleared by centrifugation at 12,000g for 30 min at 4 °C. cGAS was bound using either 5ug cGAS D3080 (Cell Signaling) or ABF124 (Millipore) for an overnight incubation, followed by the addition of 30 μl of Agarose A beads with salmon sperm DNA and 2h incubation while rotating. Beads were washed 5x with lysis buffer before DNA isolation using Qiagen DNeasy Blood and Tissue kit.
p16 Luciferase measurement in d4T treated mice
Forty six weeks old male and female p16(LUC) mice were imaged to estimate the luminescence and randomized based on the cumulative luciferase signal between groups maintained on regular water or on water with 2 mg/ml of d4T. Level of luminescence of each individual mouse was assessed on week 9 and 22 following placement on d4T (55 and 68 weeks of age, respectively).
Male and female C57BL/6J mice with hemizygous p16(Ink4a) knock-in of firefly luciferase (p16Ink4a/Luc) were obtained from our breeding colony, originally obtained from Dr. Norman Sharpless (Burd et al., 2013). To assess accumulation of p16(LUC)-positive cells, mice were injected intraperitoneally with a 200 μl solution of 15 mg/mL D-luciferin potassium salt (Syd Labs; Boston, MA) in D-PBS without calcium and magnesium. At 10 minutes post-injection, isoflurane-anesthetized mice were placed into the IVIS Spectrum in vivo bioluminescent imaging system (PerkinElmer; Waltham, MA) for detection of luciferase activity (60-second exposure). Bioluminescence in p16(LUC) mice was quantified as total flux (p/s) of luminescent signal from the whole body using via Living Image® software.
Methylation clock analysis
DNA was extracted from 100 μl of whole blood using DNeasy Blood and Tissue Kit from Qiagen and eluted in 50 μl of 10 mM Tris-HCl buffer, pH 8.0. Then, 2 μl of RNase A (Life Technologies) was added to each sample. Samples were incubated at room temperature for 5 min, and DNA was prepared by using Genomic DNA Clean & Concentrator-10 (Zymo). DNA was eluted in 25 μl of TE buffer (10 mM Tris-HCl, 0.1 mM EDTA, pH 8.0) and quantified using a Qubit 2.0 (Life Technologies). Reduced representation bisulfate sequencing (RRBS) sample preparation was performed using 100 ng of DNA following a previously published protocol (Petkovich et al., 2017). In order to avoid batch effects, we grouped samples into the libraries distributing each group of samples into different libraries. In total, we had three libraries, each including one sample of control male, control female, treated male and treated female. The libraries were sequenced with Illumina HiSeq2500, PE150 with an average of 26 million reads per sample. 20% of PhiX was spiked in to compensate for low complexity of the libraries. The reads were trimmed using Trim Galore v0.4.1 (RRID:SCR_011847) with the parameters --rrbs and --paired. The filtered reads were mapped to the mouse genome (GRCm38/mm10) using Bismark v0.15.0 (RRID:SCR_005604) with default parameters to obtain methylation levels and coverage per site. Sites with coverage lower than 10 reads were filtered out. Only the sites which were present in all samples were included in the analysis. This resulted in 370 out of 435 for the whole lifespan multi-tissue clock (Meer et al., 2018). Since the samples had slight variation in chronological ages, we normalized the estimated age to the mean of the chronological age of samples analyzed and used the normalized DNAm age for comparisons.
QUANTIFICATION AND STATISTICAL ANALYSIS
Unless otherwise noted, the Student’s t-test was used to determine statistical significance between groups. Lifespan assays were analyzed with the log-rank test. Body weight curves were analyzed using one-way ANOVA. All tests were two-tailed and p-values were considered significant below a 0.05 threshold. Cell culture experiments utilized at least two separately derived cell lines for each genotype and were performed in triplicate unless noted otherwise. For animal studies the sample size reflects a balance between the minimum numbers necessary for efficient analysis and some surplus animals to take into account individual variation.
Supplementary Material
WT mice (27 days old) perform in open field and foraging activity test.
SIRT6 KO mice (27 days old) perform in open field and foraging activity test.
SIRT6 KO mice (27 days old) treated with 3TC perform in open field and foraging activity test.
SIRT6 KO mice (27 days old) treated with d4T perform in open field and foraging activity test.
HIGHLIGHTS.
SIRT6KO mice accumulate L1 cDNA triggering interferon response via cGAS pathway
Wild type aged mice accumulate L1 cDNA and display type I interferon response
Reverse transcriptase inhibitors rescue type I interferon response and DNA damage
Reverse transcriptase inhibitors extend lifespan and improve health of SIRT6KO mice
CONTEXT AND SIGNIFICANCE.
The process of aging is a complex phenomenon that is influenced by many factors. Within cells, selfish genetic elements known as LINE1 retrotransposons have long been suspected as causative agents of aging, as they become more and more active with age. By understanding how the activity of these retrotransposons impact health and aging, we can better understand the process by which cells age and how to combat the deleterious effects. Here, we show that the activation of the most prevalent retrotransposons, LINE1s, have a direct impact on aging pathologies. Additionally, we show that inhibiting the LINE1s improves animal health and reduces inflammation. These findings open up new potentials for combating age-related inflammation and disease.
(1) What is the work about? (2) Why is it important to study this question? (3) What did the results show? (4) What are the implications of the findings?
Mammalian aging is complex and likely reflects accumulated damage to our genes/DNA. Retrotransposons are a special class of parasitic genetic elements which can replicate their DNA within our genes, at times amounting up to 20% of human DNA. Retrotransposons, such as the commonly occurring L1, have been associated with aging, neurodegeneration and cancer. Scientists at the University of Rochester uncovered L1 retrotransposons as the culprit in many aspects of accelerated aging in mice, which parallel human aging, which they also linked to inflammation. Experimentally blocking retrotransposon amplification improved the health and lifespan of old mice. Although there is a long road ahead, inhibiting retrotransposon activity, and the related inflammation, could eventually be a therapy for age-related diseases.
ACKNOWLEDGEMENTS
We thank Jef Boeke and Emily Adney for ORF1p antibody. This work was supported by grants from the US National Institutes of Health to S.L.H., J.M.S., A.S., A.V.G. and V.G., and Life Extension Foundation to A.S. and V.G.
Footnotes
Publisher's Disclaimer: This is a PDF file of an unedited manuscript that has been accepted for publication. As a service to our customers we are providing this early version of the manuscript. The manuscript will undergo copyediting, typesetting, and review of the resulting proof before it is published in its final citable form. Please note that during the production process errors may be discovered which could affect the content, and all legal disclaimers that apply to the journal pertain.
DECLARATION OF INTERESTS
The authors declare no competing interests.
REFERENCES
- Ablasser A, Hemmerling I, Schmid-Burgk JL, Behrendt R, Roers A, and Hornung V (2014). TREX1 deficiency triggers cell-autonomous immunity in a cGAS-dependent manner. J Immunol 192, 5993–5997. [DOI] [PubMed] [Google Scholar]
- An W, Dai L, Niewiadomska AM, Yetil A, O’Donnell KA, Han JS, and Boeke JD (2011). Characterization of a synthetic human LINE-1 retrotransposon ORFeus-Hs. Mobile DNA 2, 2. [DOI] [PMC free article] [PubMed] [Google Scholar]
- Burd CE, Sorrentino JA, Clark KS, Darr DB, Krishnamurthy J, Deal AM, Bardeesy N, Castrillon DH, Beach DH, and Sharpless NE (2013). Monitoring tumorigenesis and senescence in vivo with a p16(INK4a)-luciferase model. Cell 152, 340–351. [DOI] [PMC free article] [PubMed] [Google Scholar]
- Crichton JH, Dunican DS, Maclennan M, Meehan RR, and Adams IR (2014). Defending the genome from the enemy within: mechanisms of retrotransposon suppression in the mouse germline. Cell Mol Life Sci 71, 1581–1605. [DOI] [PMC free article] [PubMed] [Google Scholar]
- Dai L, Huang Q, and Boeke JD (2011). Effect of reverse transcriptase inhibitors on LINE-1 and Ty1 reverse transcriptase activities and on LINE-1 retrotransposition. BMC biochemistry 12, 18. [DOI] [PMC free article] [PubMed] [Google Scholar]
- De Cecco M, Criscione SW, Peckham EJ, Hillenmeyer S, Hamm EA, Manivannan J, Peterson AL, Kreiling JA, Neretti N, and Sedivy JM (2013a). Genomes of replicatively senescent cells undergo global epigenetic changes leading to gene silencing and activation of transposable elements. Aging Cell 12, 247–256. [DOI] [PMC free article] [PubMed] [Google Scholar]
- De Cecco M, Criscione SW, Peterson AL, Neretti N, Sedivy JM, and Kreiling JA (2013b). Transposable elements become active and mobile in the genomes of aging mammalian somatic tissues. Aging (Albany NY) 5, 867–883. [DOI] [PMC free article] [PubMed] [Google Scholar]
- Deacon RM (2013). Measuring the strength of mice. Journal of visualized experiments : JoVE [DOI] [PMC free article] [PubMed]
- Dewannieux M, Esnault C, and Heidmann T (2003). LINE-mediated retrotransposition of marked Alu sequences. Nat Genet 35, 41–48. [DOI] [PubMed] [Google Scholar]
- Dou Z, Ghosh K, Vizioli MG, Zhu J, Sen P, Wangensteen KJ, Simithy J, Lan Y, Lin Y, Zhou Z, et al. (2017). Cytoplasmic chromatin triggers inflammation in senescence and cancer. Nature 550, 402–406. [DOI] [PMC free article] [PubMed] [Google Scholar]
- Fowler BJ, Gelfand BD, Kim Y, Kerur N, Tarallo V, Hirano Y, Amarnath S, Fowler DH, Radwan M, Young MT, et al. (2014). Nucleoside reverse transcriptase inhibitors possess intrinsic anti-inflammatory activity. Science 346, 1000–1003. [DOI] [PMC free article] [PubMed] [Google Scholar]
- Gasior SL, Wakeman TP, Xu B, and Deininger PL (2006). The human LINE-1 retrotransposon creates DNA double-strand breaks. J Mol Biol 357, 1383–1393. [DOI] [PMC free article] [PubMed] [Google Scholar]
- Gilbert N, Lutz-Prigge S, and Moran JV (2002). Genomic deletions created upon LINE-1 retrotransposition. Cell 110, 315–325. [DOI] [PubMed] [Google Scholar]
- Gluck S, Guey B, Gulen MF, Wolter K, Kang TW, Schmacke NA, Bridgeman A, Rehwinkel J, Zender L, and Ablasser A (2017). Innate immune sensing of cytosolic chromatin fragments through cGAS promotes senescence. Nat Cell Biol 19, 1061–1070. [DOI] [PMC free article] [PubMed] [Google Scholar]
- Hancks DC, and Kazazian HH Jr. (2012). Active human retrotransposons: variation and disease. Curr Opin Genet Dev 22, 191–203. [DOI] [PMC free article] [PubMed] [Google Scholar]
- Hardies SC, Wang L, Zhou L, Zhao Y, Casavant NC, and Huang S (2000). LINE-1 (L1) lineages in the mouse. Mol Biol Evol 17, 616–628. [DOI] [PubMed] [Google Scholar]
- Hukezalie KR, Thumati NR, Cote HC, and Wong JM (2012). In vitro and ex vivo inhibition of human telomerase by anti-HIV nucleoside reverse transcriptase inhibitors (NRTIs) but not by non-NRTIs. PLoS One 7, e47505. [DOI] [PMC free article] [PubMed] [Google Scholar]
- Iskow RC, McCabe MT, Mills RE, Torene S, Pittard WS, Neuwald AF, Van Meir EG, Vertino PM, and Devine SE (2010). Natural mutagenesis of human genomes by endogenous retrotransposons. Cell 141, 1253–1261. [DOI] [PMC free article] [PubMed] [Google Scholar]
- Jones RB, Garrison KE, Wong JC, Duan EH, Nixon DF, and Ostrowski MA (2008). Nucleoside analogue reverse transcriptase inhibitors differentially inhibit human LINE-1 retrotransposition. PloS one 3, e1547. [DOI] [PMC free article] [PubMed] [Google Scholar]
- Kanfi Y, Naiman S, Amir G, Peshti V, Zinman G, Nahum L, Bar-Joseph Z, and Cohen HY (2012). The sirtuin SIRT6 regulates lifespan in male mice. Nature 483, 218–221. [DOI] [PubMed] [Google Scholar]
- Kines KJ, Sokolowski M, deHaro DL, Christian CM, and Belancio VP (2014). Potential for genomic instability associated with retrotranspositionally-incompetent L1 loci. Nucleic Acids Res 42, 10488–10502. [DOI] [PMC free article] [PubMed] [Google Scholar]
- Lander ES, Consortium IHGS, Linton LM, Birren B, Nusbaum C, Zody MC, Baldwin J, Devon K, Dewar K, Doyle M, et al. (2001). Initial sequencing and analysis of the human genome. Nature 409, 860–921. [DOI] [PubMed] [Google Scholar]
- Lee E, Iskow R, Yang L, Gokcumen O, Haseley P, Luquette LJ 3rd, Lohr JG, Harris CC, Ding L, Wilson RK, et al. (2012). Landscape of somatic retrotransposition in human cancers. Science 337, 967–971. [DOI] [PMC free article] [PubMed] [Google Scholar]
- Leeansyah E, Cameron PU, Solomon A, Tennakoon S, Velayudham P, Gouillou M, Spelman T, Hearps A, Fairley C, Smit de V, et al. (2013). Inhibition of telomerase activity by human immunodeficiency virus (HIV) nucleos(t)ide reverse transcriptase inhibitors: a potential factor contributing to HIV-associated accelerated aging. J Infect Dis 207, 1157–1165. [DOI] [PubMed] [Google Scholar]
- Levin HL, and Moran JV (2011). Dynamic interactions between transposable elements and their hosts. Nature reviews 12, 615–627. [DOI] [PMC free article] [PubMed] [Google Scholar]
- Li T, and Chen ZJ (2018). The cGAS-cGAMP-STING pathway connects DNA damage to inflammation, senescence, and cancer. J Exp Med [DOI] [PMC free article] [PubMed]
- Lopez-Otin C, Blasco MA, Partridge L, Serrano M, and Kroemer G (2013). The hallmarks of aging. Cell 153, 1194–1217. [DOI] [PMC free article] [PubMed] [Google Scholar]
- Mao Z, Hine C, Tian X, Van Meter M, Au M, Vaidya A, Seluanov A, and Gorbunova V (2011). SIRT6 promotes DNA repair under stress by activating PARP1. Science 332, 1443–1446. [DOI] [PMC free article] [PubMed] [Google Scholar]
- Mao Z, Tian X, Van Meter M, Ke Z, Gorbunova V, and Seluanov A (2012). Sirtuin 6 (SIRT6) rescues the decline of homologous recombination repair during replicative senescence. Proc Natl Acad Sci U S A 109, 11800–11805. [DOI] [PMC free article] [PubMed] [Google Scholar]
- McNab F, Mayer-Barber K, Sher A, Wack A, and O’Garra A (2015). Type I interferons in infectious disease. Nat Rev Immunol 15, 87–103. [DOI] [PMC free article] [PubMed] [Google Scholar]
- Meer MV, Podolskiy DI, Tyshkovskiy A, and Gladyshev VN (2018). A whole lifespan mouse multi-tissue DNA methylation clock. eLife 7. [DOI] [PMC free article] [PubMed] [Google Scholar]
- Montessori V, Harris M, and Montaner JS (2003). Hepatotoxicity of nucleoside reverse transcriptase inhibitors. Semin Liver Dis 23, 167–172. [DOI] [PubMed] [Google Scholar]
- Mostoslavsky R, Chua KF, Lombard DB, Pang WW, Fischer MR, Gellon L, Liu P, Mostoslavsky G, Franco S, Murphy MM, et al. (2006). Genomic instability and aging-like phenotype in the absence of mammalian SIRT6. Cell 124, 315–329. [DOI] [PubMed] [Google Scholar]
- Mouse Genome Sequencing C., Waterston RH, Lindblad-Toh K, Birney E, Rogers J, Abril JF, Agarwal P, Agarwala R, Ainscough R, Alexandersson M, et al. (2002). Initial sequencing and comparative analysis of the mouse genome. Nature 420, 520–562. [DOI] [PubMed] [Google Scholar]
- Nagai K, Matsushita T, Matsuzaki T, Takayama K, Matsumoto T, Kuroda R, and Kurosaka M (2015). Depletion of SIRT6 causes cellular senescence, DNA damage, and telomere dysfunction in human chondrocytes. Osteoarthritis Cartilage 23, 1412–1420. [DOI] [PubMed] [Google Scholar]
- Oberdoerffer P, Michan S, McVay M, Mostoslavsky R, Vann J, Park SK, Hartlerode A, Stegmuller J, Hafner A, Loerch P, et al. (2008). SIRT1 redistribution on chromatin promotes genomic stability but alters gene expression during aging. Cell 135, 907–918. [DOI] [PMC free article] [PubMed] [Google Scholar]
- Ostertag EM, Prak ET, DeBerardinis RJ, Moran JV, and Kazazian HH Jr. (2000). Determination of L1 retrotransposition kinetics in cultured cells. Nucleic Acids Res 28, 1418–1423. [DOI] [PMC free article] [PubMed] [Google Scholar]
- Painter GR, Almond MR, Mao S, and Liotta DC (2004). Biochemical and mechanistic basis for the activity of nucleoside analogue inhibitors of HIV reverse transcriptase. Curr Top Med Chem 4, 1035–1044. [DOI] [PubMed] [Google Scholar]
- Petkovich DA, Podolskiy DI, Lobanov AV, Lee SG, Miller RA, and Gladyshev VN (2017). Using DNA Methylation Profiling to Evaluate Biological Age and Longevity Interventions. Cell Metab 25, 954–960 e956. [DOI] [PMC free article] [PubMed] [Google Scholar]
- Reilly MT, Faulkner GJ, Dubnau J, Ponomarev I, and Gage FH (2013). The role of transposable elements in health and diseases of the central nervous system. The Journal of neuroscience : the official journal of the Society for Neuroscience 33, 17577–17586. [DOI] [PMC free article] [PubMed] [Google Scholar]
- Richardson SR, Doucet AJ, Kopera HC, Moldovan JB, Garcia-Perez JL, and Moran JV (2015). The Influence of LINE-1 and SINE Retrotransposons on Mammalian Genomes. Microbiol Spectr 3, MDNA3–0061-2014. [DOI] [PMC free article] [PubMed] [Google Scholar]
- Shen YJ, Le Bert N, Chitre AA, Koo CX, Nga XH, Ho SS, Khatoo M, Tan NY, Ishii KJ, and Gasser S (2015). Genome-derived cytosolic DNA mediates type I interferon-dependent rejection of B cell lymphoma cells. Cell reports 11, 460–473. [DOI] [PubMed] [Google Scholar]
- Sookdeo A, Hepp CM, McClure MA, and Boissinot S (2013). Revisiting the evolution of mouse LINE-1 in the genomic era. Mob DNA 4, 3. [DOI] [PMC free article] [PubMed] [Google Scholar]
- St Laurent G 3rd, Hammell N, and McCaffrey TA (2010). A LINE-1 component to human aging: do LINE elements exact a longevity cost for evolutionary advantage? Mech Ageing Dev 131, 299–305. [DOI] [PMC free article] [PubMed] [Google Scholar]
- Stetson DB, Ko JS, Heidmann T, and Medzhitov R (2008). Trex1 prevents cell-intrinsic initiation of autoimmunity. Cell 134, 587–598. [DOI] [PMC free article] [PubMed] [Google Scholar]
- Takahashi A, Loo TM, Okada R, Kamachi F, Watanabe Y, Wakita M, Watanabe S, Kawamoto S, Miyata K, Barber GN, et al. (2018). Downregulation of cytoplasmic DNases is implicated in cytoplasmic DNA accumulation and SASP in senescent cells. Nat Commun 9, 1249. [DOI] [PMC free article] [PubMed] [Google Scholar]
- Thomas CA, Tejwani L, Trujillo CA, Negraes PD, Herai RH, Mesci P, Macia A, Crow YJ, and Muotri AR (2017). Modeling of TREX1-Dependent Autoimmune Disease using Human Stem Cells Highlights L1 Accumulation as a Source of Neuroinflammation. Cell stem cell 21, 319–331 e318. [DOI] [PMC free article] [PubMed] [Google Scholar]
- Van Meter M, Kashyap M, Rezazadeh S, Geneva AJ, Morello TD, Seluanov A, and Gorbunova V (2014). SIRT6 represses LINE1 retrotransposons by ribosylating KAP1 but this repression fails with stress and age. Nat Commun 5, 5011. [DOI] [PMC free article] [PubMed] [Google Scholar]
- Villeponteau B (1997). The heterochromatin loss model of aging. Exp Gerontol 32, 383–394. [DOI] [PubMed] [Google Scholar]
- Volkman HE, and Stetson DB (2014). The enemy within: endogenous retroelements and autoimmune disease. Nat Immunol 15, 415–422. [DOI] [PMC free article] [PubMed] [Google Scholar]
- Wu PY, Cheng CY, Liu CE, Lee YC, Yang CJ, Tsai MS, Cheng SH, Lin SP, Lin DY, Wang NC, et al. (2017). Multicenter study of skin rashes and hepatotoxicity in antiretroviral-naive HIV-positive patients receiving non-nucleoside reverse-transcriptase inhibitor plus nucleoside reverse-transcriptase inhibitors in Taiwan. PLoS One 12, e0171596. [DOI] [PMC free article] [PubMed] [Google Scholar]
- Xiao C, Kim HS, Lahusen T, Wang RH, Xu X, Gavrilova O, Jou W, Gius D, and Deng CX (2010). SIRT6 deficiency results in severe hypoglycemia by enhancing both basal and insulin-stimulated glucose uptake in mice. J Biol Chem 285, 36776–36784. [DOI] [PMC free article] [PubMed] [Google Scholar]
- Yang H, Wang H, Ren J, Chen Q, and Chen ZJ (2017). cGAS is essential for cellular senescence. Proc Natl Acad Sci U S A 114, E4612–E4620. [DOI] [PMC free article] [PubMed] [Google Scholar]
- Zhong L, D’Urso A, Toiber D, Sebastian C, Henry RE, Vadysirisack DD, Guimaraes A, Marinelli B, Wikstrom JD, Nir T, et al. (2010). The histone deacetylase Sirt6 regulates glucose homeostasis via Hif1alpha. Cell 140, 280–293. [DOI] [PMC free article] [PubMed] [Google Scholar]
Associated Data
This section collects any data citations, data availability statements, or supplementary materials included in this article.
Supplementary Materials
WT mice (27 days old) perform in open field and foraging activity test.
SIRT6 KO mice (27 days old) perform in open field and foraging activity test.
SIRT6 KO mice (27 days old) treated with 3TC perform in open field and foraging activity test.
SIRT6 KO mice (27 days old) treated with d4T perform in open field and foraging activity test.