

Abstract
Background
Annexin 1 (ANXA1) expression is associated with the malignant tumor phenotype, making it an attractive therapeutic target. However, little is known about the regulation of ANXA1 in non‐small cell lung cancer (NSCLC).
Methods
We investigated the biological roles of ANXA1 in tumor growth, migration, and invasion, and explored the possibility of ANXA1 as a potential therapeutic target for the treatment of NSCLC.
Results
Our findings revealed that ANXA1 enhanced nuclear factor (NF)‐κB activation in NSCLC cells by interaction with inhibitor of NF‐κB kinase complex subunit, IKKγ. We also found that NF‐κB could negatively regulate microRNA (miR)‐26a, and miR‐26a was regulated through the ANXA1–NF‐κB regulatory pathway. NF‐κB activation negatively regulated by miR‐26a was confirmed in NSCLC.
Conclusion
Together, these results provide evidence of the mechanisms of the ANXA1–NF‐κB–miR‐26a regulatory pathway in the invasion and migration in NSCLC.
Keywords: Annexin 1, microRNA‐26a, nuclear factor‐κB pathway, non‐small cell lung carcinoma
Introduction
Lung cancers account for >1.3 million deaths per year, making it one of the leading causes of cancer‐related deaths worldwide.1, 2, 3 Primary lung carcinomas have been classified into small cell lung cancer (SCLC) and non‐small cell lung carcinoma (NSCLC), which includes adenocarcinoma (50–70%), squamous cell carcinoma (20–30%), and other less common subtypes (<5%).4, 5 Despite advancements in early detection and targeted therapies, the 5‐year survival rate is <5%.6 The main factors are tumor invasion and metastasis. Thus, a better understanding of molecular mechanisms leading to metastasis of NSCLC cells is of utmost importance.
Annexin 1 (ANXA1) belongs to the annexin superfamily of calcium‐ and phospholipid‐binding proteins, and has been detected in miscellaneous organisms, including vertebrates, invertebrates, and plants.7, 8 Functionally, ANXA1 has been reported to be involved in intracellular signaling, cell growth, and cell differentiation.9, 10 The expression of ANXA1 has been reported to be reduced or increased in many types of cancer. We and others have recently reported that the expression of ANXA1 is upregulated in lung cancer.11, 12, 13 Of importance, ANXA1 has been shown to activate nuclear factor (NF)‐κB in T cells, and T cells from ANXA1‐deficient mice showed decreased NF‐κB activation, indicating that ANXA1 may somehow regulate NF‐κB.14 In breast cancer, co‐immunoprecipitation confirmed that ANXA1 can bind to inhibitor of NF‐κB kinase (IKK)γ or NEMO, which may be important for the activation of NF‐κB to promote metastasis capability.15 Interestingly, ANXA1 enhanced cells proliferation, invasion, and migration ability in NSCLC.11 However, the mechanism behind this regulation remains obscure.
MicroRNAs (miRNAs) are small and non‐coding endogenous and conserved single‐strand RNA molecules of 21–26 nucleotides, which regulate gene expression at the post‐transcriptional level, by base‐pairing with complementary sequences primarily in the 3′‐untranslated regions of protein coding transcripts.16, 17 miR‐26a has been widely studied in diverse cancer. We and others showed that miR‐26a expression downregulated in lung cancer.18, 19, 20 In addition, NF‐κB (p65) suppressed miR‐26a production by directly binding to a predicted NF‐κB binding element in the promoter region of miR‐26a in chondrocytes.21 NF‐κB (p65) inhibited miR‐26a production in cardiac fibrosis cells.22 However, the regulation of miR‐26 and NF‐κB has not been studied in NSCLC.
Current knowledge of the molecular mechanisms of the metastasis in NSCLC is limited. In the present study, our hypothesis suggested that regulation of miR‐26a was through the ANXA1–NF‐κB regulatory pathway in the metastasis of NSCLC.
Methods
Ethics statement
The present study was approved by the institutional review board of Guangzhou Medical University (Guangzhou, China). All patients provided written informed consent.
Tissue collection
Lung tumor tissue samples were harvested from 10 patients (aged 64.9 ± 6.8 years; men, n = 8; women, n = 2) at the Cancer Center of Guangzhou Medical University on 15 July 2014 during surgery. Matched healthy paracarcinoma tissue samples were also harvested from normal lung tissue.
Cell culture
Human NSCLC cell line (A549) was purchased from American Type Culture Collection (Manassas, VA, USA), A549 was maintained in RPMI‐1640 medium supplemented with 10% heat‐inactivated fetal bovine serum (FBS), 100 U/mL penicillin, and 100 mg/mL streptomycin in a humidified atmosphere containing 5% CO2 at 37°C.
Lentiviral infection
The lentivirus vector, LV‐ANXA1, was purchased from Shanghai Genechem Co. Ltd. (Shanghai, China). The A549‐shANXA1#1 was infected with recombinant lentivirus as described previously. Briefly, a day before infection, A549‐shANXA1#1 (in the logarithmic phase of growth) was seeded into a 24‐well plate at a density of 2 × 10⁴ cells/well. After 12 hours, the culture medium was replaced with 1 mL enhanced infection solution, next, cells were infected with 1 × 10⁸ recombinant lentivirus transduction units in the presence of 10 μg/mL polybrene (Genechem). Next, either empty lentivirus or LV‐ANXA1 lentivirus was added to the well ([MOI] for empty lentivirus = 20; [MOI] for LV‐ANXA1 lentivirus = 20) and cultured with 2 μg/mL puromycin (Sigma, St. Louis, MO, USA) for at least 72 hours to select stably transfected cells for later use.
Quantitative real‐time reverse transcription polymerase chain reaction analysis
Total RNAs were extracted from the cell or tissues using TRIzol reagents (Invitrogen, Carlsbad, CA, USA) following the manufacturer’s instructions. First‐strand cDNA was synthesized by reverse transcription of 500 ng of total RNA according to the manufacturers protocol (PrimeScript® 1st Strand cDNA Synthesis Kit; Takara, Tokyo, Japan) at 37°C for 15 minutes, 85°C for 5 seconds, and 4°C for 10 minutes. Quantitative polymerase chain reaction (PCR) was synthesized according to the manufacturer’s protocol (SYBR® Premix Ex Taq™ II [Tli RNaseH Plus]; Takara) at 95°C for 30 seconds, 95°C for 5 seconds, 60°C for 34 seconds, 95°C for 15 seconds, 60°C for 1 minute, and 95°C for 15 seconds, for 40 cycles. Glyceraldehyde 3‐phosphate dehydrogenase was amplified as an internal control. Data were analyzed using the comparative quantification cycle method (2‐ΔΔCt). Three separate experiments were performed.
Western blot analysis
Cells from each group were harvested and proteins were extracted using lysis buffer containing 50 mM Tris–HCl, pH 7.5, 150 mM NaCl, 1% Nonidet P‐40, 0.5% deoxycholic acid, 0.1% sodium dodecyl sulfate, 1 mM phenyl methyl sulfonyl fluoride, and 100 μg/mL leupeptin. Lysates were centrifuged, and supernatants were collected, subjected to electrophoresis on a 10% sodium dodecyl sulfate polyacrylamide gel, and transferred to a nitrocellulose membrane. The membranes was blocked in 5% non‐fat dry milk for 60 minutes, reacted with primary antibodies at 4°C overnight, and then incubated with horseradish peroxidase‐conjugated secondary antibodies at room temperature for 1 hour. Immunoreactivity was detected by the western blot chemiluminescence reagent system (Millipore, Darmstadt, Germany). According to conventional practices, the level of β‐actin was also measured at the same time as an internal control. Data were measured using ImageJ software (National Institutes of Health, Bethesda, MD, USA).
Cell proliferation assay
Cells were seeded into 96‐well plates at a density of 2 × 10³ cells/well. Cell viability was assessed using the Cell Counting Kit‐8 assay (Beyotime Institute of Biotechnology, Shanghai, China). Briefly, cells were seeded into 96‐well plates (2.0 × 10³ cells per well) and incubated in RPMI‐1640 supplemented with 10% FBS for 5 days. Cell Counting Kit‐8 reagent (10 uL, 1 mg/mL) was added and incubated for 3 hours at 37°C. The absorbance of each well was measured using a spectrophotometer at 450 nm. Three independent experiments were performed.
Wound healing assay
Transduced cells were incubated until they had reached 90–100% confluence. The cells were scratched using a P‐10 pipette tip, and were then incubated for various durations. Phase contrast images were captured at 0 and 24 hours using a Nikon microscopy system (Nikon Eclipse Ti‐s; Nikon Corporation, Tokyo, Japan). The wound healing distance was measured using ImageJ software. All assays were conducted in triplicate, and the mean values were calculated.
Migration and invasion assays
Cell migration assay: 2 × 10⁵ cells were resuspended in 200 μL serum‐free RPMI‐1640 medium and seeded into the upper chamber of each insert. Then, 500 μL medium containing 5% FBS was added to the lower chamber as a chemoattractant. Following incubation at 37°C for 24 hours, the cells on the upper membrane were carefully removed. The cells that migrated were fixed and stained for 30 minutes in a 0.1% crystal violet solution in phosphate‐buffered saline. The membranes were manually counted at ×200 magnification from 10 fields per filter using a Nikon microscope (Nikon Eclipse Ti‐s; Nikon Corporation). All experiments were independently repeated at least three times.
Cell invasion assay: chambers were uniformly covered with 30 μL Matrigel diluted with serum‐free RPMI‐1640 to a certain percentage and incubated at 37°C for 2~4 hours. Then, 1 × 10⁶ cells were resuspended in 200 μL serum‐free RPMI‐1640 medium and seeded into the upper chamber, and 500 μL medium containing 10% FBS was added to the lower chamber. After incubation at 37°C for 24 hours, the cells were fixed and stained. The membrane was manually counted at ×200 magnification from 10 fields per filter using a Nikon microscope (Nikon Eclipse Ti‐s; Nikon Corporation). All experiments were independently repeated at least three times.
Xenograft model
Female Balb/c nude, aged 4~6 weeks, weighing 18~22 g were housed in a specific pathogen‐free room. All experimental animals were purchased from the Guangdong Medical Laboratory Animal Center. In our study, the models of xenografts of A549‐shANXA1#1 and A549‐shANXA1#1+LV‐ANXA1 were established as follows: the A549‐shANXA1#1 and A549‐shANXA1#1+LV‐ANXA1 cell lines were collected and resuspended in phosphate‐buffered saline. Mice received a subcutaneous injection of the cells under the armpit (1 × 10⁷ cells in 200 μL). After subcutaneous implantation of the cells, the animals’ weight was measured every two days. We monitored tumor growth starting on the first day of treatment and measured the volume of the xenograft every two days.
The tumor volume (V) was calculated using the formula V = p a × b2 / 6, where a and b are the longest and shortest diameters, respectively. Experiments were approved by the Laboratory Animal Ethics Committee Guangzhou University of Chinese Medicine, China.
Statistical analysis
All assays were carried out in triplicate, and the mean values were calculated. Data are presented as the mean ± standard deviation. All statistical analyses were performed using SPSS 17.0 (SPSS, Inc., Chicago, IL, USA). Unpaired sets of data were compared using unpaired Student’s t‐test (two‐tailed). P < 0.05 was considered to indicate a statistically significant difference.
Results
ANXA1 promotes the migration and invasion of NSCLC cells
In our previous studies, we reported that knockdown of ANXA1 suppresses the migration and invasion of NSCLC.11 To further verify whether ANXA1 is a crucial mediator of lung cancer, we established A549 cell line stably overexpressing ANXA1. We then analyzed ANXA1/A549 cells and the control cells through cell morphological observation. The effects of ANXA1 on cell migration and proliferation abilities were assessed by wound healing (Fig 1a), Transwell chamber (Fig 1b), and Cell Counting Kit‐8 (Fig 1c; *P < 0.05, # P < 0.01) assays, respectively. The results of statistical analysis are shown in Figure 1d and e (*P < 0.05). There was no significant difference between the A549‐shRNA1#1‐con group and A549‐shRNA1#1 group in the experiment of cell proliferation, migration, and invasion (*P > 0.05).
Figure 1.
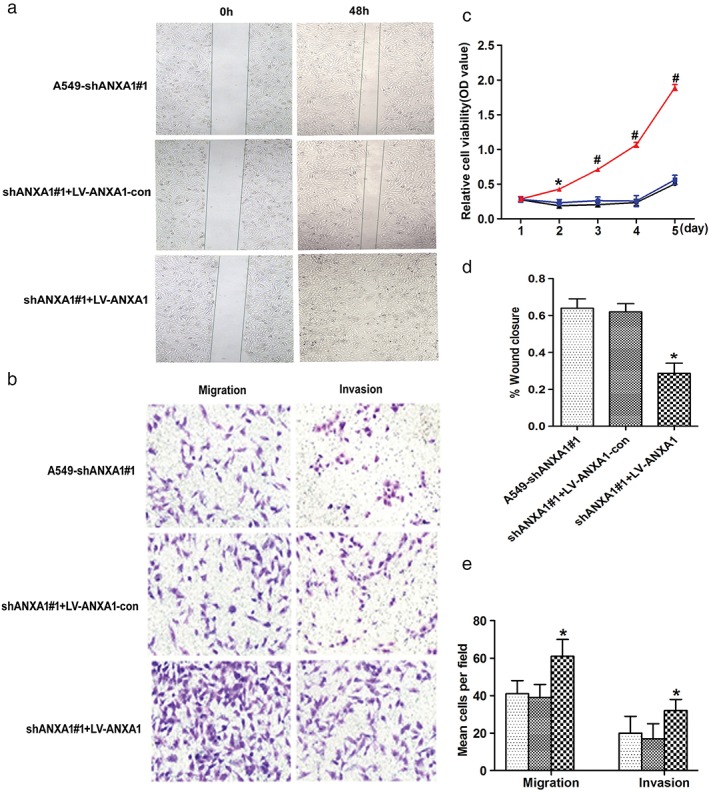
Annexin 1 (ANXA1) enhanced cell proliferation, migration, and invasion in the ANXA1‐overexpressed cells. (a) Cell migration was determined using a wound healing assay (magnification: ×4). (b) In Matrigel invasion and Transwell migration assay, LV‐ANXA1 infected A549 cells versus negative control infected cells in a ×200 light scope after crystal violet staining. (c) Cell proliferation was detected by Cell Counting Kit‐8 assay ( ) A549‐shANXA1#1, (
 ) shANXA1#1+LV‐ANXA1‐con, and (
 ) shANXA1#1+LV‐ANXA1. (d) Quantification of wound area changes 0 and 48 hours after scratch damage in the ANXA1‐overexpressed cells. (e) Cells were counted in a light scope in four random views. Data are presented as the mean ± standard deviation for triplicate determinations. *P < 0.05, #P < 0.01, compared with the control and untreated groups. (
 ) A549‐shANXA1#1, (
 ) shANXA1#1+LV‐ANXA1‐con, and (
 ) shANXA1#1+LV‐ANXA1.
Based on our findings, overexpression of ANXA1 significantly promoted cell proliferation and migration capability in vitro.
Prognostic significance of ANXA1 expression
In vivo metastasis assays in the nude mice xenograft model were subsequently applied to evaluate the effect of ANXA1 on tumorigenicity (Fig 2a). Statistical analysis results of the mean tumor volume (cm3) and tumor weight demonstrated that ANXA1 promoted tumor growth compared with the control groups (Fig 2b,c; *P < 0.05). These findings may indicate that downregulation of ANXA1 inhibits cell invasion and migration in vivo. ANXA1 overexpression was correlated with a more aggressive clinical course and a significantly shorter DSS in mice with xenograft (Fig 2d; P = 0.0014).
Figure 2.
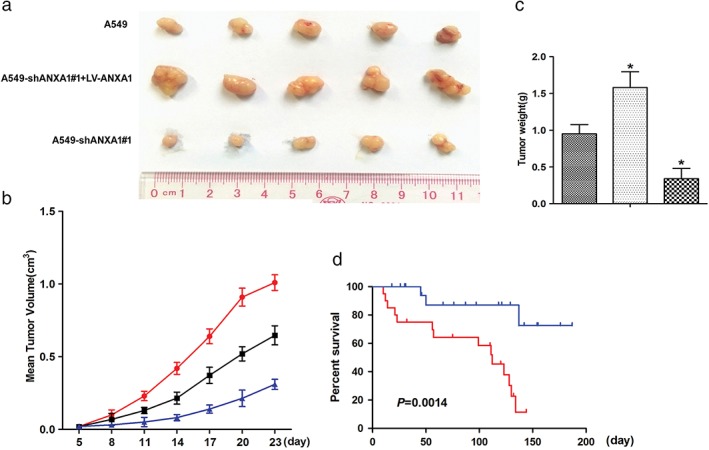
Xenograft tumor growth was increased in the annexin 1 (ANXA1) overexpression mice. (a) Mean of tumor volume for each group (n = 6) after implantation. Each point on the line graph represents the mean tumor volume (mm3) at a particular day after implantation, and each bar represents SD. (b) The average weight of tumors from each experimental group is presented. Data represents the values from sex mice with ±SD ( ) A549, (
 ) A549‐shANXA1#1+LV‐ANXA1, and (
 ) A549‐shANXA1#1. (c) A representative picture of the tumor sizes from different groups was shown on the 21st day after implantation. *P < 0.05 versus the control group. (
 ) A549, (
 ) A549‐shANXA1#1+LV‐ANXA1, and (
 ) A549‐shANXA1#1. (d) By using the log–rank test, the ANXA1 overexpression is aq univariately predictive factor of inferior disease‐specific survival. (
 ) A549‐shANXA1#1+LV‐ANXA1, and (
 ) A549‐shANXA1#1.
NF‐κB negatively regulates miR‐26a in NSCLC
Previous investigation highlighted that NF‐κB (p65) suppressed miR‐26a production by directly binding to a predicted NF‐κB binding element in the promoter region of miR‐26a in chondrocytes.21 It was also been found that NF‐κB (p65) could inhibit miR‐26a production in cardiac fibrosis cell.22 However, the regulation relationship of miR‐26a and NF‐κB signal pathway was still unknown. To validate the effect on the NF‐κB signal pathway, SN50 as an inhibitor was used to inhibit NF‐κB activity, we examined the phosphorylation p65 levels in the nuclear fractions, and LaminB1 was used as the housekeeping protein. The western blot bands showed that the levels of p65 phosphorylation were significantly decreased in the A549 cells (SN50 = 80 uM; Fig 3a), Quantitative reverse transcription PCR (qRT–PCR) results showed that miR‐26a was markedly increased in A549 cells (Fig 3b).
Figure 3.
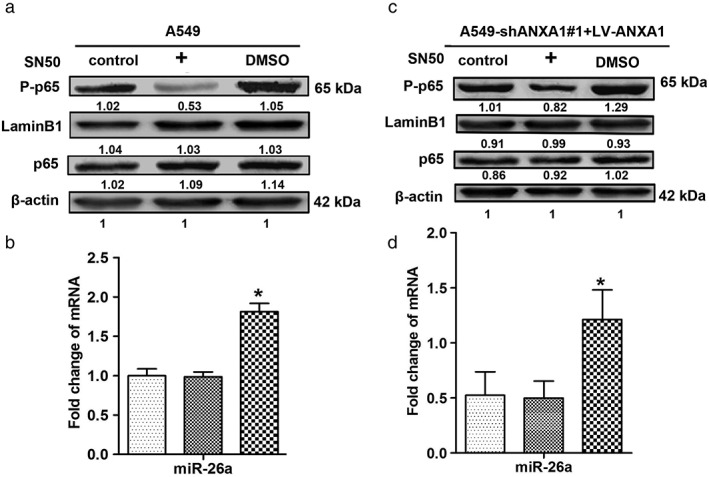
p65 regulates the expression of microRNA (miR)‐26a in non‐small cell lung cancer. (a) Twenty‐four hours after SN50 treatment, the total protein of each group was extracted, and western blots were performed with antibodies against p65 and phospho‐p65 in A549 cells. (b) The expression levels of miR‐26a in the A549 after SN50 treatment. ( ) A549, (
 ) DMSO, and (
 ) SN50. (c) Twenty‐four hours after SN50 treatment, western blots were performed with antibodies against p65 and phospho‐p65 in the ANXA1‐overexpressed cells. (d) The expression levels of miR‐26a in the ANXA1‐overexpressed cells after SN50 treatment. Data are presented as the mean ± standard deviation for triplicate determinations. *P < 0.05 versus control groups. (
 ) A549‐shANXA1#1+LV‐ANXA1, (
 ) DMSO, and (
 ) SN50
To further verify whether NF‐κB negatively regulates miR‐26a, we quantified the p65 phosphorylation level, which was significantly decreased in ANXA1‐overexpressed cells (SN50 = 100 uM; Fig 3c), and qRT–PCR results showed that miR‐26a was obviously increased in ANXA1‐overexpressed cells (Fig 3d). Our findings suggested that NF‐κB could negatively regulate miR‐26a in NSCLC.
ANXA1 positive regulates NF‐κB activation in NSCLC
A Previous study of co‐immunoprecipitation results confirmed that ANXA1 could bind IKKγ or NEMO, which might be important for NF‐κB activation and promote metastasis capability in breast cancer.15 We further investigated the possibility of ANXA1 positively regulating NF‐κB activation in NSCLC. Western blot analysis demonstrated that the levels of IKKα/β/γ, nuclear factor of kappa light chain gene enhancer in B cells (IKB)α, and p65 phosphorylation markedly dropped in the silence of ANXA1 cells, notably, the levels of IKKα/β/γ, IKBα, and p65 phosphorylation were increased in ANXA1‐overexpressed cells. However, the levels of IKKα/β phosphorylation showed no significant changes in the cytoplasm (Fig 4a). Taken together, these results reveal a critical role for ANXA1 in the constitutive activation of NF‐κB in NSCLC cells through interaction with IKKγ activity.
Figure 4.
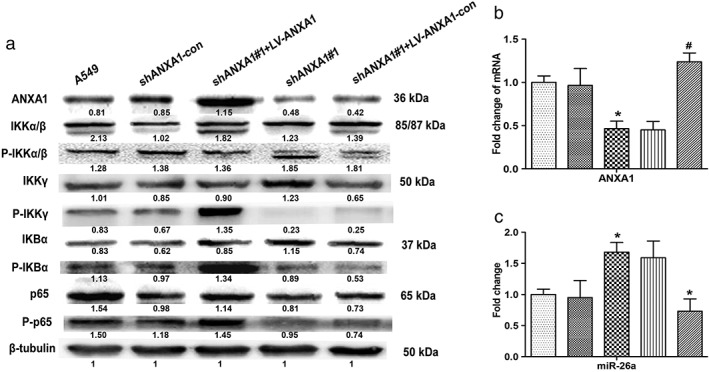
Phosphorylation expression levels of inhibitor of nuclear factor‐κB kinase α/β subunits (IKKα/β), inhibitor of nuclear factor‐κB kinase κ subunit (IKKγ), nuclear factor‐κB inhibitor‐α (IKBα), and p65 in the knockdown and overexpression annexin 1 (ANXA1) cells. (a) Total and phosphorylated protein expression levels of IKKα/β, IKKγ, IKBα, and p65 were examined through western blots with specific antibodies. (b) Quantitative polymerase chain reaction analysis indicated that the mRNA expression levels of ANXA1 in the knockdown and overexpression ANXA1 cells ( ) A549, (
 ) shANXA1‐con, (
 ) shANXA1#1, (
 ) shANXA1#1+LV‐ANXA1‐con, and (
 ) shANXA1#1+LV‐ANXA1. (c) Expression levels of microRNA (miR)‐26a in the knockdown and ANXA1‐overexpressed cells. *P < 0.05, #P < 0.01, compared with control and untreated groups. (
 ) A549, (
 ) shANXA1‐con, (
 ) shANXA1#1, (
 ) shANXA1#1+LV‐ANXA1‐con, and (
 ) shANXA1#1+LV‐ANXA1.
ANXA1 negatively regulates miR‐26a in NSCLC
Data presented from our previous work showed that the expression of ANXA1 was significantly upregulated in eight matched cancer tissues and five NSCLC cell lines, compared with the normal tissues and cell lines.11 ANXA1 was detected at a higher expression level in the A549 cells than in human bronchial epithelial cells (16HBE). In order to explore the regulation relationship between ANXA1 and miR‐26a in NSCLC, we constructed the LV‐ANXA1‐RNAi transfected A549 cells and LV‐ANXA1 transfected A549‐shANXA1#1 cells. Then, the stable knockdown and overexpression of ANXA1 cell lines were established (Fig 4b). The miR‐26a expression levels were further measured by qRT–PCR to investigate the regulation of ANXA1 and miR‐26a. As expected, the expression of miR‐26a was decreased in LV‐ANXA1 cells, whereas miR‐26a was increased in LV‐ANXA1‐RNAi cells. Collectively, these data suggested that ANXA1 negatively regulated miR‐26a; however, the molecular mechanisms are still unclear (Fig 4c).
ANXA1–NF‐κB–miR‐26a regulatory pathway in NSCLC
To further address the mechanism of miR‐26a as a tumor suppressor activity in NSCLC, NF‐κB was considered to have an important role that connected ANXA1 and miR‐26a in NSCLC. In our present study, higher levels of p65 mRNA and protein were detected in NSCLC cell lines and lung cancer patient tumor samples compared with normal adjacent tissues (Fig S1). These results strongly coincided with lower levels of miR‐26a, implying that tumor suppressor activity of miR‐26a was associated with ANXA1. To directly support this notion, we performed western blot to show the expression of IKKγ, IKBα, and p65 phosphorylation, which were obviously declined in the A549 cells with IKK‐16 (70 nM) inhibitor treatment (Fig 5a). The result of quantitative PCR analysis demonstrated that miR‐26a was significantly increased (Fig. 5b). Similar results were obtained at the levels of IKKγ, IKBα, and p65 phosphorylation, which were downregulated in ANXA1‐overexpressed cells with IKK‐16 (100 nM) inhibitor treatment (Fig 5c), miR‐26a was found to be elevated (Fig 5d) under this condition. Collectively, these data demonstrated that miR‐26a was regulated through the ANXA1–NF‐κB regulatory pathway in NSCLC.
Figure 5.
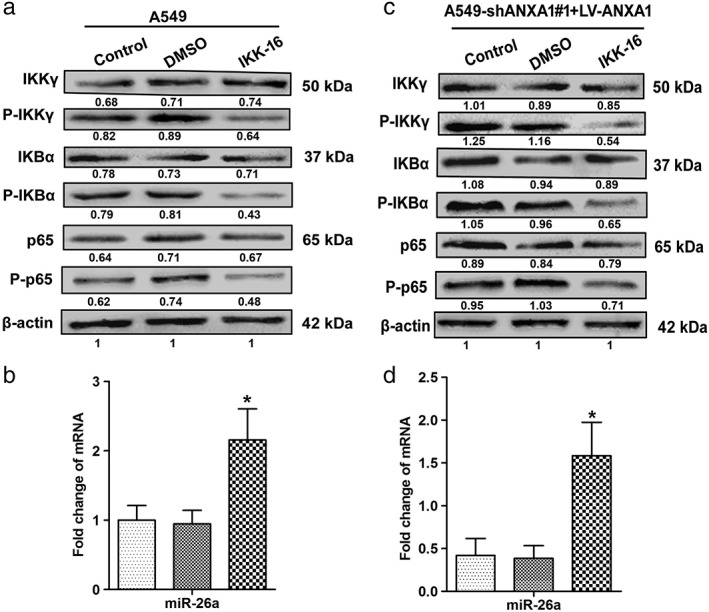
Nuclear factor‐κB kinase κ subunit (IKKγ) regulates the phosphorylation expression levels of the NF‐κB pathway in non‐small cell lung cancer. (a)Western blots were performed with antibodies against IKKγ, phospho‐IKKγ, nuclear factor‐κB inhibitor‐α (IKBα), phospho‐IKBα, p65, and phospho‐p65 in the A549 cells. (b) The expression levels of microRNA (miR)‐26a in the A549 cells ( ) A549, (
 ) DMSO, and (
 ) IKK‐16. (c) The expression levels of total and phosphorylated IKKγ, IKBα, and p65 in the ANXA1‐overexpressed cells. (d) The expression levels of miR‐26a in the ANXA1‐overexpressed cells. *P < 0.05, compared with the control and untreated groups. (
 ) A549‐shANXA1#1+LV‐ANXA1, (
 ) DMSO, and (
 ) IKK‐16.
Next, we focused on the ANXA1–NF‐κB–miR‐26a pathway in the migration and invasion in NSCLC. The IKKγ inhibitor (IKK‐16; 50 nM) and p65 inhibitor (SN50; 60 μM) were added into the knockdown ANXA1 A549 cells (A549‐shANXA1#1), and the results of Transwell chamber assays showed that the migration and invasion capabilities had obviously been suppressed in ANXA1 knockdown cells by using IKK‐16 and SN50 inhibitors (Fig 6a–c; *P < 0.05).
Figure 6.
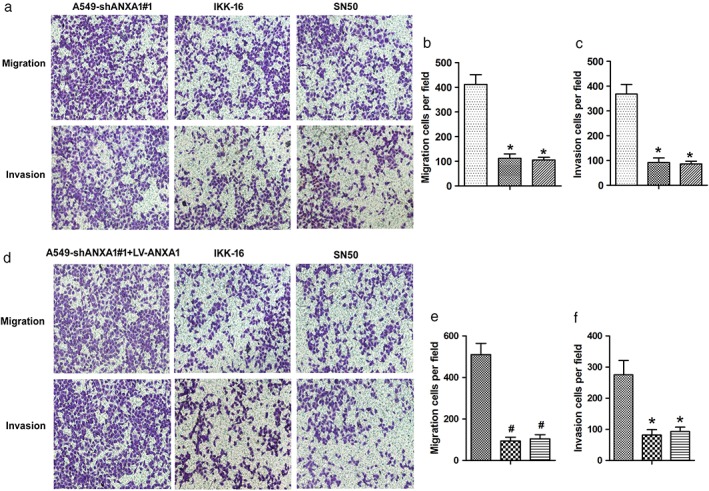
Annexin 1 (ANXA1)–nuclear factor (NF)‐κB–microRNA (miR)‐26a regulatory pathway in the metastasis of non‐small cell lung cancer. (a) Twenty‐four hours after nuclear factor‐κB kinase (IKK)γ, IKK‐16 and SN50 treatment. Transwell chamber assays were used to detect the migration and invasion capability in the knockdown ANXA1 cells. (b,c) The quantitation of the number of the migration and invasion in the ANXA1‐overexpressed cells after using IKK‐16 and SN50. *P < 0.05, #P < 0.01, compared with the control and untreated groups. ( ) A549‐shANXA1#1, (
 ) IKK‐16, and (
 ) SN50. *P < 0.05, #P < 0.01, compared with the control and untreated groups. (d) Twenty‐four hours after IKK‐16 and SN50 treatment. Transwell chamber assays were used to detect the migration and invasion capability in the ANXA1 re‐expressed cells. (e,f) The quantitation of the number of the migration and invasion in the ANXA1‐overexpressed cells after using IKK‐16 and SN50. *P < 0.05, #P < 0.01, compared with the control and untreated groups. (
 ) A549‐shANXA1#1, (
 ) IKK‐16, and (
 ) SN50.
We subsequently investigated the migration and invasion capabilities in overexpressed ANXA1 A549 cells (A549‐shANXA1#1+LV‐ANXA1), and the results demonstrated that the migration and invasion capabilities were also suppressed by using IKK‐16 (100 nM) and SN50 (100 μM) inhibitors (Fig 6d–f; #P < 0.01). Together, these data support that ANXA1–NF‐κB–miR‐26a circuitry is a contributing factor for NSCLC tumorigenesis.
miR‐26a negatively regulates NF‐κB activation in NSCLC
To promote miR‐26a expression, we used miR‐26a mimic to upregulate the miR‐26a level in A549 cells. We next analyzed whether miR‐26a overexpression affected the NF‐κB activation level. As shown in Figure 7, the phosphorylation level of p65 was significantly suppressed compared with the negative control group.
Figure 7.

MicroRNA (miR)‐26a negatively regulates nuclear factor‐κB p65 phosphorylation in non‐small cell lunch cancer. miR‐26a mimic and inhibitor were added into A549 and H460 cells, respectively, then phosphorylation levels of p65 were detected by western blot. These experiments were performed in triplicate.
Furthermore, we used miR‐26a inhibitor to downregulate the miR‐26a level in H460 cells. As we expected, the p65 phosphorylation level was increased compared with the negative control group.
The above results implied that miR‐26a negatively regulated NF‐κB activation in NSCLC. Further systematic studies are required to explore these phenomena, which are currently a focus in our laboratory.
Discussion
This study was undertaken to investigate the potential interplay between ANXA1 and miR‐26a in NSCLC. Our study showed that ANXA1 participates in the regulatory circuitry mechanism with miR‐26a in NSCLC.
Our current study identified the regulation of miR‐26a by the ANXA1–NF‐κB regulatory pathway. Growing evidence has suggested that ANXA1 contributes to the pathological consequence and sequelae of a number of severe human diseases, including cancer.23 ANXA1 has been reported in many types of cancer. The expression of ANXA1 has been found to be upregulated in breast cancer and human hepatocellular carcinoma.23, 24 ANXA1 expression is dysregulated in esophageal squamous cell carcinoma.25 ANXA1 activated the ERK–RhoA–NF‐κB regulation loop in breast cancer cells.26 ANXA1 regulated miR‐26b and miR‐562 by directly targeting NF‐κB to modulate breast cancer metastasis.27 ANXA1, through specific activation of the NF‐κB pathway, regulated the expression of matrix metalloproteinase‐9 and invasion in breast cancer cells.28 ANXA1 associated with NF‐κB and suppressed its transcriptional activity by preventing NF‐κB binding to DNA, which was accompanied by enhanced apoptosis and inhibition of cell growth capability.29 In our study, we found that the expression of ANXA1 was upregulated in lung cancer, and knockdown of ANXA1 suppresses the biological behavior of human NSCLC cells in vitro. 11 Recent reports have shown that ANXA1 can bind to and interact with IKKγ or NEMO to activate the NF‐κB pathway to promote metastasis capability.15 Likewise, we found that ANXA1 expression positively regulated the NF‐κB pathway through interacting with IKKγ in NSCLC.
NF‐κB is a family of dimeric transcription factors central to coordinating inflammatory responses, innate and adaptive immunity, and cellular differentiation, proliferation, and survival in almost all multicellular organisms.30, 31, 32, 33 In mammals, the NF‐κB network consists of five family member protein monomers (p65/RelA, RelB, c‐Rel, p50, and p52) that form homodimers or heterodimers that bind DNA differentially.34, 35, 36, 37 In resting cells, NF‐κB is maintained in an inactive state by cytoplasmic association with IkB proteins.38 In the classical pathway, cell activation leads to signal transduction cascades that result in the phosphorylation and degradation of the IkBs, allowing rapid nuclear translocation of RelA dimmers.39, 40 Our results demonstrated that p65 phosphorylation was inhibited using SN50 inhibitor, and miR‐26a was markedly upregulated in the A549 and overexpression of ANXA1 cell lines. Likely, These results showed that NF‐κB negatively regulates miR‐26a in NSCLC.
Our findings extend previous observations that showed that the levels of IKKγ phosphorylation were distinctly downregulated in the silencing of ANXA1 cells, and the levels of IKKγ phosphorylation were increased in the overexpression of ANXA1 cells. These results showed that ANXA1 constitutive activates NF‐κB pathway cells through interacting with IKKγ in NSCLC.
Our recent studies used IKK‐16 and SN50 inhibitors to study the role of the NF‐κB pathway in A549 and overexpression of ANXA1 cell lines, the expression of IKKγ/IKBα/p65 phosphorylation was decreased in the A549 cell using IKK‐16 inhibitor, miR‐26a was dramatically increased, the level of phosphorylation IKKγ/IKBα/p65 was downregulated in the overexpression of ANXA1 cells using IKK‐16 inhibitor, whereas the miR‐26a expression level was elevated.
Taken together, we showed that ANXA1 inhibits proliferation and metastasis in NSCLC. We also showed that the ANXA1–NF‐κB–miR‐26a pathway promotes the migration and invasion of NSCLC.
Disclosure
No authors report any conflict of interest.
Supporting information
Figure S1. Relative expression levels of total p65 in non‐small cell lung cancer (NSCLC) tissues. (a) Quantitative polymerase chain reaction analysis indicated that the mRNA expression levels of p65 were upregulated in NSCLC tissues. (b) Western blotting indicated that p65 expression was markedly increased in NSCLC tissues. β‐Actin was used as endogenous controls and laminB1 as nuclear endogenous controls. Data are presented as the mean ± standard deviation for triplicate determinations. *P < 0.05 versus normal tissues.
Acknowledgments
We thank Xiaobin Xie and Xiaoliu Qiu for carrying out the animal experiments. This work was funded by the National Nature Science Foundation of China (No. 81401391), China Postdoctoral Science Foundation Grant (No. 2015M570696), and Medical Research Foundation of Guangdong Province (No. B2014188).
References
- 1. Siegel RL, Miller KD, Jemal A. Cancer statistics, 2015. CA Cancer J Clin 2015; 65: 5–29. [DOI] [PubMed] [Google Scholar]
- 2. Chen X, Guan X, Zhang H et al DAL‐1 attenuates epithelial‐to mesenchymal transition in lung cancer. J Exp Clin Cancer Res 2015; 34: 3. [DOI] [PMC free article] [PubMed] [Google Scholar]
- 3. Wang H, Guan X, Tu Y et al MicroRNA‐29b attenuates non‐small cell lung cancer metastasis by targeting matrix metalloproteinase 2 and PTEN. J Exp Clin Cancer Res 2015; 34: 59. [DOI] [PMC free article] [PubMed] [Google Scholar]
- 4. Travis WD, Brambilla E, Burke AP, Marx A, Nicholson AG. Introduction to the 2015 World Health Organization classification of tumors of the lung, pleura, thymus, and heart. J Thorac Oncol 2015; 10: 1240–2. [DOI] [PubMed] [Google Scholar]
- 5. Travis WD, Brambilla E, Nicholson AG et al, WHO Panel. The 2015 World Health Organization classification of lung tumors: Impact of genetic, clinical and radiologic advances since the 2004 classification. J Thorac Oncol 2015; 10: 1243–60. [DOI] [PubMed] [Google Scholar]
- 6. Ni L, Zhu X, Gong C et al Trichosanthes kirilowii fruits inhibit non‐small cell lung cancer cell growth through mitotic cell‐cycle arrest. Am J Chin Med 2015; 43: 349–64. [DOI] [PubMed] [Google Scholar]
- 7. Gerke V, Moss SE. Annexins: From structure to function. Physiol Rev 2002; 82: 331–71. [DOI] [PubMed] [Google Scholar]
- 8. Sobral‐Leite M, Wesseling J, Smit VT et al Annexin A1 expression in a pooled breast cancer series: Association with tumor subtypes and prognosis. BMC Med 2015; 13: 156. [DOI] [PMC free article] [PubMed] [Google Scholar]
- 9. Bist P, Shu S, Lee H et al Annexin‐A1 regulates TLR‐mediated IFN‐beta production through an interaction with TANK‐binding kinase 1. J Immunol 2013; 191: 4375–82. [DOI] [PubMed] [Google Scholar]
- 10. Biaoxue R, Xiling J, Shuanying Y et al Upregulation of Hsp90‐beta and annexin A1 correlates with poor survival and lymphatic metastasis in lung cancer patients. J Exp Clin Cancer Res 2012; 31: 70. [DOI] [PMC free article] [PubMed] [Google Scholar]
- 11. Fang Y, Guan X, Cai T et al Knockdown of ANXA1 suppresses the biological behavior of human NSCLC cells in vitro. Mol Med Rep 2016; 13: 3858–66. [DOI] [PMC free article] [PubMed] [Google Scholar]
- 12. Wang W, Guan S, Sun S et al Detection of circulating antibodies to linear peptide antigens derived from ANXA1 and DDX53 in lung cancer. Tumour Biol 2014; 35: 4901–5. [DOI] [PubMed] [Google Scholar]
- 13. Xu QY, Gao Y, Liu Y, Yang WZ, Xu XY. Identification of differential gene expression profiles of radioresistant lung cancer cell line established by fractionated ionizing radiation in vitro. Chin Med J (Engl) 2008; 121: 1830–7. [PubMed] [Google Scholar]
- 14. Paschalidis N, Huggins A, Rowbotham NJ et al Role of endogenous annexin‐A1 in the regulation of thymocyte positive and negative selection. Cell Cycle 2010; 9: 784–93. [PubMed] [Google Scholar]
- 15. Bist P, Leow SC, Phua QH et al Annexin‐1 interacts with NEMO and RIP1 to constitutively activate IKK complex and NF‐kappaB: Implication in breast cancer metastasis. Oncogene 2011; 30: 3174–85. [DOI] [PubMed] [Google Scholar]
- 16. Bartel DP. MicroRNAs: Genomics, biogenesis, mechanism, and function. Cell 2004; 116: 281–97. [DOI] [PubMed] [Google Scholar]
- 17. Kim YK, Kim VN. Processing of intronic microRNAs. EMBO J 2007; 26: 775–83. [DOI] [PMC free article] [PubMed] [Google Scholar]
- 18. Jiang DS, Wang YW, Jiang J, Li SM, Liang SZ, Fang HY. MicroRNA‐26a involved in Toll‐like receptor 9‐mediated lung cancer growth and migration. Int J Mol Med 2014; 34: 307–12. [DOI] [PubMed] [Google Scholar]
- 19. Leidinger P, Brefort T, Backes C et al High‐throughput qRT‐PCR validation of blood microRNAs in non‐small cell lung cancer. Oncotarget 2016; 7: 4611–23. [DOI] [PMC free article] [PubMed] [Google Scholar]
- 20. Yang Y, Zhang P, Zhao Y, Yang J, Jiang G, Fan J. Decreased MicroRNA‐26a expression causes cisplatin resistance in human non‐small cell lung cancer. Cancer Biol Ther 2015; 17: 515–25. [DOI] [PMC free article] [PubMed] [Google Scholar]
- 21. Xie Q, Wei M, Kang X et al Reciprocal inhibition between miR‐26a and NF‐κB regulates obesity‐related chronic inflammation in chondrocytes. Biosci Rep 2015; 35: e00204. [DOI] [PMC free article] [PubMed] [Google Scholar]
- 22. Wei C, Kim IK, Kumar S et al NF‐kappaB mediated miR‐26a regulation in cardiac fibrosis. J Cell Physiol 2013; 228: 1433–42. [DOI] [PubMed] [Google Scholar]
- 23. Lin Y, Lin G, Fang W, Zhu H, Chu K. Increased expression of annexin A1 predicts poor prognosis in human hepatocellular carcinoma and enhances cell malignant phenotype. Med Oncol 2014; 31: 327. [DOI] [PubMed] [Google Scholar]
- 24. Okano M, Kumamoto K, Saito M et al Upregulated Annexin A1 promotes cellular invasion in triple‐negative breast cancer. Oncol Rep 2015; 33: 1064–70. [DOI] [PubMed] [Google Scholar]
- 25. Han G, Tian Y, Duan B, Sheng H, Gao H, Huang J. Association of nuclear annexin A1 with prognosis of patients with esophageal squamous cell carcinoma. Int J Clin Exp Pathol 2014; 7: 751–9. [PMC free article] [PubMed] [Google Scholar]
- 26. Bist P, Phua QH, Shu S et al Annexin‐A1 controls an ERK‐RhoA‐NFkappaB activation loop in breast cancer cells. Biochem Biophys Res Commun 2015; 461: 47–53. [DOI] [PubMed] [Google Scholar]
- 27. Anbalagan D, Yap G, Yuan Y et al Annexin‐A1 regulates microRNA‐26b* and microRNA‐562 to directly target NF‐kappaB and angiogenesis in breast cancer cells. PLoS One 2014; 9: e114507. [DOI] [PMC free article] [PubMed] [Google Scholar]
- 28. Kang H, Ko J, Jang SW. The role of annexin A1 in expression of matrix metalloproteinase‐9 and invasion of breast cancer cells. Biochem Biophys Res Commun 2012; 423: 188–94. [DOI] [PubMed] [Google Scholar]
- 29. Zhang Z, Huang L, Zhao W, Rigas B. Annexin 1 induced by anti‐inflammatory drugs binds to NF‐kappaB and inhibits its activation: Anticancer effects in vitro and in vivo. Cancer Res 2010; 70: 2379–88. [DOI] [PMC free article] [PubMed] [Google Scholar]
- 30. Gerondakis S, Grumont R, Gugasyan R et al Unravelling the complexities of the NF‐kappaB signalling pathway using mouse knockout and transgenic models. Oncogene 2006; 25: 6781–99. [DOI] [PubMed] [Google Scholar]
- 31. Hayden MS, Ghosh S. NF‐kappaB, the first quarter‐century: Remarkable progress and outstanding questions. Genes Dev 2012; 26: 203–34. [DOI] [PMC free article] [PubMed] [Google Scholar]
- 32. Hoffmann A, Baltimore D. Circuitry of nuclear factor kappaB signaling. Immunol Rev 2006; 210: 171–86. [DOI] [PubMed] [Google Scholar]
- 33. Vallabhapurapu S, Karin M. Regulation and function of NF‐kappaB transcription factors in the immune system. Annu Rev Immunol 2009; 27: 693–733. [DOI] [PubMed] [Google Scholar]
- 34. Hoffmann A, Leung TH, Baltimore D. Genetic analysis of NF‐kappaB/Rel transcription factors defines functional specificities. EMBO J 2003; 22: 5530–9. [DOI] [PMC free article] [PubMed] [Google Scholar]
- 35. Leung TH, Hoffmann A, Baltimore D. One nucleotide in a kappaB site can determine cofactor specificity for NF‐kappaB dimers. Cell 2004; 118: 453–64. [DOI] [PubMed] [Google Scholar]
- 36. Sanjabi S, Hoffmann A, Liou HC, Baltimore D, Smale ST. Selective requirement for c‐Rel during IL‐12 P40 gene induction in macrophages. Proc Natl Acad Sci USA 2000; 97: 12705–10. [DOI] [PMC free article] [PubMed] [Google Scholar]
- 37. Sanjabi S, Williams KJ, Saccani S et al A c‐Rel subdomain responsible for enhanced DNA‐binding affinity and selective gene activation. Genes Dev 2005; 19: 2138–51. [DOI] [PMC free article] [PubMed] [Google Scholar]
- 38. Karin M, Ben‐Neriah Y. Phosphorylation meets ubiquitination: The control of NF‐[kappa]B activity. Annu Rev Immunol 2000; 18: 621–63. [DOI] [PubMed] [Google Scholar]
- 39. Bonizzi G, Karin M. The two NF‐kappaB activation pathways and their role in innate and adaptive immunity. Trends Immunol 2004; 25: 280–8. [DOI] [PubMed] [Google Scholar]
- 40. Hayden MS, Ghosh S. Signaling to NF‐kappaB. Genes Dev 2004; 18: 2195–224. [DOI] [PubMed] [Google Scholar]
Associated Data
This section collects any data citations, data availability statements, or supplementary materials included in this article.
Supplementary Materials
Figure S1. Relative expression levels of total p65 in non‐small cell lung cancer (NSCLC) tissues. (a) Quantitative polymerase chain reaction analysis indicated that the mRNA expression levels of p65 were upregulated in NSCLC tissues. (b) Western blotting indicated that p65 expression was markedly increased in NSCLC tissues. β‐Actin was used as endogenous controls and laminB1 as nuclear endogenous controls. Data are presented as the mean ± standard deviation for triplicate determinations. *P < 0.05 versus normal tissues.