Abstract
Background
The growth rate of thymic epithelial tumors (TETs) and thymic cysts was investigated to determine whether they can be differentiated and clinico‐radiological predictors of interval growth was identified.
Methods
This retrospective study included 122 patients with pathologically proven thymic cysts (n = 56) or TETs (n = 66) who underwent two serial chest computed tomography scans at least eight weeks apart. Average diameters and attenuation were measured, volume‐doubling times (VDTs) were calculated, and clinical characteristics were recorded. VDTs were compared using the log‐rank test. Predictors of growth were analyzed using the log‐rank test and Cox regression analysis.
Results
The frequency of growth did not differ significantly between TETs and thymic cysts (P = 0.279). The VDT of thymic cysts (median 324 days) was not significantly different from that of the TETs (median 475 days; P = 0.808). Water attenuation (≤ 20 Hounsfield units) predicted growth in thymic cysts (P = 0.016; hazard ratio 13.2, 95% confidence interval 1.6–107.3), while lesion size (> 17.2 mm) predicted growth in TETs (P = 0.008 for size, P = 0.029 for size*time). For the growing lesions, the positive and negative predictive values of water attenuation for thymic cysts were 93% and 80%, respectively.
Conclusion
The frequencies of interval growth and VDTs were indistinguishable between TETs and thymic cysts. Water attenuation and lesion size predicted growth in thymic cysts and TETs, respectively. Among the growing lesions, water attenuation was a differential feature of thymic cysts.
Keywords: Computer‐assisted diagnosis, growth, mediastinal cyst, multidetector computed tomography, thymoma
Introduction
The prevalent use of computed tomography (CT) in clinical practice and in screening settings has resulted in more frequent detection of incidental anterior mediastinal lesions. The Framingham Heart study and the Early Lung Cancer Action Project reported the prevalence of incidental anterior mediastinal lesions at 0.9% and 0.8%, respectively.1, 2 Notably, Henschke et al. reported that 41 of 71 incidental mediastinal masses were thymic lesions, indicating that the proportion of thymic lesions is considerable.2 Based on follow‐up observations of 36 thymic masses, they concluded that incidental thymic masses in asymptomatic patients should be managed conservatively, as most remained unchanged.2
Thymic epithelial tumors (TETs) are traditionally believed to grow slowly. However, only a few studies have reported the actual growth rate and the proportion of growing TETs. A recent study by Jeong et al. revealed that the growth rate (volume‐doubling time [VDT]) of TETs varied considerably across World Health Organization (WHO) histologic subtypes.3 Low‐grade thymomas (types A, AB, and B1) showed a median VDT of 704 days, while thymic carcinomas exhibited a much shorter median VDT of 146 days. Choe et al. reported similar findings of the VDT of TETs.4 These results suggest that assessing the growth rate of anterior mediastinal lesions over follow‐up CT scans might enable thymic nodules to be tentatively differentiated.
Nevertheless, it should be noted that incidental anterior mediastinal lesions include benign cysts (thymic cysts or bronchogenic cysts) mimicking TETs. In their study of 56 358 consecutive patients who underwent low‐dose chest CT scans, Yoon et al. reported that 32 out of 50 (64%) surgically resected lesions were thymic cysts.5 Accurate discrimination between benign cysts and thymic tumors is difficult based on CT features alone,6 and surgical resection is unavoidable in some patients.7 Thus, magnetic resonance imaging (MRI) can be conducted to evaluate incidental anterior mediastinal lesions,8 and conservative management with follow‐up would be a reasonable alternative to identify lesion growth, especially in small lesions.2 Nevertheless, growth per se is still inconclusive for a diagnosis of TET. Interestingly, Yoon et al. found that half of the growing lesions (5 of 10) in their study were thymic cysts, making a proper preoperative diagnosis more challenging.5
Therefore, the aim of this study was to investigate the growth rate of TETs and thymic cysts to determine whether they can be differentiated, and to identify clinico‐radiological predictors of interval growth.
Methods
The Institutional Review Board of Seoul National University Hospital, Seoul National University Bundang Hospital, and SMG‐SNU Boramae Medical Center approved this retrospective analysis. The requirement for written informed consent was waived.
Study population
The medical records of patients who underwent surgical resection of an anterior mediastinal lesion between 2006 and 2015 were retrospectively identified from the two tertiary and one secondary referral hospital databases. Among the patients, 404 were histopathologically diagnosed with either a thymic cyst (n = 142) or a TET (n = 262). The study population was then determined based on the following inclusion criteria: (i) patients with two serial preoperative chest CT scans obtained at least eight weeks apart, and (ii) patients with complete pathologic reports including diagnosis and WHO classification in cases of TET.9 None of the patients had been administered neoadjuvant chemotherapy or radiotherapy. One patient was excluded because of the lack of axial images from the initial CT scan (Fig 1).
Figure 1.
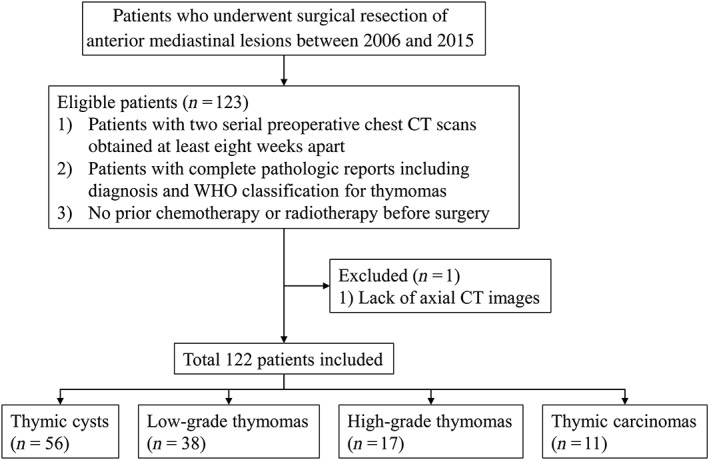
Flow diagram of patient inclusion and exclusion. CT, computed tomography; WHO, World Health Organization.
On the basis of the selection criteria, a total of 122 patients were included in the study (64 men, 58 women) (Table 1). The mean age (± standard deviation) of the overall population was 57.2 ± 10.6 years (men 58.2 ± 11.4 years; women 56.2 ± 9.6). There were 56 thymic cysts, 38 low‐grade thymomas (type A, n = 9; AB, n = 17; and B1, n = 12), 17 high‐grade thymomas (type B2, n = 13 and B3, n = 4), and 11 thymic carcinomas (type C).4, 10, 11
Table 1.
Demographic and clinico‐radiological characteristics in the study population
| Characteristics | Subcategory | Number of patients (%) |
|---|---|---|
| Age (years)† | 57 ± 11 | |
| Gender (M:F) | 64:58 | |
| Diagnosis | Thymic cyst | 56 (45.9) |
| TET | 66 (54.1) | |
| Attenuation (HU)‡ , § | Non‐enhanced | 43.4 (33.3, 49.2) |
| Enhanced | 63.4 (45.4, 83.2) | |
| Average diameter (mm)§ | 15.5 (8.9, 21.5) | |
| Diameter ratio† , ¶ | 0.69 ± 0.16 | |
| Former or current smoker†† | 43 (35.2) | |
| Presence of past cancer history | 27 (22.1) | |
| Follow‐up interval (days)§ | 444 (128, 1384) |
Data are mean ± standard deviation.
Attenuation data were not available in 54 patients for non‐enhanced computed tomography (CT) and 60 patients for enhanced CT.
Data are median (with interquartile range in parentheses).
The ratio of the maximum perpendicular diameter to the longest diameter.
Smoking history was not obtained in 15 patients.
HU, Hounsfield units; TET, thymic epithelial tumor.
Computed tomography scanning protocols
As the CT data were retrospectively collected over a long term and the referral hospitals used several distinct CT scanners, various multi‐detector CT scanners were inevitably used for CT imaging. The majority of the CT scans were performed using eight scanners from three manufacturers (Brilliance 64, Ingenuity, iCT, and iQon, Philips Healthcare, Best, the Netherlands; LightSpeed Ultra and Discovery CT750HD, GE Healthcare, Waukesha, WI, USA; and Somatom Sensation 16 and Definition, Siemens Healthcare, Forchheim, Germany). Patients underwent CT scans from the lung apex to base at suspended maximum inspiration. Scans were typically performed with 120 kVp, and for the most part, automatic exposure control was adopted for low‐dose or standard‐dose chest CT scans. Slice thickness ranged from 1 to 5 mm depending on the protocol. For the initial CT scans, contrast‐enhanced CT scans were obtained in 29 patients, while 60 patients underwent non‐enhanced CT scans. Thirty‐three patients had both non‐enhanced and enhanced CT scans.
Image analysis
A single board‐certified thoracic radiologist blinded to the pathology of the anterior mediastinal lesions analyzed all chest CT images. The lesion size (longest diameter and its maximum perpendicular diameter on both initial and follow‐up CT scans) was measured on the axial plane using an electronic caliper within the picture archiving and communication system (INFINITT Healthcare Co., Seoul, South Korea). The average diameter and diameter ratio (i.e. roundness) were calculated.12, 13 The diameter ratio was defined as the ratio of the maximum perpendicular diameter to the longest diameter. CT attenuation (Hounsfield unit [HU]) was also measured on the axial plane, which showed the longest lesion diameter of the initial CT scan by placing a round region of interest on the lesions.
Clinical data collection
The demographic and clinical characteristics of the patients were collected from their electronic medical records. Each patient's age, gender, smoking history (former or current smoker vs. never smoker), and past history of malignancy (presence vs. absence) at the time of surgery were recorded. The pathologic diagnosis, including the WHO classification of TETs, was also obtained.
Statistical analysis
In this study, growth was defined as an interval increase in the average diameter ≥ 2 mm.4, 14 The proportion of interval growth was compared between thymic cysts and TETs using the log‐rank test.
The volume of the lesions was calculated as follows.
The VDT was then calculated for lesions with interval growth according to the modified Schwartz formula:15, 16
where V0 = initial tumor volume and Vt = final tumor volume.
The log‐rank test was performed to compare the VDTs between the thymic cysts and TETs. The Kruskal–Wallis H test was then conducted to compare VDTs across the four disease categories (thymic cyst, low‐grade thymoma, high‐grade thymoma, and thymic carcinoma). The homogeneity of variance of VDT was compared among the four disease categories using the Fligner–Killeen test.
Univariate analysis was performed to determine the factors associated with interval growth. The growth rates of thymic cysts and TETs were estimated using the Kaplan–Meier method based on the abovementioned clinical and radiological factors. The differences between the Kaplan–Meier curves according to these factors were compared using the log‐rank test. For the log‐rank test, the attenuation of thymic cysts was dichotomized based on a cutoff of 20 HU (ie water attenuation; ≤ 20 HU vs. > 20 HU),8 regardless of the contrast‐enhancement status of CT scans. Other continuous variables were dichotomized using the median threshold of each variable. Variables with P values < 0.10 in the univariate analyses were input into multivariate Cox regression analysis. Stepwise selection was conducted with iterative entry of variables, and the Akaike information criterion was used for model selection. A test for non‐proportional hazards using the Schoenfeld residuals was performed to evaluate the proportionality of the variables in the Cox models.17 In case of violation of the proportional hazard assumption, a time‐dependent covariate was used as an input for the analysis.
Finally, for the growing lesions, the predictive performance of the analyzed features to differentiate thymic cysts from TETs was analyzed with respect to the sensitivity, specificity, accuracy, positive predictive value (PPV) and negative predictive value (NPV).
Missing data were not imputed in this study. All statistical analyses were performed using SPSS version 19.0 and R software version 3.1.0. P < 0.05 was considered to indicate statistical significance.
Results
The median average diameter was 13.3 mm (interquartile range [IQR] 8.9–18.6 mm) for thymic cysts and 17.2 mm (IQR 7.6–29.6 mm) for TETs. The interval growth was more frequent in TETs (48/66, 72.7%) than in thymic cysts (13/56, 23.2%), but the follow‐up duration was substantially shorter in thymic cysts (median follow‐up 193 days, IQR 98–763 days) than in TETs (median follow‐up 780 days, IQR 226–1631 days). The log‐rank test revealed that the frequency of interval growth did not significantly differ between TETs and thymic cysts (P = 0.279) (Fig 2). The median increment of the average diameter in growing lesions was 4.1 mm (IQR 3.2–7.2 mm) for thymic cysts and 8.7 mm (IQR 4.5–12.5 mm) for TETs.
Figure 2.
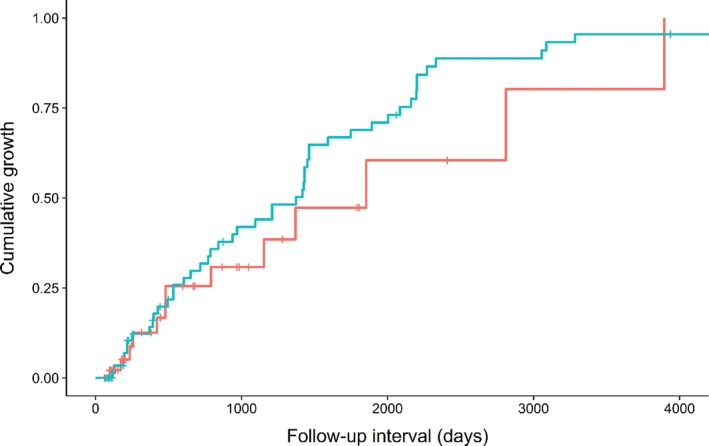
Kaplan–Meier plot for the cumulative growth of thymic cysts and thymic epithelial tumors (TETs). The frequency of growth was not significantly different between the two anterior mediastinal diseases (P = 0.279). ( ) Thymic cyst and (
 ) TET.
Volume‐doubling time of thymic cysts and thymic epithelial tumors (TETs)
The median VDT was 324 days (IQR 226–1558) for thymic cysts (n = 13) and 475 days (IQR 334–1017) for TETs (n = 48). The VDT of the thymic cysts was not significantly different from that of the TETs in the log‐rank test (P = 0.808). According to the WHO classification, the median VDT was 475 days (IQR 332–863) for low‐grade thymomas, 381 days (IQR 258–1106) for high‐grade thymomas, and 641 days (IQR 274–1475) for thymic carcinomas (Fig 3). There were no significant differences in the VDT among the four disease categories (P = 0.938). There were also no significant differences in the variance of VDT among the four disease categories (P = 0.502).
Figure 3.
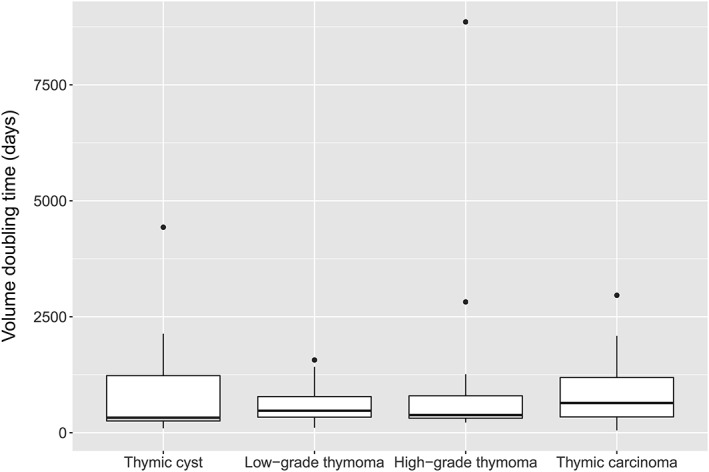
Box plot of volume doubling time (VDT) according to the disease categories. There were no significant differences in the VDT between thymic cysts and thymic epithelial tumors.
Factors associated with the growth of thymic cysts
On the initial CT scans, the median thresholds were 55 years for age, 0.69 for the diameter ratio, and 13.3 mm for the average diameter. The univariate log‐rank test revealed that the CT attenuation of pure water (≤ 20 HU) was significantly associated with interval growth in thymic cysts (P = 0.002) (Fig 4). The mean attenuation of growing cysts (22.3 ± 17.7 HU in non‐enhanced CT; 15.4 ± 11.8 HU in contrast‐enhanced CT) was lower than that of non‐growing cysts (40.2 ± 12.6 HU in non‐enhanced CT; 44.8 ± 22.2 HU in contrast‐enhanced CT). Other variables were not statistically significant for the growth of thymic cysts (P > 0.05) (Table 2). Subsequent Cox regression analysis also revealed that attenuation of ≤ 20 HU was significantly associated with the growth of thymic cysts (P = 0.016; hazard ratio [HR] 13.238; 95% confidence interval [CI] 1.632–107.362). Detailed data of the growing and non‐growing thymic cysts is shown in Table 3.
Figure 4.
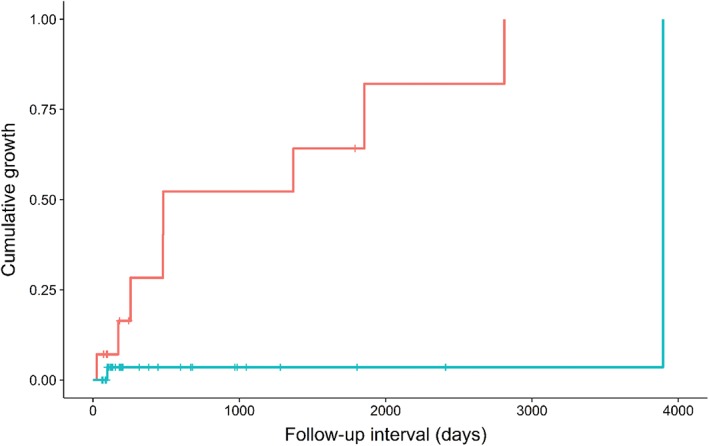
Kaplan–Meier plot of the cumulative growth of thymic cysts according to attenuation. Low‐attenuation cysts (≤ 20 Hounsfield units [HU]) exhibited a higher growth rate at given follow‐up intervals. ( ) HU ≤ 20 and (
 ) HU > 20.
Table 2.
Results of the univariate log‐rank test for the prediction of interval growth
| Variable | Subcategory | Thymic cyst P | TET P |
|---|---|---|---|
| Age | 0.925 | 0.296 | |
| Gender | 0.235 | 0.997 | |
| Diagnosis† | — | 0.355 | |
| Attenuation | Non‐enhanced | 0.002‡ | 0.812 |
| Enhanced | — | 0.216 | |
| Average diameter | 0.530 | 0.037 | |
| Diameter ratio§ | 0.517 | 0.561 | |
| Former or current smoker | 0.833 | 0.884 | |
| Past cancer history | 0.420 | 0.090 |
The diagnosis of thymic epithelial tumor (TET) was categorized into low‐grade thymoma (types A, AB, and B1), high‐grade thymoma (types B2 and B3), and thymic carcinoma.
The attenuation of thymic cysts was dichotomized based on a cutoff of 20 Hounsfield units (HU, i.e. water attenuation ≤ 20 HU vs. > 20 HU), regardless of the contrast‐enhancement status of computed tomography scans (number of missing data for attenuation after data pooling was 7).
The ratio of the maximum perpendicular diameter to the longest diameter.
Table 3.
Characteristics of growing and non‐growing thymic cysts
| Variable | Subcategory | Growing (n = 13) | Non‐growing (n = 43) |
|---|---|---|---|
| Age (years)† | 59 ± 10 | 54 ± 10 | |
| Gender (M:F) | 3:10 | 25:18 | |
| Attenuation (HU)† , ‡ | Non‐enhanced | 22.3 ± 17.7 | 40.2 ± 12.6 |
| Enhanced | 15.4 ± 11.8 | 44.8 ± 22.2 | |
| Average diameter (mm)§ | 11.8 (7.2, 22.9) | 13.7 (8.9, 18.5) | |
| Diameter ratio† , ¶ | 0.70 ± 0.16 | 0.69 ± 0.17 | |
| Former or current smoker†† | 2 (15.4) | 15 (34.9) | |
| Past cancer history | 1 (7.7) | 6 (14.0) | |
| Follow‐up interval (days)§ | 479 (245, 1611) | 153 (97, 597) |
Data are mean ± standard deviation.
Attenuation data was not available in 21 patients for non‐enhanced computed tomography (CT) and 34 patients for enhanced CT because the lesions in these patients were too small to place regions‐of‐interest appropriately.
Data are medians (with interquartile range in parentheses).
The ratio of the maximum perpendicular diameter to the longest diameter.
Smoking history was not obtained in six patients. Unless otherwise specified, data are numbers of patients (% in parentheses).
HU, Hounsfield units.
Factors associated with the growth of TETs
The median thresholds were 60 years for age, 0.72 for the diameter ratio, 17.2 mm for the average diameter on the initial CT scan, 46.2 HU for attenuation on non‐enhanced CT, and 76.0 HU for attenuation on contrast‐enhanced CT. The univariate log‐rank test revealed that the average diameter on the initial CT scan was significantly associated with the interval growth of TETs (P = 0.037) (Fig 5; Table 2). That is, lesions > 17.2 mm exhibited a significantly higher rate of growth at a given follow‐up interval. The median diameter of the growing TETs (median 15.0 mm, IQR 7.1–25.3 mm) was smaller than that of the non‐growing TETs (median 22.6 mm, IQR 16.5–35.5 mm). However, time‐to‐event analysis revealed that the actual relationship between tumor size and growth was the opposite. A past history of malignancy showed a P value of 0.090. Other variables were not statistically significant in the univariate analyses (P > 0.10). Detailed data regarding the growing and non‐growing TETs can is shown in Table 4.
Figure 5.
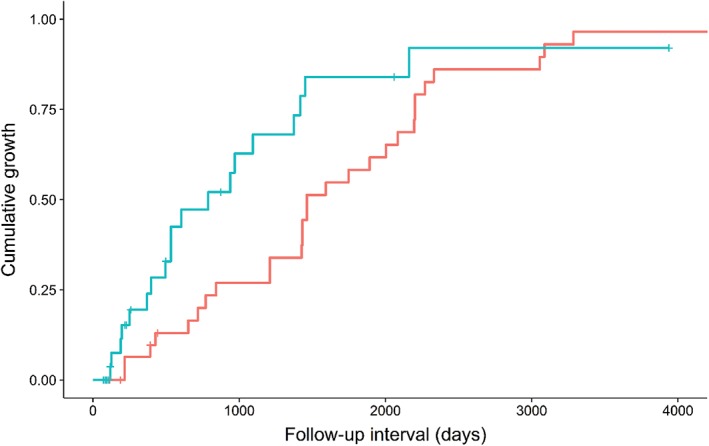
Kaplan–Meier plot of the cumulative growth of thymic epithelial tumors (TETs) according to size (average diameter). TETs > 17.2 mm showed a higher growth rate at given follow‐up intervals. ( ) Size ≤ 17.2 mm and (
 ) size > 17.2 mm.
Table 4.
Characteristics of growing and non‐growing thymomas
| Variable | Subcategory | Growing (n = 48) | Non‐growing (n = 18) |
|---|---|---|---|
| Age (years)† | 59 ± 10 | 59 ± 11 | |
| Gender (M:F) | 28:20 | 8:10 | |
| Diagnosis | A, AB, B1 | 26 (54.2) | 12 (66.7) |
| B2, B3 | 12 (25.0) | 5 (27.8) | |
| C | 10 (20.8) | 1 (5.6) | |
| Attenuation (HU)‡ , § | Non‐enhanced | 46.9 (42.0, 54.0) | 44.1 (41.0, 55.6) |
| Enhanced | 73.6 (56.6, 90.6) | 81.6 (61.8, 91.5) | |
| Average diameter (mm)‡ | 15.0 (7.1, 25.3) | 22.6 (16.5, 35.5) | |
| Diameter ratio† , ¶ | 0.69 ± 0.15 | 0.71 ± 0.15 | |
| Former or current smoker†† | 22 (53.7) | 4 (25.0) | |
| Past cancer history | 17 (35.4) | 3 (16.7) | |
| Follow‐up interval (days)‡ | 1209 (504, 1975) | 203 (105, 457) |
Data are mean ± standard deviation.
Data are median (with interquartile range in parentheses).
Data were not available in 33 patients for non‐enhanced computed tomography (CT) and 26 patients for enhanced CT.
The ratio of the maximum perpendicular diameter to the longest diameter.
Smoking history was not available in nine patients. Unless otherwise specified, data are numbers of patients (% in parentheses).
HU, Hounsfield units.
Subsequent multivariate Cox regression analysis demonstrated that an average diameter > 17.2 mm was the only independent factor associated with thymoma growth (time‐dependent covariate; P = 0.008 for average diameter and P = 0.029 for average diameter*time). The HR was calculated as follows:
where time equals the CT follow‐up interval.
Predictive value of the growth predictors among growing thymic lesions
Among the growing thymic lesions (Fig 6), the predictive performance of water attenuation (cutoff: 20 HU) for the thymic cysts in terms of sensitivity, specificity, accuracy, PPV and NPV was 93%, 80%, 90%, 93%, and 80%, respectively. However, the predictive performance of the average diameter (cutoff: 17.2 mm) in terms of sensitivity, specificity, accuracy, PPV, and NPV was 40%, 54%, 43%, 76%, and 19%, respectively.
Figure 6.
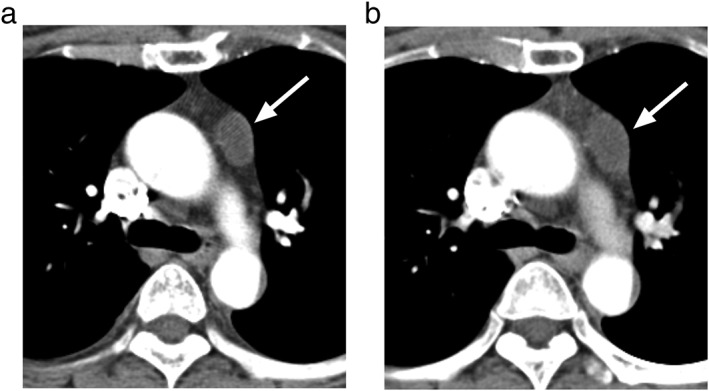
A representative case of a thymic cyst in a 53‐year old woman. (a) The average diameter of the left anterior mediastinal cyst was 17.9 mm, mean attenuation was 12.2 Hounsfield units. (b) On the follow‐up computed tomography scan (interval, 173 days), the size had increased to 21.4 mm.
Discussion
Our study found that there was no significant difference in the growing fraction between thymic cysts and TETs over the follow‐up period. Furthermore, if thymic cysts grew, they exhibited similar growth rates (median VDT 324 days) to those of TETs (median VDT 475 days), regardless of the WHO histologic classification. The range of the VDT in TETs (IQR 334–1017 days) was substantial, indicating that TETs may look stable and mimic benign lesions, even with sufficient follow‐up intervals (i.e. 2 years). Some features on the initial CT scan were significant predictors of growth during follow‐up for both diseases: water attenuation (≤ 20 HU) for thymic cysts and average diameter (> 17.2 mm) for TETs. Water attenuation was a useful CT feature to differentiate thymic cysts among the growing thymic lesions (PPV 93%, NPV 80%).
A number of incidentally detected anterior mediastinal lesions are benign lesions, including thymic cysts. Interestingly, a fraction of thymic cysts may grow over the course of follow‐up, although they are not cancerous and do not have neoplastic cells.5, 18 We confirmed that an evaluation based on the simple binary classification of growth or non‐growth during follow‐up is insufficient to clearly distinguish disease entities. In other words, interval growth alone cannot exclude benignity, and non‐growing lesions are not always benign. The hypothesis of our study was that calculating the VDT might enable the discrimination of thymic cysts from TETs, given the assumption that normal epithelial‐lined cysts would grow more slowly than tumors. However, the range of VDT was variable for both thymic cysts and TETs, and differentiation based on the VDT was not feasible.
Even for TETs, the growth rates were not significantly different according to the WHO subtypes, in contrast to the findings of previous reports.3, 4 The median VDTs of the low‐grade (475 days) and high‐grade (381 days) thymomas in our study were within the range of past research (436–704 and 381–421 days, respectively).3, 4 However, the VDT of the thymic carcinomas was much higher in our study (641 days) than in two previous studies (146–189 days).3, 4 Considering the pathologic evidence that Ki‐67 labeling indices were significantly higher in type C than in other subtypes while the rate of apoptosis was not elevated, rapid growth of thymic carcinoma is biologically plausible.19 A possible cause for this discrepancy is that the pathologic diagnosis is determined by the highest histological grade among multiple mixed subtypes. In fact, the subtype of the major proportion of the lesion, not the subtype of the highest grade, might determine the growth rate of thymic carcinomas. The 2015 WHO classification states that the subtype of TETs should be estimated in 10% increments for each component, as thymic tumors with more than one tumor subtype are common.20, 21 However, this study population underwent surgery before the new reporting system was established, thus information regarding the proportion of each tumor component was not available from the patients’ electronic medical records. A second reason may be the spectrum bias among different studies, which is inevitable in small retrospective studies.22
Water attenuation was a significant factor associated with growth in thymic cysts. This preferential characteristic of thymic cysts offers a high NPV (93%) for the discrimination of benign cysts among growing thymic lesions. Our finding may help relieve patients’ and clinicians’ concerns about growing cystic lesions. CT follow‐up rather than surgical resection can be recommended for obvious cysts, even if they show interval growth. Nevertheless, care should be taken for cystic thymomas. If a lesion cannot be determined to be purely a cyst on a contrast‐enhanced CT scan, MRI can help to detect nodular wall thickening or the solid portion of cystic thymomas.23 In addition, larger TETs show growth more frequently than smaller TETs; therefore, CT surveillance may be prolonged for small lesions to confirm growth, even for TETs.
There were several limitations to this study. First, we included patients who underwent surgical resection, which induced selection bias. As benign‐appearing cystic lesions or stable cysts are not usually resected, the growth proportion would be lower in the general population. Second, the proportion of each histologic subtype of TETs was not analyzed. Analysis of the major and the second major component may be valuable for investigating the tumor growth rate. Third, the CT protocols were heterogeneous in our dataset.
In conclusion, the frequencies of interval growth and the growth rates are indistinguishable between thymic cysts and TETs. Therefore, growth assessment with repeated follow‐up CT scanning cannot clearly differentiate TETs from thymic cysts in cases of incidental thymic lesions. Nevertheless, given the high NPV of water attenuation, CT attenuation measurement seems to be valuable for differentiating cysts from growing TETs and may be supported by further noninvasive work‐up, such as contrast‐enhanced CT or MRI for clearer differentiation.
Disclosure
No authors report any conflict of interest.
Acknowledgment
This study was supported by the SNUH Research Fund, funded by Seoul National University Hospital, Seoul, South Korea (Grant No.: 23‐2017‐0060).
References
- 1. Araki T, Nishino M, Gao W et al Anterior mediastinal masses in the Framingham Heart Study: Prevalence and CT image characteristics. Eur J Radiol Open 2015; 2: 26–31. [DOI] [PMC free article] [PubMed] [Google Scholar]
- 2. Henschke CI, Lee IJ, Wu N et al CT screening for lung cancer: Prevalence and incidence of mediastinal masses. Radiology 2006; 239: 586–90. [DOI] [PubMed] [Google Scholar]
- 3. Jeong DY, Lee KS, Chung MJ, Zo JI, Shim YM, Moon JW. Doubling time of thymic epithelial tumors correlates with World Health Organization histopathologic classification. AJR Am J Roentgenol 2017; 209: W202–10. [DOI] [PubMed] [Google Scholar]
- 4. Choe J, Lee SM, Lim S et al Doubling time of thymic epithelial tumours on CT: Correlation with histological subtype. Eur Radiol 2017; 27: 4030–6. [DOI] [PubMed] [Google Scholar]
- 5. Yoon SH, Choi SH, Kang CH, Goo JM. Incidental anterior mediastinal nodular lesions on chest CT in asymptomatic subjects. J Thorac Oncol 2018; 13: 359–66. [DOI] [PubMed] [Google Scholar]
- 6. Tomiyama N, Honda O, Tsubamoto M et al Anterior mediastinal tumors: Diagnostic accuracy of CT and MRI. Eur J Radiol 2009; 69: 280–8. [DOI] [PubMed] [Google Scholar]
- 7. Ackman JB, Verzosa S, Kovach AE et al High rate of unnecessary thymectomy and its cause. Can computed tomography distinguish thymoma, lymphoma, thymic hyperplasia, and thymic cysts? Eur J Radiol 2015; 84: 524–33. [DOI] [PubMed] [Google Scholar]
- 8. Carter BW, Okumura M, Detterbeck FC, Marom EM. Approaching the patient with an anterior mediastinal mass: A guide for radiologists. J Thorac Oncol 2014; 9 (Suppl 2): S110–8. [DOI] [PubMed] [Google Scholar]
- 9. Travis WD, Brambilla E, Burke A, Marx A, Nicholson AG. WHO Classification of Tumours of the Lung, Pleura, Thymus and Heart. IARC, Lyon: 2015. [DOI] [PubMed] [Google Scholar]
- 10. Falkson CB, Bezjak A, Darling G et al The management of thymoma: A systematic review and practice guideline. J Thorac Oncol 2009; 4: 911–9. [DOI] [PubMed] [Google Scholar]
- 11. Weis CA, Yao X, Deng Y et al The impact of thymoma histotype on prognosis in a worldwide database. J Thorac Oncol 2015; 10: 367–72. [DOI] [PMC free article] [PubMed] [Google Scholar]
- 12. McErlean A, Huang J, Zabor EC, Moskowitz CS, Ginsberg MS. Distinguishing benign thymic lesions from early‐stage thymic malignancies on computed tomography. J Thorac Oncol 2013; 8: 967–73. [DOI] [PMC free article] [PubMed] [Google Scholar]
- 13. Lee JH, Park CM, Park SJ, Bae JS, Lee SM, Goo JM. Value of computerized 3D shape analysis in differentiating encapsulated from invasive thymomas. PLoS One 2015; 10: e0126175. [DOI] [PMC free article] [PubMed] [Google Scholar]
- 14. Oxnard GR, Zhao B, Sima CS et al Variability of lung tumor measurements on repeat computed tomography scans taken within 15 minutes. J Clin Oncol 2011; 29: 3114–9. [DOI] [PMC free article] [PubMed] [Google Scholar]
- 15. Schwartz M. A biomathematical approach to clinical tumor growth. Cancer 1961; 14: 1272–94. [DOI] [PubMed] [Google Scholar]
- 16. Song YS, Park CM, Park SJ, Lee SM, Jeon YK, Goo JM. Volume and mass doubling times of persistent pulmonary subsolid nodules detected in patients without known malignancy. Radiology 2014; 273: 276–84. [DOI] [PubMed] [Google Scholar]
- 17. Therneau TM, Grambsch P. Extending the Cox Model. Springer–Verlag, New York: 2000. [Google Scholar]
- 18. Ackman JB. MR imaging of mediastinal masses. Magn Reson Imaging Clin N Am 2015; 23: 141–64. [DOI] [PubMed] [Google Scholar]
- 19. Hiroshima K, Iyoda A, Toyozaki T et al Proliferative activity and apoptosis in thymic epithelial neoplasms. Mod Pathol 2002; 15: 1326–32. [DOI] [PubMed] [Google Scholar]
- 20. Marx A, Strobel P, Badve SS et al ITMIG consensus statement on the use of the WHO histological classification of thymoma and thymic carcinoma: Refined definitions, histological criteria, and reporting. J Thorac Oncol 2014; 9: 596–611. [DOI] [PubMed] [Google Scholar]
- 21. Marx A, Chan JK, Coindre JM et al The 2015 World Health Organization classification of tumors of the thymus: Continuity and changes. J Thorac Oncol 2015; 10: 1383–95. [DOI] [PMC free article] [PubMed] [Google Scholar]
- 22. Park SH, Han K. Methodologic guide for evaluating clinical performance and effect of artificial intelligence technology for medical diagnosis and prediction. Radiology 2018; 286: 800–9. [DOI] [PubMed] [Google Scholar]
- 23. Marom EM. Imaging thymoma. J Thorac Oncol 2010; 5 (10 Suppl 4): S296–303. [DOI] [PubMed] [Google Scholar]


