

Abstract
Objective:
To assess how a quantifiable measure of vascularity—i.e. abnormal confluence (Acon) in the subplacental myometrium observed by three-dimensional power-Doppler ultrasonography—changes with different bladder volumes.
Methods:
In a prospective observational study, women referred to a tertiary UK center with suspected PAS disorders were recruited between August 2015 and May 2017. The largest area of confluent three-dimensional power-Doppler signal (Acon) at the uteroplacental interface was estimated under two bladder volumes differing by at least 200 mL.
Results:
Acon was calculated for 14 women, of whom seven were subsequently found to have PAS disorders. For these seven women, log(Acon) was significantly greater when measured with a filled bladder than when measured with an unfilled bladder (P<0.001).
Conclusion:
Objective evidence was found for a quantifiable difference in vascularity in the myometrium with bladder volume among women with PAS disorders. This difference has sufficient magnitude to influence the potential of Acon as a diagnostic marker.
Keywords: Bladder volume, Placenta accreta spectrum disorder, Placenta creta, Placenta increta, Placenta percreta, Power Doppler, Three-dimensional ultrasonography
1. INTRODUCTION
The full spectrum of abnormal placental attachment includes abnormally adherent (creta) and abnormally invasive (increta and percreta). There is no current international agreement on the terminology that should be used to describe the disorder, and placenta accreta (covering all degrees of abnormality), abnormally invasive placenta, placenta accreta spectrum (PAS), and morbidly adherent placenta have all been used. In the present study, “PAS disorders” is used to describe the whole spectrum of both abnormally adherent and invasive placenta.
Maternal mortality and morbidity are reduced when women with PAS disorders deliver in a center of excellence with a multidisciplinary care team who have experience in managing the risks and challenges presented by the condition [1–4]. Transfer to an experienced team, however, relies on accurate prenatal diagnosis. Recent studies have shown that PAS disorders remain undiagnosed before delivery in one-half [5] to two-thirds [6] of cases. Even in specialist centers, approximately one-third of cases of PAS disorders are not correctly diagnosed during pregnancy [7].
Most reported ultrasonography signs vary in sensitivity and specificity [8]. To improve consistency and facilitate an appropriate comparison of different ultrasonography markers, experts have published consensus statements aiming to standardize both the descriptions and minimum requirements for diagnosis of PAS using ultrasound [9,10]. Magnetic resonance imaging is arguably less operator-dependent than ultrasound imaging, but its use beyond diagnosing villous invasion of pelvic organs and tissues in cases of placenta percreta remains limited in routine clinical practice [11]. Current ultrasound diagnosis of PAS is completely subjective, and its accuracy depends not only on the experience of the operator, which is limited by the rarity of the condition, but also on many technical aspects [12]. It is therefore essential that the techniques used are clearly defined; this includes explaining the effect that filling or emptying the urinary bladder can have on both the appearance of images and the assessment of the underlying vascularity, which is arguably the most difficult and subjective of all the signs.
PAS disorders are most commonly associated with an anterior low-lying placenta or placenta previa. As a result, most of the commonly accepted ultrasound signs of PAS disorders, such as “bladder wall interruption” (i.e. loss or interruption of the bright bladder wall, the hyperechoic band or “line” between the uterine serosa and the bladder lumen [10]), relate to the anterior lower segment. Figure 1 shows a midline sagittal two-dimensional B-mode image of a case of major placenta previa obtained with an almost empty (Figure 1A) and an adequately filled (Figure 1B) bladder. In the non-filled case, it is almost impossible to identify the bright bladder wall or to comment on its integrity. The myometrium would be extremely difficult to measure and the clear zone is hard to identify. Even for an anterior placenta with no previa, the clear zone is more difficult to visualize with an empty bladder (Figure 2).
Figure 1.

Midline sagittal images of a patient with placenta previa and creta at 21 weeks of pregnancy. (A) Scan acquired with an empty bladder (<50 mL). (B) Scan acquired with a full bladder (287 mL).
Figure 2.

Images from a patient without a placenta accreta spectrum disorder at 32 weeks, showing that the clear zone is more apparent with (A) a full bladder (258 mL) than with (B) an empty bladder (<30 mL), with minimal probe pressure.
The “placental bulge” sign, defined as “deviation of the uterine serosa away from the expected plane, caused by an abnormal bulge of placental tissue into a neighboring organ, typically the bladder” [10], represents a loss of structural integrity in the muscle of the uterus, resulting in this area “bulging” away from the rest of the uterus. This most commonly occurs in the anterior lower segment and is extremely difficult to detect without a full bladder because the bulge into surrounding tissue is less evident when the bladder is empty.
The most difficult signs to assess, however, are the highly subjective hypervascularity markers of PAS. The sign relating to the bladder is “utero-vesical hypervascularity,” defined as a “striking amount of color Doppler signal seen between the myometrium and the posterior wall of the bladder” [10]. This is almost impossible to assess with an empty bladder (Figure 3B), because the bladder outline is required to demarcate the area between the anterior uterine wall and the posterior wall of the bladder (Figure 3A). In Figure 3, the fuller bladder allows a clearer picture of uterovesical vascularity, showing the cluster of vascularity around the small bladder bulge and the increased vascularity in the region of the cervix. What remains unclear is whether the volume of the bladder directly affects the amount of vascularity seen.
Figure 3.

Differences in appearance of the vascularity in a woman with placenta increta at 24 weeks of pregnancy. (A) Scan acquired with a full bladder (398 mL). (B) Scan acquired with a relatively empty bladder (62 mL).
To our knowledge, the only objective quantifiable tool for diagnosing PAS disorders uses three-dimensional power-Doppler (3D-PD) to estimate the size of the abnormal hypervascularity seen with color Doppler [13]. This technique produces an estimation of the largest area of confluent 3D-PD signal (Acon) seen at the uteroplacental interface and is thought to represent the abnormal flow arising from placental invasion into the myometrial anastomoses [14]. In a pilot study of 93 women at risk of PAS disorder [13], the size of Acon was found to correlate not only with a diagnosis of PAS, but also with the reported severity of the disorder at delivery.
The aim of the present study was to further illustrate how ultrasonography signs of PAS disorders change with bladder filling, by determining whether there is a quantifiable difference in vascularity at the uteroplacental interface measured by 3D-PD under different bladder volumes.
2. MATERIALS AND METHODS
In the present prospective observational study, women attending a specialist placenta clinic at the John Radcliffe Hospital, Oxford, UK (a tertiary referral university hospitalwere recruited between August 1, 2015, and May 31, 2017. The study inclusion criteria were referral to the specialist placenta clinic for suspected PAS disorder and the participant’s willingness to fill her bladder. The exclusion criteria were multiple pregnancy, age younger than 16 years, and inability to provide informed consent. Written informed consent was obtained in accordance with approval by the local research ethics committee (14/NS/0069).
The women were managed in accordance with the standard protocol of the study unit. Presence and severity of PAS disorders were assessed at delivery as previously described [13] by an experienced attending obstetrician (SC) and from histopathology results when hysterectomy was performed. All histopathology samples were reviewed by senior pathologists with expertise in perinatology.
Patients underwent standard diagnostic imaging in accordance with the protocol of the study unit. Additionally, static transabdominal 3D-PD ultrasound volumes of the placental bed were obtained using a RAB4–8-D 3D/4D curved array abdominal transducer (4–8.5 MHz) on a Voluson E8 instrument (General Electric Healthcare, Milwaukee, WI, USA) as previously described [13]. Briefly, predetermined machine settings with sub-noise gain were selected, and sagittal volumes were captured in the midline under the uterovesical fold.
Actual bladder volume was estimated online in 2D B-mode using the Voluson 3 distance generic volume tool (General Electric Healthcare, Milwaukee, WI, USA) and measuring the following three distances: the uterovesical fold to the base of bladder and the anterior bladder wall to posterior wall at the midpoint of the bladder, both in sagittal midline view; and the distance from side to side through the middle of the bladder in coronal view.
Two 3D-PD scans were taken at the same visit of the identical region of interest, which focused on the area of suspected PAS. The first 3D-PD scan volume was captured when the patient reported the sensation of a “full” bladder and the actual bladder volume was estimated to be more than 200 mL by ultrasonography. The second scan volume was captured after the participant had micturated and reported an “empty” bladder. To ensure an appropriate difference, the participant was asked to try to void again if the estimated difference in volumes was less than 200 mL between the two scans. The data were stored anonymously using SonoView (General Electric Healthcare, Milwaukee, WI, USA).
The parameter Acon was measured offline in accordance with a predefined protocol [13]. In summary, volumes were manipulated in 3D by using 4D View (General Electric Healthcare) The color-only Magicut tool was used to sequentially remove maternal, fetal, and placental bed vasculature, leaving a 1-cm signal at the uteroplacental interface. Acon was then identified and measured using the 4D View generic area tool. The sonographer was masked to the delivery outcome but, because they were examining the images, could not be masked to the fullness of the bladder.
Data analyses were done using SPSS version 22 (IBM, Armonk, NY, USA). Because Acon has been found to be right-skewed [13], Acon was log-transformed and log(Acon) was tested for normality by using the Shapiro–Wilk method. Paired Student t test was used to test for a difference between log(Acon) values obtained with full bladder and log(Acon) values obtained with unfilled bladder. Women with PAS disorders and those without PAS disorders were analyzed separately. Statistical significance was assumed at P<0.05. Figures were constructed using Prism version 6 (GraphPad Software, La Jolla, CA, USA)
3. RESULTS
Fifteen patients were recruited during the study period, and a bladder volume difference of more than 200 mL was achieved for 14. Subsequently, seven of these 14 women were found to have histologically confirmed PAS disorders at delivery, whereas seven had no PAS disorder (i.e. there was spontaneous placental separation at delivery). Log(Acon) was confirmed to be normally distributed in the two patient groups, and for both filled and unfilled bladders (Shapiro–Wilk method P>0.05.)
The volumes of filled and unfilled bladder for the two patient groups are reported in Table S1. Two women—one in the PAS group and one in the non-PAS group—were found to have filled bladder volumes of 800 mL or more. Neither could empty their bladders completely, leaving residuals of 187 mL and 326 mL.
Among the women with PAS disorders, the value for log(Acon) was significantly greater when measured with a filled bladder than when measured with an unfilled bladder (P<0.001) (Figure 4, Figure S1A). By contrast, no significant difference was detected in log(Acon) values between filled bladder and unfilled bladder measurements among patients without PAS disorders (P=0.908) (Figure 4, Figure S1B).
Figure 4.

Comparison of 3D power-Doppler signals observed for a woman with a filled and underfilled bladder. (A) Sagittal midline 2D view when the bladder is full. (B) 3D glass body render in transverse view when the bladder is full. (C) Sagittal midline 2D view when the bladder is underfilled. (D) 3D glass body render in transverse view when the bladder is underfilled. Abbreviations: 3D, three-dimensional; 2D, two-dimensional.
Comparison of log(Acon) measured with an unfilled bladder between the PAS and non-PAS groups showed a significant difference (P=0.05). However, the difference was greater when the log(Acon) values measured with a full bladder were compared between the PAS and non-PAS groups (P<0.001) (Figure 5).
Figure 5.
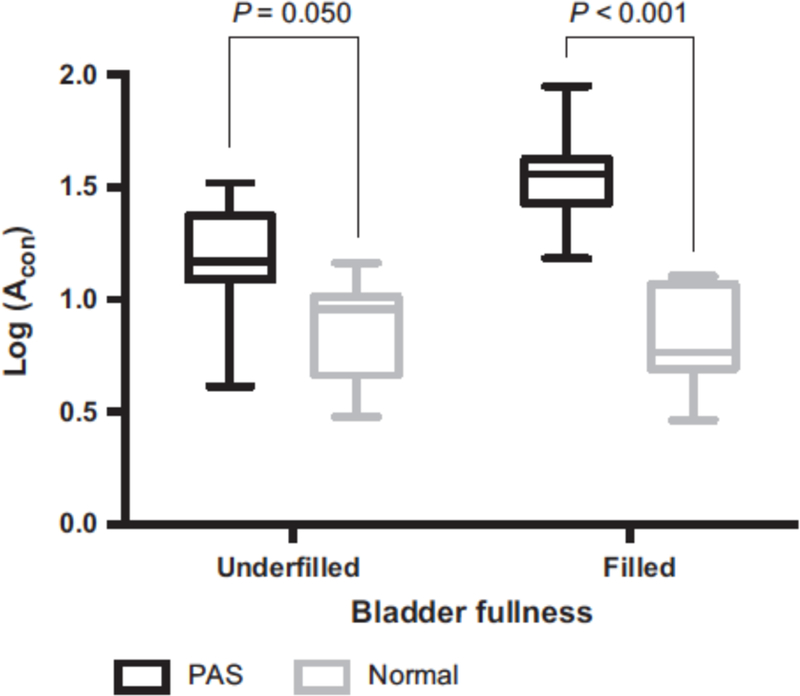
Boxplots showing the mean and range of log(Acon) values among cases of PAS disorder and non-PAS obtained with filled and underfilled bladders. Abbreviations: Acon, abnormal confluence; PAS, placenta accreta spectrum.
4. DISCUSSION
The present data support the view that it is extremely difficult, if not impossible, to diagnose PAS disorders by ultrasound imaging if the bladder of the patient is empty. It is thus surprising that this essential technical issue has not been previously highlighted in either studies or most guidelines published worldwide, including the standardized proforma for reporting ultrasound diagnosis of PAS disorders [9].
The study data demonstrated a quantifiable effect of bladder filling on Acon, an objective ultrasound marker of the abnormal pattern of the vasculature under the placental bed in PAS disorder. Importantly, this effect was seen only in the placental bed of women with PAS disorders; it did not occur in a normal placental bed. Acon is a metric derived from the 3D-PD signal, which records the same vascularity that is subjectively observed by color Doppler imaging. It therefore follows that the performance of the subjective marker of hypervascularity might also be affected by an inadequately filled bladder.
The mechanism underlying the development of Acon is unclear. The most biologically plausible theory is that a deep invasion of extravillous trophoblast and subsequent vascular remodeling causes enlargement and merging of arteriovenous anastomoses in the subplacental myometrium, producing a large, relatively slow-draining ateriovenous sump within the myometrium [12–15]. Extrinsic pressure within the pelvis from a filled bladder might potentially impair venous outflow from this abnormal vasculature. The subsequent engorgement of the remodeled vessels would be observed as an increase in Acon for the measurement with a filled bladder. By contrast, the small areas of power-Doppler signal measured as Acon in normal placentas are likely to result from measuring artefacts observed where arteries cross in the basal plate. These higher-pressure thick-walled arterial vessels are less effected by venous engorgement; thus, Acon will be unaffected by bladder volume in a normal placenta.
The present study has several limitations, including difficulties inherent to an assessment of the highly subjective signs of PAS disorders. Nevertheless, we believe that the images shown in the study are sufficiently convincing to persuade sonographers of the benefit of encouraging women to attend their ultrasound scan with a full bladder. The sample size for the Acon study was small and, without an estimate of effect size, a power calculation was not possible. However, the high P value and clear trend in the PAS group is sufficient to demonstrate that the effect size is large in verified cases of abnormal placentation. Two women had bladder volumes of more than 800 mL, representing an excessively filled bladder, and were unable to completely empty their bladders. In the PAS case, Acon increased between the measurement at 300 mL and the measurement at 800 mL, which suggests a potential dose–response relationship; it also indicates that an overfilled bladder should be avoided. By contrast, minimal difference in Acon was observed for the woman without PAS, despite the excessive bladder volume. Within the context of a busy ultrasonography clinic, it is impossible to control the exact amount by which a woman can fill her bladder. The study women reported a full bladder sensation at 255–866 mL.
The present pilot data indicate that the value of the quantitative marker Acon differs depending on bladder volume, but more data are required to fully understand the relationship. Furthermore, this result should be reproduced in a larger sample of patients in future studies. The data also provide subjective evidence for the need for a full bladder to ensure that some of the subjective signs of PAS can be properly assessed. The effect of bladder volume on the 3D-PD signal in PAS has sufficient magnitude to influence potential diagnostic markers and the subjective appearance of hypervascularity. Thus, all sonographers should ensure that women have an adequately filled bladder (≥250 mL) before attempting to diagnose PAS disorders.
Supplementary Material
Figure S1 Line graph of log(Acon) values for underfilled and then filled bladder for (A) each patient with PAS disorder and (B) each non-PAS control. Abbreviation: Acon, abnormal confluence; PAS, placenta accreta spectrum.
Table S1 Mean bladder volume and log(Acon) value for the study women by diagnosis. Abbreviation: Acon, abnormal confluence.
Synopsis:
Bladder volume has a quantifiable effect on placental bed vascularity; adequate bladder filling is essential to visualize signs of placenta accreta spectrum disorder.
Acknowledgments
The study was supported by the Eunice Kennedy Shriver National Institute of Child Health and Human Development Human Placenta Project of the National Institutes of Health (award number UO1 HD 087209).
Footnotes
Conflicts of interest
The authors have no conflicts of interest.
References
- [1].Eller AG, Bennett MA, Sharshiner M, et al. Maternal morbidity in cases of placenta accreta managed by a multidisciplinary care team compared with standard obstetric care. Obstet Gynecol 2011;117:331–337. [DOI] [PubMed] [Google Scholar]
- [2].Al-Khan A, Gupta V, Illsley NP, et al. Maternal and fetal outcomes in placenta accreta after institution of team-managed care. Reprod Sci 2014;21:761–771. [DOI] [PubMed] [Google Scholar]
- [3].Silver RM, Fox KA, Barton JR, et al. Center of excellence for placenta accreta. Am J Obstet Gynecol 2015;212:561–568. [DOI] [PubMed] [Google Scholar]
- [4].Shamshirsaz AA, Fox KA, Salmanian B, et al. Maternal morbidity in patients with morbidly adherent placenta treated with and without a standardized multidisciplinary approach. Am J Obstet Gynecol 2015;212:218.e1–9. [DOI] [PubMed] [Google Scholar]
- [5].Bailit JL, Grobman WA, Rice MM, et al. Morbidly adherent placenta treatments and outcomes. Obstet Gynecol 2015;125:683–689. [DOI] [PMC free article] [PubMed] [Google Scholar]
- [6].Thurn L, Lindqvist PG, Jakobsson M, et al. Abnormally invasive placenta-prevalence, risk factors and antenatal suspicion: results from a large population-based pregnancy cohort study in the Nordic countries. BJOG 2016;123:1348–1355. [DOI] [PubMed] [Google Scholar]
- [7].Bowman ZS, Eller AG, Kennedy AM, et al. Accuracy of ultrasound for the prediction of placenta accreta. Am J Obstet Gynecol 2014;211:177 e1–7. [DOI] [PubMed] [Google Scholar]
- [8].D’Antonio F, Iacovella C, Bhide A. Prenatal identification of invasive placentation using ultrasound: systematic review and meta-analysis. Ultrasound Obstet Gynecol 2013;42:509–517. [DOI] [PubMed] [Google Scholar]
- [9].Alfirevic Z, Tang AW, Collins SL, Robson SC, Palacios-Jaraquemada J, Ad-hoc International AIP Expert Group. Pro forma for ultrasound reporting in suspected abnormally invasive placenta (AIP): an international consensus. Ultrasound Obstet Gynecol 2016;47:276–278. [DOI] [PubMed] [Google Scholar]
- [10].Collins SL, Ashcroft A, Braun T, et al. Proposal for standardized ultrasound descriptors of abnormally invasive placenta (AIP). Ultrasound Obstet Gynecol 2016;47:271–275. [DOI] [PubMed] [Google Scholar]
- [11].Jauniaux E, Collins SL, Jurkovic D, Burton GJ. Accreta placentation. A systematic review of prenatal ultrasound imaging and grading of villous invasiveness. Am J Obstet Gynecol 2016;215:712–721. [DOI] [PubMed] [Google Scholar]
- [12].Jauniaux E, Collins SL, Burton GJ. The placenta accreta spectrum: Pathophysiology and evidence-based anatomy for prenatal ultrasound imaging. Am J Obstet Gynecol 2017;217:S0002–9378(17)30731–30377 [DOI] [PubMed] [Google Scholar]
- [13].Collins SL, Stevenson GN, Al-Khan A, et al. Three-Dimensional Power Doppler Ultrasonography for Diagnosing Abnormally Invasive Placenta and Quantifying the Risk. Obstet Gynecol 2015;126:645–653. [DOI] [PMC free article] [PubMed] [Google Scholar]
- [14].Schaaps JP, Tsatsaris V, Goffin F, et al. Shunting the intervillous space: new concepts in human uteroplacental vascularization. Am J Obstet Gynecol 2005;192:323–332. [DOI] [PubMed] [Google Scholar]
- [15].Tantbirojn P, Crum CP, Parast MM. Pathophysiology of placenta creta: the role of decidua and extravillous trophoblast. Placenta 2008;29:639–645. [DOI] [PubMed] [Google Scholar]
Associated Data
This section collects any data citations, data availability statements, or supplementary materials included in this article.
Supplementary Materials
Figure S1 Line graph of log(Acon) values for underfilled and then filled bladder for (A) each patient with PAS disorder and (B) each non-PAS control. Abbreviation: Acon, abnormal confluence; PAS, placenta accreta spectrum.
Table S1 Mean bladder volume and log(Acon) value for the study women by diagnosis. Abbreviation: Acon, abnormal confluence.