Abstract
Motivation
Flow cytometry and mass cytometry are widely used to diagnose diseases and to predict clinical outcomes. When associating clinical features with cytometry data, traditional analysis methods require cell gating as an intermediate step, leading to information loss and susceptibility to batch effects. Here, we wish to explore an alternative approach that predicts clinical features from cytometry data without the cell-gating step. We also wish to test if such a gating-free approach increases the accuracy and robustness of the prediction.
Results
We propose a novel strategy (CytoDx) to predict clinical outcomes using cytometry data without cell gating. Applying CytoDx on real-world datasets allow us to predict multiple types of clinical features. In particular, CytoDx is able to predict the response to influenza vaccine using highly heterogeneous datasets, demonstrating that it is not only accurate but also robust to batch effects and cytometry platforms.
Availability and implementation
CytoDx is available as an R package on Bioconductor (bioconductor.org/packages/CytoDx). Data and scripts for reproducing the results are available on bitbucket.org/zichenghu_ucsf/cytodx_study_code/downloads.
Supplementary information
Supplementary data are available at Bioinformatics online.
1 Introduction
The development of cytometry technologies, including flow cytometry and mass cytometry (CyTOF), allows researchers to characterize cell mixtures at the single cell resolution with up to 45 markers. Multi-dimensional cytometry data contains rich information that can be used to diagnose a variety of diseases, such as leukemia (Rawstron et al., 2018), allergy (Ocmant et al., 2007) and infectious diseases (Farias et al., 2014). In addition, cytometry can be used to predict other clinical outcomes, such as the response to vaccination (Hoshina et al., 2016) and to cancer immune-therapies (Martens et al., 2016; Rodriguez et al., 2016).
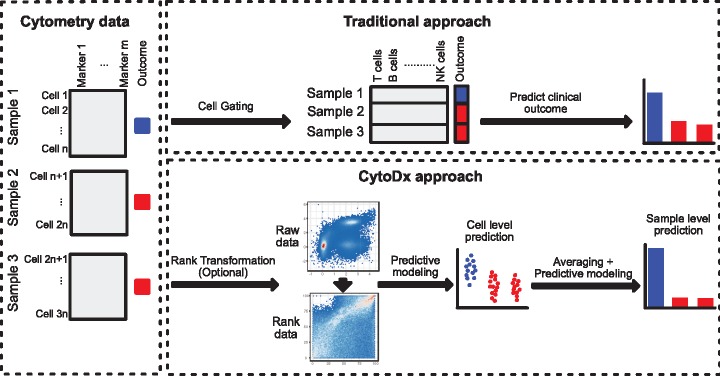
The analysis of cytometry data typically starts with identifying cell populations by manual gating. The abundance of one or several cell populations is then used to predict clinical outcome of interest. For example, the abundance of PD-1 positive CD8+ T cells in the tumor can be used to predict responsiveness to anti-PD-1 immunotherapy (Rodriguez et al., 2016). Several computational methods, such as CITRUS, MetaCyto and FloReMi (Bruggner et al., 2014; Hu et al., 2018; Van Gassen et al., 2016) have been developed to automate the gating-based strategy. Cell subsets are first identified from the flow cytometry data using a clustering algorithm. The summary statistics of the identified cell subsets, including abundance and mean marker expression levels, are concatenated into a vector that is used to build a model for predicting clinical outcome. In such process, each cytometry data matrix, which characterizes the level of m markers in n cells (Fig. 1, Cytometry data panel), is reduced into a vector (Fig. 1, traditional approach panel). Such matrix-to-vector reduction can lead to information loss. In addition, this analysis strategy requires each cytometry sample to be clustered in exactly the same way, making it sensitive to batch effects. Given that batch effects are widely present in both clinical and research settings, a more robust method is needed to integrate cytometry data from different experiments.
Fig. 1.
Schematic diagrams showing the traditional gating-based approach and the proposed CytoDx approach. CytoDx first estimates the association between each single cell and the clinical outcome using a regularized generalized linear model. The cell level associations are then averaged within samples to serve as sample level predictors. The clinical outcome for each cytometry sample is then predicted using a second regression model
To address the aforementioned shortcomings of gating-based approach, we propose a new strategy named CytoDx that directly uses the cytometry data at the single cell level to predict clinical outcome. The CytoDx first estimates the association between each single cell and the clinical outcome. The cell level associations are then averaged within samples to serve as predictors for the clinical outcome. Using publically available datasets that are generated from different institutes by different cytometry platforms (flow cytometry and CyTOF), we demonstrate that CytoDx is able to robustly predict clinical features even in the presence of batch effects. We also demonstrate how CytoDx could be used to integrate heterogeneous cytometry datasets in order to identify cells that are associated with the clinical feature of interest.
2 Materials and methods
2.1 Mathematical description of the CytoDx approach
Let denote a -by- matrix where is the number of cells and is the number of markers. represents the cytometry data of -th sample in the training data. Let denote the total number of samples in the training set. Let denote the -th row of . Here, each represents a cell in sample. Let denote the clinical outcome associated with the -th sample. Let denote the vector of weights in the cell level generalized linear model. Let denote the link function specific to the regression type, such as the logistic function for logistic regression. is identified by maximizing the regularized sum of log likelihoods:
where is the regularization strength. The quantity is the expected association between each cell and the clinical outcome. Let denote the average of the cell level association in sample :
Here, is the predictor at the sample level. Let denote the weight in the sample level generalized linear model. is identified by maximizing the sum of log likelihoods
The quantity is the expected clinical outcome.
Let be a -by- cytometry data matrix with unknown clinical outcome and to be the -th row of. The predicted for is
2.2 Predicting the onset of AIDS in HIV carriers
The HIV dataset from FlowCAP IV competition was downloaded from flowrepository.org under repository ID: FR-FCM-ZZ99. We divided the cytometry data into training and testing set according to the description in the original competition. The cytometry data in both training and testing set were compensated using the supplied compensation matrix and transformed using the formula f(x) = arcsinh (x/150). We removed the dead cells and debris by removing cells whose VIVID is greater than 25 000 or FCS-A is smaller than 25 000.
We randomly sampled 20 000 cells from each fcs file in both training and test set. We added an additional variable to the matrix to indicate if the cells have been stimulated by HIV antigens in vitro. We trained a CytoDx Cox regression model using the training data. The model was then used to predict the survival time (time between blood collection and the development of AIDS) for each sample in the test data.
To assess the performance, we used the original evaluation source code from the FlowCAP IV competition (Aghaeepour et al., 2016). Briefly, we fit a Cox regression using our predictor as the independent variable and the survival time of patients in the testing set as the dependent variable. We then used a log-rank test to test if our prediction was significantly associated with the survival time. We downloaded the results of the original nine submissions in the competition and evaluated them using the same code.
2.3 Detecting the latent cytomegalovirus infection
We downloaded CyTOF data and cytomegalovirus (CMV) specific antibody titer data from SDY478 in the ImmPort database (Bhattacharya et al., 2014). Individuals with CMV specific antibody titer greater than 1 were considered CMV positive. We randomly assigned the 69 samples into a 50-sample training group and a 19-sample testing group. Using CyTOF data and CMV status in the training group, we trained 100 CytoDx models by applying different regularization strength (λ) in the lasso model. We performed 5-fold cross-validation to select the optimal model. We applied the optimal model to the test set to evaluate the performance. We used the area under the receiver operator curve (AUC) to quantify performance.
2.4 Pre-processing of HAI titer
We downloaded hemagglutination inhibition (HAI) titer data from SDY112 and SDY404 studies in ImmPort database (Bhattacharya et al., 2014; Furman et al., 2017; Thakar et al., 2015). In both studies, the antibody titers against three strains of influenza virus were measured by HAI assays before vaccination and 28 days after vaccination. We first log transformed the HAI titer to make the data normally distributed. We then averaged the log titers against three strains of influenza virus for each individual to represent the overall titer.
Because the HAI assays were performed independently in two institutions, the antibody titers are different between the two studies. To adjust for this difference, we divided the titers into high titer group and low titer group independently in each study. Titers greater or lower than the median titer in each study are classified as high and low titers.
In previous studies, HAI titers in day 28 were adjusted by the titer before vaccination to represent the titer change (HIPC-CHI Signatures Project Team and HIPC-I Consortium, 2017; Tsang et al., 2014). In this study, we used the un-adjusted titer at day 28. The protection against influenza is determined by the absolute amount of anti-influenza antibody after vaccine rather than the relative change of anti-influenza antibody induced by the vaccine. Therefore, predicting antibody titer at day 28 is more meaningful in the clinic. In addition, we did not include the pre-vaccine titer in our predictive model. Therefore, the post-vaccine titers were not confounded by pre-vaccine titers and did not need to be adjusted in this case.
2.5 Rank transformation of cytometry data
We replaced each element in a cytometry data matrix by its rank relative to other elements in the same column. Percentile rank was calculated by dividing the rank by the number of cells (rows) in the matrix and multiplying by 100.
2.6 Predicting HAI titer using cytometry data
CyTOF and flow cytometry data were downloaded from SDY112 and SDY404 (Bhattacharya et al., 2014; Furman et al., 2017; Thakar et al., 2015) from ImmPort database (Bhattacharya et al., 2018). We used the CyTOF data in SDY112 as a training dataset and the flow cytometry data in SDY404 as a testing dataset. We randomly sampled 5000 cells from each fcs file in both training and testing sets. We ranked transformed the data using the pRank function contained within CytoDx package. Five T cell surface markers (CD4, CCR7, CD3, CD45RA and HLADR) were shared between the flow cytometry data and CyTOF data, and were used for predicting HAI titer. Using CytoDx, we trained logistic regression model using the training data. To capture the relationship between markers, we also included pairwise interactions in the model. The trained model was then applied to the testing data to predict HAI titer.
2.7 Finding cell populations using decision trees
We calculated the association between each cell and the clinical outcome using the cell level predictive model in CytoDx. We built a decision tree using the cell surface markers as independent variables and the calculated association as the dependent variable. The decision tree groups the cell with similar association with the clinical outcome together through a series of marker bisection steps. The group with the highest average association with the clinical outcome is selected and is manually inspected by gating the data based on the bisection rules from the decision tree. The decision tree is built using the rpart function in the “rpart” R package.
3 Results
3.1 Summary of CytoDx
The CytoDx workflow can be divided into three stages: the optional data transformation, the cell level prediction and the sample level prediction.
Data transformation (Optional): Cytometry data of a sample are represented as a matrix, which characterizes the level of m markers in n cells. Traditionally, the raw data are transformed using either biexponential transformation or arcsinh transformation to facilitate the down-stream cell clustering or cell gating. The gating-free nature of CytoDx makes it highly flexible to different types of data transformation. For example, rank-transformed data are highly resistant to batch effects and are often used for meta-analysis of gene expression data (Dudley et al., 2009). However, this method’s use in cytometry data has not yet been explored, because such transformation heavily alters the shape of cell subsets, making cell gating difficult (Fig. 1, CytoDx approach panel). CytoDx bypasses the gating step therefore can be easily applied to rank-transformed data. We show that applying CytoDx on rank data allows robust prediction of clinical outcome across heterogeneous datasets.
Cell level prediction: Using the cell marker levels as the independent variables and the clinical outcome as dependent variables, the CytoDx then builds a regularized generalized linear model (Friedman et al., 2010) to predict the association between each single cell and the clinical outcome (Fig. 1, CytoDx approach panel, see the Methods section for a complete description). In some cases, the two-way or higher order interactions between cell markers can also be included as independent variables to capture the non-linear relationship between cell markers. The cell level predictions can be used for two different purposes. First, the average of the cell level associations within each sample serves as a predictor for clinical outcomes at the sample level. Second, the cell level prediction can be used to identify the cell subsets that are associated with the clinical outcome of interest.
Sample level prediction: The cell level associations are averaged within samples to serve as sample level predictors. CytoDx then use a second regression model to translate the average cell associations to interpretable predictions, such as the probability of disease or expected survival time (Fig. 1, CytoDx approach panel, see the Methods section for a complete description).
3.2 Illustrating CytoDx using simulated data
We illustrate CytoDx through visualization of a simple simulated dataset. Consider two cytometry samples, sample 1 from a healthy donor and sample 2 from a donor with a disease (Fig. 2A). A cell-level logistic model can estimate the association of each cell with the disease (Fig. 2B). The blue cells, which have higher abundance in the disease sample, are positively associated with the disease. Conversely, the red cells, which have lower abundance in the disease sample, are negatively associated with the disease. After averaging the cell level associations, we can use a second logistic model to predict the probability of disease at the sample level (Fig. 2C).
Fig. 2.
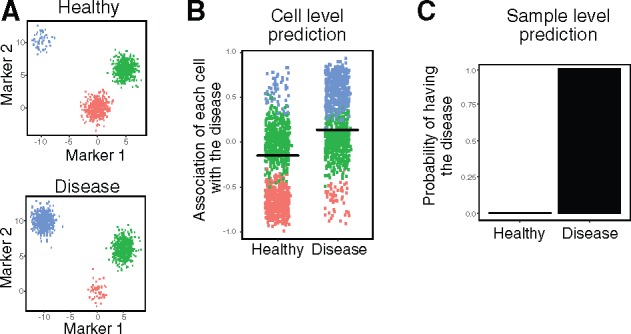
Illustrating CytoDx using simulated data. (A) Plots showing the simulated data, in which the number of blue cells increase, the number of red cells decrease and the number of green cell stay unchanged in the disease sample. (B) The association of each cell with the disease is estimated using a cell level logistic regression model in CytoDx. Black bars represent the mean association. (C) The probability of disease in each sample is estimated using a sample level logistic regression model in CytoDx (Color version of this figure is available at Bioinformatics online.)
3.3 Predicting the risk of AIDS in HIV carriers
To benchmark the predictive accuracy of CytoDx, we applied the method to the HIV dataset from FlowCAP IV competition (Aghaeepour et al., 2016). The training dataset contains flow cytometry data of peripheral blood from 191 HIV carriers. In addition, the time between the blood collection and AIDS diagnosis (‘survival time’) was recorded. The testing dataset contains flow cytometry data of peripheral blood from another set of 192 HIV carriers. In the original competition, all nine submissions used the traditional gating-based approaches. Only two out of nine methods were able to find a predictor that is significantly associated with the survival time in the test dataset. Using CytoDx approach, we were able to predict the survival time in the test dataset with higher significance (P = 0.00175) than other gating-based approaches (Fig. 3).
Fig. 3.
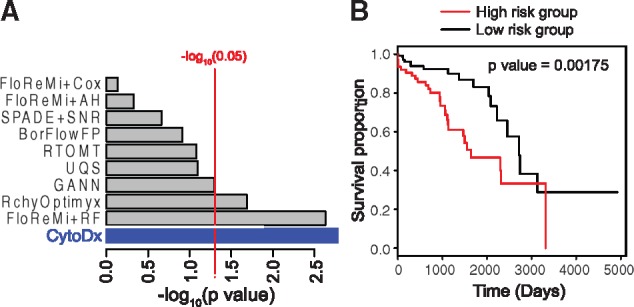
Benchmarking the performance of CytoDx. (A) A CytoDx cox regression was built to predict survival time of HIV carriers using training dataset from the FlowCAP IV competition. Prediction in testing set was evaluated by using the logrank test. Grey bars represent the submissions to the FlowCAP IV competition. Blue bar presents the result from CytoDx. (B) Kaplan–Meier plots for high- and low-risk HIV carriers according to CytoDx prediction (Color version of this figure is available at Bioinformatics online.)
3.4 Detecting latent cytomegalovirus infection
We then tested the performance of CytoDx using high-dimensional CyTOF data. We downloaded CyTOF data and cytomegalovirus-specific antibody titer data from SDY478 in the ImmPort database (Bhattacharya et al., 2014). The CyTOF data profiles the peripheral blood mononuclear cells (PBMC) of 69 individuals using 39 markers. The CMV antibody titer data were used as the gold standard for detecting CMV infection. We randomly assigned the 69 samples into a 50 sample training group and a 19 sample testing group. To prevent over-fitting, we performed feature selection using the lasso model in CytoDx (Fig. 4A). The final CytoDx model was applied to the testing group. We found that CytoDx was able to detect latent CMV infection accurately (AUC = 0.87, P value = 0.007) using high-dimensional CyTOF data (Fig. 4B).
Fig. 4.
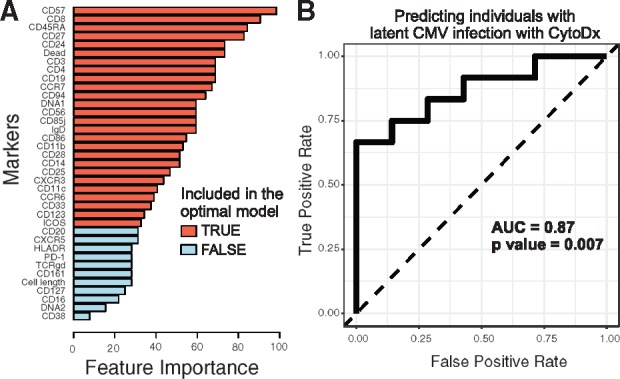
CytoDx detects latent CMV infection using high-dimensional CyTOF data. We used CytoDx to detect latent CMV infection using CyTOF samples from the ImmPort SDY478 dataset. (A) A bar graph showing the feature importance of each marker in detecting latent CMV infection. We scanned across a range of regularization strength (λ) to generate 100 candidate models. Cross-validation was used to select the optimal predictive model. Red bars represent markers included in the optimal model. For each marker, feature importance is estimated using the percent of candidate models that contain the marker. (B) We applied the optimal model on a test dataset of 19 samples. The performance is visualized by the receiver operator curve (ROC) and measured by area under the ROC curve (AUC). P values were calculated using Wilcoxon tests (Color version of this figure is available at Bioinformatics online.)
3.5 Predicting influenza vaccine response
It should be noted that the curated, high quality of the HIV data from FlowCAP IV competition is not representative of real-world settings. Cytometry data are often highly variable between labs or hospitals. Even data from the same lab may vary between experiments. Differences in sample preparation, reagents and cytometry platform all contribute to batch effects. To test CytoDx in the presence of batch effects, we applied CytoDx to two datasets generated from different institutes (Stanford and Yale) and by different cytometry platforms (CyTOF and flow cytometry).
In both datasets [SDY112 and SDY404 from the ImmPort Database (Bhattacharya et al., 2014; Furman et al., 2017; Thakar et al., 2015)], the PBMC were collected from individuals before influenza vaccination and were analyzed by either CyTOF or flow cytometry. The antibody titers were measured by hemagglutination inhibition (HAI) assays 28 days after vaccination. We hypothesized that the baseline PBMC status captured by cytometry data can be used to predict the anti-influenza titer post-vaccination.
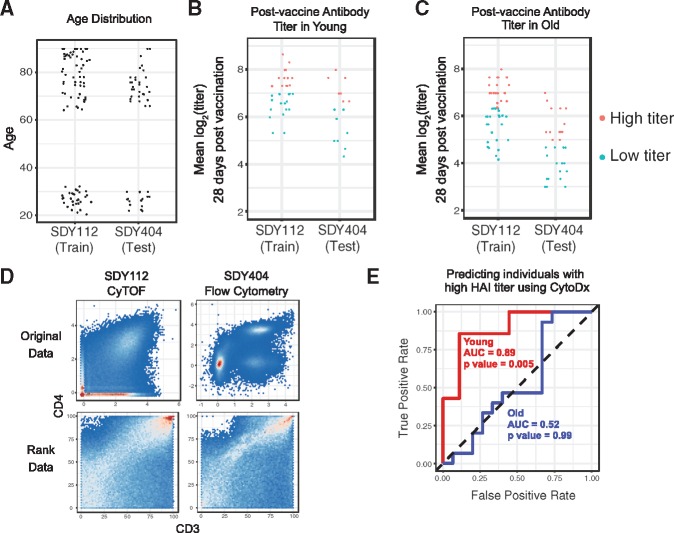
Because the cohorts in both studies have a bimodal age distribution (Fig. 5A), we divided the subjects into young (age < 35) and older (age > 60) groups and analyzed them separately. Because the HAI assays were performed independently in two institutions, the distributions of antibody titers are different between the two studies. To adjust for this difference, we divided the titers into high titer group and low titer group independently in each study (Fig. 5B and C).
Fig. 5.
The CytoDx approach is accurate and robust to batch effects. (A) The age distribution of subjects in SDY112 and SDY404. (B–C) The post-vaccine HAI titers in young and older individuals. Titers were log transformed to make the data normally distributed. The log titers against three strains of influenza virus were averaged for each individual to represent the overall titer. (D) The CD4 and CD3 profile in CyTOF data from SDY112 and flow cytometry data from SDY404. Data before and after rank transformation are presented. (E) A CytoDx logistic regression was trained using data from SDY112 and applied to test dataset from SDY404 to predict post vaccine HAI titer. The performance in the test dataset is visualized by the receiver operator curve (ROC) and measured by area under the ROC curve (AUC). P values were calculated using Wilcoxon tests
Five T cell surface markers (CD4, CCR7, CD3, CD45RA and HLADR) are present in both the flow cytometry data and CyTOF data. Since the cytometry data are generated using different platforms, they are distinct between studies (Fig. 5D). To adjust for such differences, we applied rank transformation to both datasets. Although the transformation largely removed the batch effects, it drastically alters the shape of cell subsets, making cell gating difficult (Fig. 5D). However, since CytoDx bypassed the gating step, it can be easily applied to the rank data.
We first applied CytoDx to the young group. After training the CytoDx model using training data from SDY112, we applied the model to the testing from SDY404. The CytoDx model was able to accurately predict the vaccine titer 28 days after vaccination (Fig. 5E, AUC = 0.89, P value = 0.005).
We also applied CytoDx to the older group but were unable to predict antibody titer in these individuals (Fig. 5E, AUC = 0.52, P value = 0.99). The result is consistent with a previous study from Human Immunology Project Consortium (HIPC), which showed that baseline global gene expression profiles can be used to predict vaccine response in young individuals, but not in older individuals (HIPC-CHI Signatures Project Team and HIPC-I Consortium, 2017). We discuss the low prediction accuracy in older people in the discussion section.
We obtained similar results when using CytoDx to predict the post-vaccine HAI titer as a continuous response variable. The predicted titers were highly correlated with the observed titers in young individuals (correlation = 0.77, P value = 0.0005, Supplementary Fig. S1A), but not in older individuals (correlation = 0.08, P value = 0.67).
Two recently published methods, cydar (Lun et al., 2017) and CellCnn (Arvaniti and Claassen, 2017), have been proposed to detect small cell populations that are different between conditions within the same experiment. Both methods were able to analyze cytometry data without explicit cell gating, therefore can potentially be applied on rank data as well. We applied both methods on the rank data from SDY112 and SDY404, but were unable to predict HAI titer in young people, suggesting that they are not compatible with rank transformation (Supplementary Fig. S2).
3.6 Identifying cell populations associated with strong vaccine response
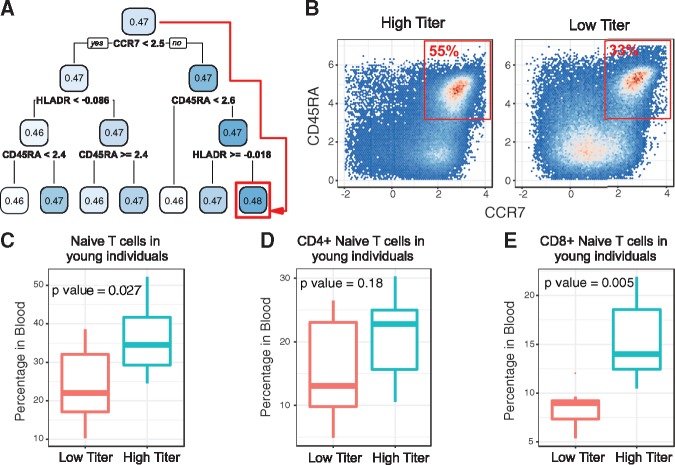
In addition to predicting the antibody titer at the individual level, CytoDx model can also be used to predict each cell’s association with antibody titer. Such information can be used to identify cell subsets associated with vaccine titer. We applied a decision tree method to identify the cell subset that has the highest association with antibody titer (Fig. 6A). Interestingly, the decision tree identified a CCR7+ CD45RA+ HLADR- cell subset. Manual inspection showed that the subset is also CD3+, indicating that the subset corresponds to naïve T cells.
Fig. 6.
CytoDx identifies cell populations associated with high vaccine response. (A) A decision tree identifies the cells associated with the HAI titer in young individuals. The number in each box represents the average association between the cell group and HAI titer. The splitting rule underneath each box divides the parent population into two sub-groups. Red square shows the cell group with the highest association with HAI titer. (B) 2 dimensional plots showing the percent of CCR7+ CD45RA+ naive T cells within total T cells from individuals with low or high HAI titer in the test dataset. (C-E) Boxplots showing the percent of total Naive T cells (C), CD4+ Naive T cells (D) and CD8+ Naive T cells (E) in young individuals with high or low HAI titer. Naive T cells are defined as CD3+ CCR7+ CD45RA+ and HLADR−. P values were calculated using two sided, unpaired t-tests
To confirm the result from the decision tree, we quantified the percentage of naïve T cell in blood. We found that the percentage of naïve T cells is significantly elevated in high titer group (Fig. 6B and C). We further divided the population into CD4+ and CD8+ naïve T cells and found that both subsets were elevated in the high titer group (Fig. 6D and E). Among them, CD8+ naïve T cells have the most significant increase (P = 0.005). The result suggests that the availability of naïve T cells, which can respond to new antigens, is critical in determining the response against influenza vaccine in young individuals.
4 Discussion
In this study, we proposed a gating free strategy (CytoDx) for predicting clinical outcomes using cytometry data. The cytometry data matrix can be directly used to train a statistical model for clinical outcome prediction. The gating-free approach has two main advantages. First, it avoids the information loss in the gating step because it uses the original cytometry matrix as input instead of using the summary statistics from cell gating. Second, it is flexible to data transformations. We demonstrated that applying CytoDx on rank-transformed data allows robust prediction of clinical outcome across heterogeneous datasets.
Using CytoDx, we were able to predict vaccine response in young individuals. However, CytoDx fails to predict the vaccine response in older individuals. The low prediction accuracy may be due to multiple reasons. First, naïve T cells, which are highly associated with antibody titer in young individuals, are diminished in older individuals (Carr et al., 2016; Douek et al., 1998). Second, it is known that the immune cells are more heterogeneous in older people due to age-related diseases and more antigen encounters throughout life (Brodin et al., 2015). Our result is consistent with a previous study from Human Immunology Project Consortium (HIPC), which showed that baseline global gene expression profiles can be used to predict vaccine response in young individuals, but not in older individuals (HIPC-CHI Signatures Project Team and HIPC-I Consortium, 2017), suggesting that molecular profiling of PBMC does not provide enough information to predict the vaccine response in older people. Detailed medical history may be needed to explain the variance in immune cells.
Previous publications have identified a dependency between pre-vaccine HAI titer and the vaccine response (HIPC-CHI Signatures Project Team and HIPC-I Consortium, 2017; Tsang et al., 2014). To adjust for the dependency between pre-vaccine titer and vaccine response, the data were binned based on pre-vaccine titer and scaled within each bin to remove the correlation between vaccine response and pre-vaccine titer. The adjusted response was called Adjusted Maximum Fold Change (adjMFC). Although the adjustment removes the dependency with pre-vaccine titer, the association between adjMFC and the protection against influenza has not been demonstrated. For this analysis, we chose to predict the un-adjusted post-vaccine titer instead as the correlation between absolute titer and virus protection has been demonstrated by multiple studies (Black et al., 2011; Wei et al., 2018). Given that the final protection level is the outcome of interest, predicting the post-vaccine response is more clinically relevant.
In both research and clinical settings, cytometry data are often highly variable between labs or hospitals. Differences in sample preparation, reagents and cytometry platform all contribute to batch effects, making it difficult to jointly analyze cytometry datasets. Rank transformation was able to alleviate the batch effect by removing the batch specific shape of the cell populations, but preserving the relative order of cells in each dimension. Applying CytoDx to ranked data allows robust prediction of clinical featured using data from different sources. In addition, leveraging the cell level prediction from CytoDx, researchers can identify the cell subsets that are associated with the phenotype of interest.
It should be noted that several types of batch effects cannot be removed using rank transformation alone. First, fluorescent spillovers will alter the relative orders of cells in each marker dimension. Therefore, if a cytometry dataset is not properly compensated, batch effects will persist after rank transformation. Second, the presence of highly auto-fluorescent particles, such as cell debris or dead cells, will shift the rank of cells in each marker dimension, leading to batch effects that cannot be removed by rank transformation. To overcome these problems, it is essential to combine rank transformation with other pre-processing steps, including signal compensation and debris removal.
A key step in CytoDx is predicting the association between each cell and the clinical feature of interest. In principle, any type of predictive models can be used in this step, such as neural network and decision tree. We choose to use the regularized generalized linear regression (LASSO or ridge regression) for several reasons. First, the linear method is less prone to overfitting, making it more robust when predicting clinical features. Second, the linear methods are computationally advantageous when making predictions for a large number of cells. It takes less than 30 seconds to train a CytoDx model using a dataset containing 24 million cells on a laptop. Finally, LASSO regression automatically performs variable selection, allowing researchers to identify markers that are most relevant for predicting clinical outcomes. We expect this advantage to be more prominent when applying CytoDx to other types of single cell data, such as single cell RNA sequencing data, where thousands of transcripts are included as variables.
Supplementary Material
Acknowledgements
We would like to thank Nima Aghaeepour and Ryan R. Brinkman for sharing the HIV data from FlowCAP IV competition. We would like to thank Mark Davis and David Hafler for sharing influenza vaccine data on ImmPort database. We would like to thank Dvir Aran for helpful discussion.
Funding
Research reported in this publication was supported by the National Institute of Allergy and Infectious Diseases (Bioinformatics Support Contract HHSN272201200028C). The content is solely the responsibility of the authors and does not necessarily represent the official views of the National Institutes of Health.
Conflict of Interest: none declared.
References
- Aghaeepour N. et al. (2016) A benchmark for evaluation of algorithms for identification of cellular correlates of clinical outcomes. Cytometry A, 89, 16–21. [DOI] [PMC free article] [PubMed] [Google Scholar]
- Arvaniti E., Claassen M. (2017) Sensitive detection of rare disease-associated cell subsets via representation learning. Nat. Commun., 8, 14825.. [DOI] [PMC free article] [PubMed] [Google Scholar]
- Bhattacharya S. et al. (2018) ImmPort, toward repurposing of open access immunological assay data for translational and clinical research, Sci. Data, 5, 180015. [DOI] [PMC free article] [PubMed] [Google Scholar]
- Bhattacharya S. et al. (2014) ImmPort: disseminating data to the public for the future of immunology. Immunol. Res., 58, 234–239. [DOI] [PubMed] [Google Scholar]
- Black S. et al. (2011) Hemagglutination inhibition antibody titers as a correlate of protection for inactivated influenza vaccines in children. Pediatr. Infect. Dis. J., 30, 1081–1085. [DOI] [PubMed] [Google Scholar]
- Brodin P. et al. (2015) Variation in the human immune system is largely driven by non-heritable influences. Cell, 160, 37–47. [DOI] [PMC free article] [PubMed] [Google Scholar]
- Bruggner R.V. et al. (2014) Automated identification of stratifying signatures in cellular subpopulations. Proc. Natl. Acad. Sci., 111, E2770–E2777. [DOI] [PMC free article] [PubMed] [Google Scholar]
- Carr E.J. et al. (2016) The cellular composition of the human immune system is shaped by age and cohabitation. Nat. Immunol., 17, 461–468. [DOI] [PMC free article] [PubMed] [Google Scholar]
- Douek D.C. et al. (1998) Changes in thymic function with age and during the treatment of HIV infection. Nature, 396, 690–695. [DOI] [PubMed] [Google Scholar]
- Dudley J.T. et al. (2009) Disease signatures are robust across tissues and experiments. Mol. Syst. Biol., 5, 307.. [DOI] [PMC free article] [PubMed] [Google Scholar]
- Farias M.G. et al. (2014) Neutrophil CD64 expression as an important diagnostic marker of infection and sepsis in hospital patients. J. Immunol. Methods, 414, 65–68. [DOI] [PubMed] [Google Scholar]
- Friedman J. et al. (2010) Regularization paths for generalized linear models via coordinate descent. J. Stat. Softw., 33, 1–22. [PMC free article] [PubMed] [Google Scholar]
- Furman D. et al. (2017) Expression of specific inflammasome gene modules stratifies older individuals into two extreme clinical and immunological states. Nat. Med., 23, 174–184. [DOI] [PMC free article] [PubMed] [Google Scholar]
- Van Gassen S. et al. (2016) FloReMi: flow density survival regression using minimal feature redundancy. Cytometry A, 89, 22–29. [DOI] [PubMed] [Google Scholar]
- HIPC-CHI Signatures Project Team, H.-C.S.P. and HIPC-I Consortium, H.-I. (2017) Multicohort analysis reveals baseline transcriptional predictors of influenza vaccination responses. Sci. Immunol., 2, eaal4656.. [DOI] [PMC free article] [PubMed] [Google Scholar]
- Hoshina T. et al. (2016) Memory b-cell pools predict the immune response to pneumococcal conjugate vaccine in immunocompromised children. J. Infect. Dis., 213, 848–855. [DOI] [PubMed] [Google Scholar]
- Hu Z. et al. (2018) MetaCyto: a tool for automated meta-analysis of mass and flow cytometry data. Cell Rep., 24, 1377–1388. [DOI] [PMC free article] [PubMed] [Google Scholar]
- Lun A.T.L. et al. (2017) Testing for differential abundance in mass cytometry data. Nat. Methods, 14, 707–709. [DOI] [PMC free article] [PubMed] [Google Scholar]
- Martens A. et al. (2016) Baseline peripheral blood biomarkers associated with clinical outcome of advanced melanoma patients treated with ipilimumab. Clin. Cancer Res., 22, 2908–2918. [DOI] [PMC free article] [PubMed] [Google Scholar]
- Ocmant A. et al. (2007) Flow cytometry for basophil activation markers: the measurement of CD203c up-regulation is as reliable as CD63 expression in the diagnosis of cat allergy. J. Immunol. Methods, 320, 40–48. [DOI] [PubMed] [Google Scholar]
- Rawstron A.C. et al. (2018) Reproducible diagnosis of chronic lymphocytic leukemia by flow cytometry: an European Research Initiative on CLL (ERIC) & European Society for Clinical Cell Analysis (ESCCA) Harmonisation project. Cytom. B Clin. Cytom., 94, 121–128. [DOI] [PMC free article] [PubMed] [Google Scholar]
- Rodriguez R.S. et al. (2016) Tumor immune profiling predicts response to anti–PD-1 therapy in human melanoma. J Clin Invest, 124, 1027–1036. [DOI] [PMC free article] [PubMed] [Google Scholar]
- Thakar J. et al. (2015) Aging-dependent alterations in gene expression and a mitochondrial signature of responsiveness to human influenza vaccination. Aging, 7, 38–52. [DOI] [PMC free article] [PubMed] [Google Scholar]
- Tsang J.S. et al. (2014) Global analyses of human immune variation reveal baseline predictors of postvaccination responses. Cell, 157, 499–513. [DOI] [PMC free article] [PubMed] [Google Scholar]
- Wei V.W.I. et al. (2018) Incidence of influenza A(H3N2) virus infections in Hong Kong in a longitudinal sero-epidemiological study, 2009–2015. PLoS One, 13, e0197504. [DOI] [PMC free article] [PubMed] [Google Scholar]
Associated Data
This section collects any data citations, data availability statements, or supplementary materials included in this article.


