

Abstract
Objectives
Immune-checkpoint blockades have exhibited durable responses and improved long-term survival in a subset of advanced non-small-cell lung cancer (NSCLC) patients. However, highly predictive markers of positive and negative responses to immunotherapy are a significant unmet clinical need. The objective of this study was to identify clinical and computational image-based predictors of rapid disease progression phenotypes in NSCLC patients treated with immune-checkpoint blockades.
Materials and Methods
Using time-to-progression (TTP) and/or tumor growth rates, rapid disease progression phenotypes were developed including hyperprogressive disease. The pre-treatment baseline predictors that were used to identify these phenotypes included patient demographics, clinical data, driver mutations, hematology data, and computational image-based features (radiomics) that were extracted from pre-treatment computed tomography scans. Synthetic Minority Oversampling Technique (SMOTE) was used to subsample minority groups to eliminate classification bias. Patient-level probabilities were calculated from final clinical-radiomic models to subgroup patients by progression-free survival (PFS).
Results
Among 228 NSCLC patients treated with single agent or double agent immunotherapy, we identified parsimonious clinical-radiomic models with modest to high ability to predict progression phenotypes with area under the receiver-operator characteristics ranging from 0.812 to 0.843. Patients who experienced TTP < 2 months or hyperprogressive disease were classified with 73.4% and 82.3% accuracy after SMOTE subsampling, respectively. When the patient subgroups based on patient-level probabilities were analyzed for survival outcomes, patients with higher probability scores had significantly worse PFS.
Conclusions
The models found in this study have potential important translational implications to identify highly vulnerable NSCLC patients treated with immunotherapy that experience rapid disease progression and survival poor outcomes.
Keywords: Immunotherapy, Hyperprogressive Disease, Radiomics, NSCLC
Introduction
Immune-checkpoint blockades targeting programmed death-1 (PD-1) or programmed death ligand-1 (PD-L1) provide durable responses and improved long-term survival in advanced non-small-cell lung cancer (NSCLC) patients [1–6]. However, overall response rates are only about 20 to 50% and those that do not respond can experience accelerated and lethal progression described as hyperprogressive disease (HPD) [7, 8]. Though PDL1 immunohistochemistry (IHC) is a widely applied biomarker to select patients for immunotherapy, PD-L1 expression alone is not adequate to predict response [9, 10]. Recently, a clinical trial demonstrated that immunotherapy combined with chemotherapy exhibits survival benefit regardless of PD-L1 expression [6]. Hence, additional biomarkers that are highly predictive of positive and negative responses to immune-checkpoint blockades are a significant unmet clinical need.
In this early report, we utilized clinical data and computed tomography (CT) scans of NSCLC patients treated on immunotherapy clinical trials to develop parsimonious identifying patients that are at risk of rapid disease progression. From the CT scans, we extracted image-based feature (radiomics) data to capture peritumoral and intratumoral heterogeneity reflecting the underlying pathophysiology of the regions of interest (ROI) [11–13] that included the lung lesion and surrounding border region of the lung lesion (Fig. 1a). The rapid disease progression phenotypes that were analyzed were based on time-to-progression (TTP) and tumor growth rates (TGR).
Fig 1A. The Radiomics Pipeline.
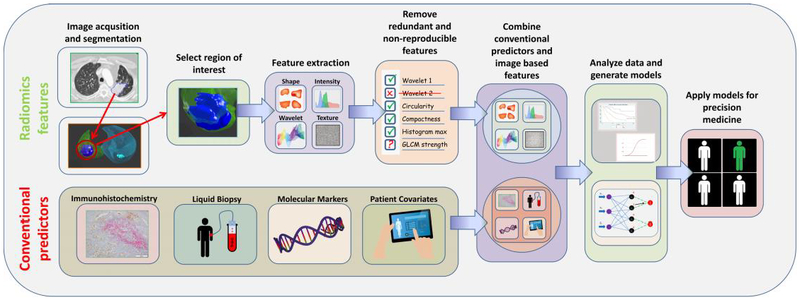
Using standard-of-care imaging studies, tumor(s) are segmented by an automatic or semi-automatic algorithm and approved by a radiologist. Radiomic features are computationally extracted from ROIs within and around tumor. Radiomic image features that are redundant and non-reproducible features are eliminated, and a final set of features are combined with clinical data and conventional biomarkers (e.g., immunohistochemistry, liquid biopsies, and molecular markers). The data are analyzed and modeled to identify the most informative data elements that can used to improve decision support for diagnosis, risk prediction, prognostication, or treatment response.
Materials and Methods
Study population and patient data
Based on patient eligibility (Supplementary Fig. 1), we analyzed 228 NSCLC patients that were prospectively enrolled into industry-sponsored clinical trials using PD-1 single agent (Nivolumab, Pembrolizumab), PD-L1 single agent (Durvalumab, Atezolizumab), or the combination of PD-L1 or PD-L1 with cytotoxic T-lymphocyte-associated protein 4 (Ipilimumab, Tremelimumab) as a second agent. All patients were treated between June 2011 and June 2016 at the Moffitt Cancer Center, Tampa, Florida. Patient data were obtained from Moffitt’s Cancer Registry, Moffitt’s Collaborative Data Services Core, and through manual abstraction from electronic medical records. Details of the study population and data elements are provided in the Supplemental Methods.
CT tumor segmentation and radiomic feature extraction
Pre-treatment contrast-enhanced thoracic CT scans performed ≤ 30 days prior to the initiation of immunotherapy were utilized to extract radiomic features. From the largest target lung lesion, 600 radiomic features were extracted from both the tumor and tumor border regions (Supplementary Fig. 2).
Rapid disease progression phenotypes
Two rapid disease progression phenotypes were generated as dependent variables (Fig. 1b):
Patients who had a TTP < 2 months versus the patients who had a TTP ≥ 2 months;
Patients who had a HPD versus patients without a HPD (non-HPD);
HPD patients were a subset of progressive disease (PD) patients that exhibited accelerated TGR in less than 2 months (Fig. 1c) and were defined based on a stringent set of criteria adapted from prior studies [7, 14, 15]:
Greater than a two-fold increase from TGRpre-treatment to TGRtreatment, and
PD on first follow-up scan by RECIST (RECIST 1.1 or iRECIST) criteria, and
Time-to-treatment failure (TTF) < 2 months.
Fig 1B. Response groups of immunotherapy patients.
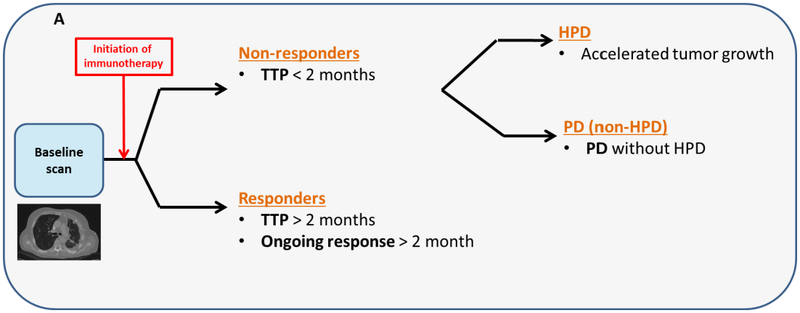
The non-responders were defined as patients who developed PD in less than 2 months (time-to-progression < 2 months). Patients who discontinued treatment and had an accelerated tumor growth were defined as HPD. The PD without HPD patients had PD on first follow-up and did not meet the HPD criteria. Responder patients were ones who developed had an ongoing response (PR/CR or SD) or developed PD at least 2 months after the initiation of therapy (TTP ≥ 2 months).
Fig 1C.
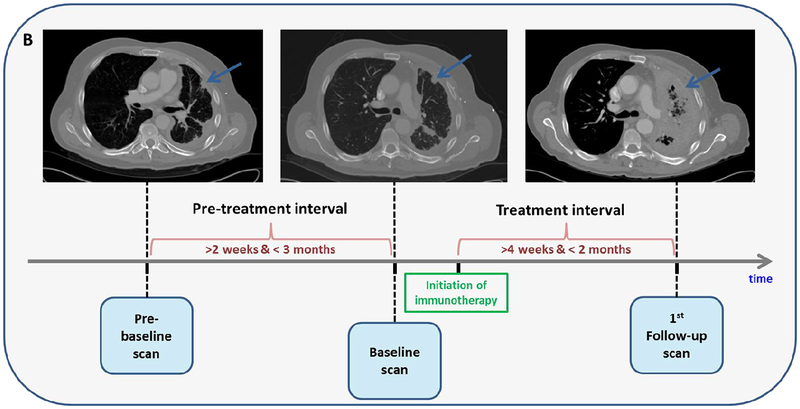
Example of an HPD patient that had SD prior to the initiation of immunotherapy but developed rapid tumor growth on first follow-up and experienced more than 2-fold increase from pre-treatment tumor growth versus treatment.
Statistical Analyses
All statistical analyses were performed using Stata/MP 14.2 (StataCorp LP, College Station, Texas) and R Project for Statistical Computing version 3.4.3 (http://www.r-project.org/). Differences for the clinical covariates were tested using Fisher’s exact test for categorical variables and the Mann-Whitney’s rank sum test and analysis of variance test for continuous variables. Survival analyses were performed using Kaplan-Meier curves, and the log-rank tests. For the radiomics data, non-reproducible features were eliminated using test/re-test scans from the Reference Image Database to Evaluate Therapy Response (RIDER) dataset [16].
Using logistic regression, a covariate reduction model building approach was employed to identify the most informative clinical covariates and radiomic features to predict outcomes for each rapid disease progression phenotype. Performance statistics were quantified using area under the receiver-operator characteristic (AUROC) and accuracy and used to compare the predictive performance of the various models. Patient-level probability for disease progression of final clinical-radiomic models were calculated and used to subgroup patients to assess progression-free-survival (PFS) and the individual probability for each patient were identified using novel cut-points found using Classification and Regression Tree (CART). Synthetic Minority Over-sampling Technique (SMOTE) was used to overcome classification bias in favor of the majority class [17]. Further details are included in Supplemental Methods.
Results
Patient characteristics comparing TTP < 2 months vs TTP ≥ 2 months and HPD vs non-HPD are provided in Supplementary Table 1. Supplementary Table 2 presents the full and parsimonious multivariable models for the clinical covariates. For the analysis of TTP < 2 months versus TTP ≥ 2 months, the full clinical model included eight clinical covariates with an AUROC of 0.770, whereas the parsimonious clinical model included four covariates with an AUROC 0.736. In multivariable analysis for HPD versus non-HPD, the full model included two clinical covariates with an AUROC of 0.783 whereas the parsimonious clinical model with one variable feature yielded an AUROC 0.712.
Four hundred and nine features were found to be reproducible (concordance correlation coefficient ≥ 0.80). The reproducible features that were found to be marginally significant (p < 0.10) on univariable analysis (Supplementary Table 3) were then considered for inclusion in the multivariable analyses. In multivariable analysis the parsimonious radiomics model with only four features yielded an AUROC of 0.717 (Supplementary Fig. 3). In multivariable analysis for HPD versus non-HPD, the parsimonious radiomics model with only one feature yielded an AUROC 0.674 (Supplementary Fig. 3).
The parsimonious models for the clinical covariates and radiomic features were combined into a final clinical-radiomic model (Supplementary Fig. 3). The final clinical-radiomic TTP < 2 months vs TTP ≥ 2 months model yielded an AUROC of 0.804 (Supplementary Fig. 3) with 83.4% specificity, 63.4% sensitivity and 73.4% accuracy after SMOTE subsampling and optimal cut-point approach (Table 1). The final clinical-radiomic HPD vs. non-HPD model yielded an AUROC score 0.865 (Supplementary Fig. 3) with 92.9% specificity 74.0% sensitivity and 82.3% accuracy after SMOTE subsampling (Table 1).
Table 1.
Performance statistics from the combined multivariable models and SMOTE subsampled multivariable models
| TTP < 2 months vs TTP ≥ 2 months1 | HPD vs non-HPD2 | |||
|---|---|---|---|---|
| Performance statistics cut points | Combined model without SMOTE | Combined model with SMOTE | Combined model without SMOTE | Combined model with SMOTE |
| 50% cut-point | ||||
| Area under ROC curve (95% CI) | 0.812 (0.731–0.890) | 0.804(0.752–0.855) | 0.843 (0.712–0.973) | 0.865 (0.818–91.1) |
| Accuracy (95% CI) | 84.50% (78.42–89.47) | 71.2% (65.36–76.53) | 90.71% (84.64–94.96) | 78.74% (73.19–83.61) |
| Specificity | 97.00% | 74.44% | 99.21% | 66.14% |
| Sensitivity | 50.00% | 67.91% | 7.69% | 91.34% |
| Positive Predictive Value | 85.71% | 72.80% | 50.00% | 72.96% |
| Optimal cut-point | ||||
| Optimal cut-point | 0.369 | 0.563 | 0.120 | 0.591 |
| Area under ROC curve (95% CI) | 0.812 (0.731–0.890) | 0.804(0.752–0.855) | 0.843 (0.712–0.973) | 0.865 (0.818–91.1) |
| Accuracy (95% CI) | 81.81% (75.36–87.11) | 73.41% (67.68–78.61) | 75.71% (65.75–82.56) | 82.28% (77.02–86.77) |
| Specificity | 88.72% | 83.46% | 74.80% | 74.02% |
| Sensitivity | 62.50% | 63.43% | 92.31% | 90.55% |
| Positive Predictive Value | 66.67% | 79.44% | 26.68% | 77.70% |
Abbreviations: CI, confidence interval; HPD, Hyperprogressive disease; TTP, Time-to-progression.
The clinical features in the models were: Previous lines of therapy, presence of hepatic metastasis, presence of bone metastasis and NLR. The radiomics features were: Radial gradient border SD-2D, 3D Laws E5L5E5, border 3D Laws E5E5L5 and border quartile coefficient of dispersion.
The clinical feature in the models was: RMH prognostic score and the radiomic feature was border NGTDM strength.
When patients were grouped based on an HPD included RECIST at first follow-up (Supplementary Fig. 4), HPD patients had significantly lower overall survival (OS). Patient-level probabilities from the final TTP < 2 months vs TTP ≥ 2 months model was subgrouped and analyzed for survival outcomes where patients with lower probability scores had significantly improved PFS. These results were consistent when the probability scores were categorized by CART (Supplementary Fig. 5) and percentiles (Supplementary Fig. 6).
Discussion
Although immunotherapy can provide clinical benefit among late stage lung cancer patients, published studies have reported that only 20 to 50% of patients exhibit durable responses [1–6, 8]. Moreover, rapid disease progression is associated with rapid and lethal outcomes (Supplemental Fig. 4), particularly HPD [7]. As such, in this early report we identified novel parsimonious models containing highly informative clinical data and radiomic features to predict rapid disease progression phenotypes of NSCLC patients with modest to high AUROCs ranging from 0.804 to 0.865 (Supplementary Fig. 3) and accuracies ranging from 73.4% to 82.3%.
Prior studies have also documented rapid disease progression phenotypes, including HPD, in the immunotherapy setting [7, 14, 15]. The cumulative evidence from these prior studies and our analyses demonstrate that clinical data have modest performance in predicting immunotherapy treatment response. To improve the discriminatory classification of rapid disease progression phenotypes, we incorporated radiomic features extracted from pre-treatment baseline CT images. The parsimonious models from the radiomic only models yielded modest performance; however, substantial improvements in the AUROCs were observed when clinical and radiomic features were combined to predict the rapid disease progression phenotypes (Supplementary Fig. 3).
For the analyses comparing TTP < 2 months vs. TTP ≥ 2 months, the combined final radiomic-clinical model produced an AUROC of 0.804 (with 83.4% specificity, 63.4% sensitivity, and 73.4% accuracy) based on four clinical covariates and four radiomic features. The clinical covariates in the final model were presence of hepatic and bone metastasis, previous lines of systemic therapies, and neutrophils to lymphocytes ratio (NLR). Prior studies have shown that presence of hepatic and/or bone metastases are associated with poor outcomes on NSCLC patients [18, 19]. In the bone marrow, the resident and infiltrated stromal cells and their molecular mediators create a unique bone metastatic microenvironment that leads to persistent immunosuppression [19] and the liver is a known site of immune tolerance which may be the cause of resistant liver metastasis lesions to immunotherapy. Elevated baseline-derived NLR have been associated with reduced OS and PFS in NSCLC treated with immunotherapies [18, 20]. Increased NLR is a measure of reduced lymphocytes which suppresses the host immune response where elevated NLR in the blood could be an implication of inflammatory cells being present in tumor microenvironment (TME) that leads to immune evasion or escape from the immune intervention [21]. Tumors that were exposed to higher number of systemic treatments could result in a clonal selection of resistant tumor cells that are able to evade immune-surveillance. Another possibility is that these tumors might have an innate resistance to any cancer therapy thereby exhibiting an “immune-desert” phenotype. Three of the four radiomic features (radial gradient border SD-2D, border quartile coefficient of dispersion, border 3D Laws E5E5L5,) were extracted from the border regions of the tumors, which is the immediate outside of the tumors that may be capturing data related to the TME. Radial gradient border SD-2D feature has previously shown to be associated with OS and semantic radiology of lung cancer patients [22]. Border quartile coefficient of dispersion, calculates the dispersion of the distribution of border region intensities which quantifies the degree of heterogeneity of the TME. Two 3D Laws features were also identified (3D Laws E5L5E5 and border 3D Laws E5E5L5) that quantify voxel-by-voxel differences and capture spatial and textural heterogeneity across the ROI [23].
The final clinical-radiomic model for HPD versus non-HPD analysis included Royal Marsden Hospital (RMH) prognostic score and one radiomic feature and revealed an AUROC of 0.865 with 92.9% specificity 74.0% sensitivity and 82.3% accuracy. The RMH prognostic score is a clinical prognostic score which has been shown to predict OS of immunotherapy patients [7] and advanced staged lung cancer patients [24]. The radiomic feature, border NGTDM strength, quantifies the similarity of pixel intensities within a neighborhood to derive heterogeneity and texture of the TME [25]. Though the biological underpinnings of HPD are currently unknown, published studies have speculated that checkpoint blockades may be in a proliferative activating oncogenic signaling response [7], aberrations in driver genes may be co-amplifying pathways that initiate HPD [14], and regulatory T-cells that suppress antitumor T-cell responses may promote tumor proliferation [15]. As radiomic features have been shown to capture biological information and genomic pathways [12] and correlate with genomic mutations [26], we speculate that these features associated with rapid disease progression could be capturing one or more of these characteristics. Nonetheless, further research is needed to elucidate the mechanisms of rapid disease progression and HPD and of the biology of the radiomic features that predicts disease outcomes.
We acknowledge both limitations and strengths of this study. This is an early report demonstrating the potential utility of radiomics to predict rapid disease progression phenotypes; these results will need to be replicated in independent test and validation cohorts. PD-L1 expression data were not available for these patients since the IHC assays were performed by the industry sponsors. Though, prior studies have revealed that PD-L1 expression has limitations in predicting immunotherapy response [27, 28]. A recent clinical trial study demonstrated that regardless of PD-L1 expression, immunotherapy combined with chemotherapy offers survival benefit [6]. Thus, inclusion of PD-L1 status may add little or no improvement to the performance of our models.
Because of the complexity in objective immunotherapy response, including hyperprogressive disease, pseudo-progression, and acquired resistance, there is a pressing challenge to identify biomarkers to predict patients that are least likely to respond. In this early report, we identified novel models containing informative clinical covariates and radiomic image features to predict rapid disease phenotypes including HPD. Additional research with independent test and validation will be needed to demonstrate the clinical utility of these findings.
Supplementary Material
Highlights.
Models that included radiomics and clinical data predicted patients that responded to checkpoint blockades.
Hyperprogressive disease was observed in a subset of patients were associated with extremely poor outcomes
Radiomic features extracted from peritumoral regions of lung tumors were shown to be more informative.
Acknowledgments
Funding support came from the National Cancer Institute (NCI) (U01-CA143062 to Dr. Gillies and Schabath), the NCI Early Detection Research Network (U01-CA200464 to Drs. Gillies and Schabath), and CA186145 and CA196405 (Subcontracts to Dr. Gillies). This work has also been supported in part by a Cancer Center Support Grant (CCSG) at the H. Lee Moffitt Cancer Center and Research Institute; an NCI designated Comprehensive Cancer Center [grant number P30-CA76292].
The authors thank Dr. Theresa A. Boyle for providing the immunohistochemistry images for Figure 1a. We also would like to thank to the Image Response Assessment Team (IRAT) Shared Resource Core for their assistance in implementing the IBSI radiomic feature set.
Footnotes
Publisher's Disclaimer: This is a PDF file of an unedited manuscript that has been accepted for publication. As a service to our customers we are providing this early version of the manuscript. The manuscript will undergo copyediting, typesetting, and review of the resulting proof before it is published in its final citable form. Please note that during the production process errors may be discovered which could affect the content, and all legal disclaimers that apply to the journal pertain.
Disclosure of Potential Conflicts of Interest
J.E.G. has research support from Bristol-Myers Squibb, AstraZeneca, and Genentech and is on the advisory board for AstraZeneca. R.J.G. is an investor and member of the Advisory Board at HealthMyne, Inc., and has Research support form Helix Biopharma.
References
- [1].Reck M, Rodriguez-Abreu D, Robinson AG, Hui R, Csoszi T, Fulop A, Gottfried M, Peled N, Tafreshi A, Cuffe S, O’Brien M, Rao S, Hotta K, Leiby MA, Lubiniecki GM, Shentu Y, Rangwala R, Brahmer JR, K.-. Investigators, Pembrolizumab versus Chemotherapy for PD-L1-Positive Non-Small-Cell Lung Cancer, N Engl J Med 375(19) (2016) 1823–1833. [DOI] [PubMed] [Google Scholar]
- [2].Brahmer J, Reckamp KL, Baas P, Crino L, Eberhardt WE, Poddubskaya E, Antonia S, Pluzanski A, Vokes EE, Holgado E, Waterhouse D, Ready N, Gainor J, Aren Frontera O, Havel L, Steins M, Garassino MC, Aerts JG, Domine M, Paz-Ares L, Reck M, Baudelet C, Harbison CT, Lestini B, Spigel DR, Nivolumab versus Docetaxel in Advanced Squamous-Cell Non-Small-Cell Lung Cancer, N Engl J Med 373(2) (2015) 123–35. [DOI] [PMC free article] [PubMed] [Google Scholar]
- [3].Borghaei H, Paz-Ares L, Horn L, Spigel DR, Steins M, Ready NE, Chow LQ, Vokes EE, Felip E, Holgado E, Barlesi F, Kohlhaufl M, Arrieta O, Burgio MA, Fayette J, Lena H, Poddubskaya E, Gerber DE, Gettinger SN, Rudin CM, Rizvi N, Crino L, Blumenschein GR Jr., Antonia SJ, Dorange C, Harbison CT, Graf Finckenstein F, Brahmer JR, Nivolumab versus Docetaxel in Advanced Nonsquamous Non-Small-Cell Lung Cancer, N Engl J Med 373(17) (2015) 1627–39. [DOI] [PMC free article] [PubMed] [Google Scholar]
- [4].Herbst RS, Baas P, Kim DW, Felip E, Perez-Gracia JL, Han JY, Molina J, Kim JH, Arvis CD, Ahn MJ, Majem M, Fidler MJ, de Castro G Jr., Garrido M, Lubiniecki GM, Shentu Y, Im E, Dolled-Filhart M, Garon EB, Pembrolizumab versus docetaxel for previously treated, PD-L1-positive, advanced non-small-cell lung cancer (KEYNOTE-010): a randomised controlled trial, Lancet 387(10027) (2016) 1540–50. [DOI] [PubMed] [Google Scholar]
- [5].Rittmeyer A, Barlesi F, Waterkamp D, Park K, Ciardiello F, von Pawel J, Gadgeel SM, Hida T, Kowalski DM, Dols MC, Cortinovis DL, Leach J, Polikoff J, Barrios C, Kabbinavar F, Frontera OA, De Marinis F, Turna H, Lee JS, Ballinger M, Kowanetz M, He P, Chen DS, Sandler A, Gandara DR, O.A.K.S. Group, Atezolizumab versus docetaxel in patients with previously treated non-small-cell lung cancer (OAK): a phase 3, open-label, multicentre randomised controlled trial, Lancet 389(10066) (2017) 255–265. [DOI] [PMC free article] [PubMed] [Google Scholar]
- [6].Gandhi L, Rodriguez-Abreu D, Gadgeel S, Esteban E, Felip E, De Angelis F, Domine M, Clingan P, Hochmair MJ, Powell SF, Cheng SY, Bischoff HG, Peled N, Grossi F, Jennens RR, Reck M, Hui R, Garon EB, Boyer M, Rubio-Viqueira B, Novello S, Kurata T, Gray JE, Vida J, Wei Z, Yang J, Raftopoulos H, Pietanza MC, Garassino MC, K.-. Investigators, Pembrolizumab plus Chemotherapy in Metastatic Non-Small-Cell Lung Cancer, N Engl J Med 378(22) (2018) 2078–2092. [DOI] [PubMed] [Google Scholar]
- [7].Champiat S, Dercle L, Ammari S, Massard C, Hollebecque A, Postel-Vinay S, Chaput N, Eggermont A, Marabelle A, Soria JC, Ferte C, Hyperprogressive Disease Is a New Pattern of Progression in Cancer Patients Treated by Anti-PD-1/PD-L1, Clin Cancer Res 23(8) (2017) 1920–1928. [DOI] [PubMed] [Google Scholar]
- [8].Chen DS, Mellman I, Elements of cancer immunity and the cancer-immune set point, Nature 541(7637) (2017) 321–330. [DOI] [PubMed] [Google Scholar]
- [9].Shukuya T, Carbone DP, Predictive Markers for the Efficacy of Anti-PD-1/PD-L1 Antibodies in Lung Cancer, J Thorac Oncol 11(7) (2016) 976–88. [DOI] [PMC free article] [PubMed] [Google Scholar]
- [10].Patel SP, Kurzrock R, PD-L1 Expression as a Predictive Biomarker in Cancer Immunotherapy, Mol Cancer Ther 14(4) (2015) 847–856. [DOI] [PubMed] [Google Scholar]
- [11].Gillies RJ, Kinahan PE, Hricak H, Radiomics: Images Are More than Pictures, They Are Data, Radiology 278(2) (2016) 563–577. [DOI] [PMC free article] [PubMed] [Google Scholar]
- [12].Aerts HJ, Velazquez ER, Leijenaar RT, Parmar C, Grossmann P, Carvalho S, Bussink J, Monshouwer R, Haibe-Kains B, Rietveld D, Hoebers F, Rietbergen MM, Leemans CR, Dekker A, Quackenbush J, Gillies RJ, Lambin P, Decoding tumour phenotype by noninvasive imaging using a quantitative radiomics approach, Nat Commun 5 (2014) 4006. [DOI] [PMC free article] [PubMed] [Google Scholar]
- [13].Lambin P, Rios-Velazquez E, Leijenaar R, Carvalho S, van Stiphout RG, Granton P, Zegers CM, Gillies R, Boellard R, Dekker A, Aerts HJ, Radiomics: extracting more information from medical images using advanced feature analysis, Eur J Cancer 48(4) (2012) 441–6. [DOI] [PMC free article] [PubMed] [Google Scholar]
- [14].Kato S, Goodman A, Walavalkar V, Barkauskas DA, Sharabi A, Kurzrock R, Hyperprogressors after Immunotherapy: Analysis of Genomic Alterations Associated with Accelerated Growth Rate, Clin Cancer Res 23(15) (2017) 4242–4250. [DOI] [PMC free article] [PubMed] [Google Scholar]
- [15].Saada-Bouzid E, Defaucheux C, Karabajakian A, Palomar Coloma V, Servois V, Paoletti X, Even C, Fayette J, Guigay J, Loirat D, Peyrade F, Alt M, Gal J, Le Tourneau C, Hyperprogression during anti-PD-1/PD-L1 therapy in patients with recurrent and/or metastatic head and neck squamous cell carcinoma, Ann Oncol (2017). [DOI] [PubMed] [Google Scholar]
- [16].Zhao B, James LP, Moskowitz CS, Guo P, Ginsberg MS, Lefkowitz RA, Qin Y, Riely GJ, Kris MG, Schwartz LH, Evaluating variability in tumor measurements from same-day repeat CT scans of patients with non-small cell lung cancer, Radiology 252(1) (2009) 263–72. [DOI] [PMC free article] [PubMed] [Google Scholar]
- [17].Chawla NV, Bowyer KW, Hall LO, Kegelmeyer WP, SMOTE: Synthetic minority over-sampling technique, J Artif Intell Res 16 (2002) 321–357. [Google Scholar]
- [18].Bagley SJ, Kothari S, Aggarwal C, Bauml JM, Alley EW, Evans TL, Kosteva JA, Ciunci CA, Gabriel PE, Thompson JC, Stonehouse-Lee S, Sherry VE, Gilbert E, Eaby-Sandy B, Mutale F, DiLullo G, Cohen RB, Vachani A, Langer CJ, Pretreatment neutrophil-to-lymphocyte ratio as a marker of outcomes in nivolumab-treated patients with advanced non-small-cell lung cancer, Lung Cancer 106 (2017) 1–7. [DOI] [PubMed] [Google Scholar]
- [19].Reinstein ZZ, Pamarthy S, Sagar V, Costa R, Abdulkadir SA, Giles FJ, Carneiro BA, Overcoming immunosuppression in bone metastases, Crit Rev Oncol Hematol 117 (2017) 114–127. [DOI] [PubMed] [Google Scholar]
- [20].Mezquita L, Auclin E, Ferrara R, Charrier M, Remon J, Planchard D, Ponce S, Ares LP, Leroy L, Audigier-Valette C, Felip E, Zeron-Medina J, Garrido P, Brosseau S, Zalcman G, Mazieres J, Caramela C, Lahmar J, Adam J, Chaput N, Soria JC, Besse B, Association of the Lung Immune Prognostic Index With Immune Checkpoint Inhibitor Outcomes in Patients With Advanced Non-Small Cell Lung Cancer, JAMA Oncol (2018). [DOI] [PMC free article] [PubMed] [Google Scholar]
- [21].Whiteside TL, The tumor microenvironment and its role in promoting tumor growth, Oncogene 27(45) (2008) 5904–12. [DOI] [PMC free article] [PubMed] [Google Scholar]
- [22].Tunali I, Stringfield O, Guvenis A, Wang H, Liu Y, Balagurunathan Y, Lambin P, Gillies RJ, Schabath MB, Radial gradient and radial deviation radiomic features from pre-surgical CT scans are associated with survival among lung adenocarcinoma patients, Oncotarget 8(56) (2017) 96013–96026. [DOI] [PMC free article] [PubMed] [Google Scholar]
- [23].Laws K, Texture Image Segmentation, University of South California, Los Angles, CA: (1980). [Google Scholar]
- [24].Garrido-Laguna I, Janku F, Vaklavas C, Falchook GS, Fu S, Hong DS, Naing A, Tsimberidou AM, Wen S, Kurzrock R, Validation of the Royal Marsden Hospital prognostic score in patients treated in the Phase I Clinical Trials Program at the MD Anderson Cancer Center, Cancer 118(5) (2012) 1422–8. [DOI] [PubMed] [Google Scholar]
- [25].Amadasun M, King R, Textural features corresponding to textural properties, IEEE Transactions on Systems, Man, and Cybernetics 19 (1989) 1264–1274. [Google Scholar]
- [26].Grossmann P, Stringfield O, El-Hachem N, Bui MM, Rios Velazquez E, Parmar C, Leijenaar RT, Haibe-Kains B, Lambin P, Gillies RJ, Aerts HJ, Defining the biological basis of radiomic phenotypes in lung cancer, Elife 6 (2017). [DOI] [PMC free article] [PubMed] [Google Scholar]
- [27].Shien K, Papadimitrakopoulou VA, Wistuba II, Predictive biomarkers of response to PD-1/PD-L1 immune checkpoint inhibitors in non-small cell lung cancer, Lung Cancer 99 (2016) 79–87. [DOI] [PMC free article] [PubMed] [Google Scholar]
- [28].Grigg C, Rizvi NA, PD-L1 biomarker testing for non-small cell lung cancer: truth or fiction?, J Immunother Cancer 4 (2016) 48. [DOI] [PMC free article] [PubMed] [Google Scholar]
Associated Data
This section collects any data citations, data availability statements, or supplementary materials included in this article.