

Abstract
Image-guided drug delivery is an emerging strategy in the field of nanomedicine. Addition of image guidance to traditional drug delivery system is expected to achieve highly efficient treatment by tracking the drug carriers in body and monitoring their effective accumulation in the targeted tissues. In this study, we developed multifunctional magneto-plasmonic liposomes (MPLs), a hybrid system combining liposomes and magneto-plasmonic nanoparticles for a triple-modality image-guided drug delivery. Tenofovir disoproxil fumarate, an antiretroviral drug used to treat Human immunodeficiency virus type 1 (HIV-1) was encapsulated into the MPLs to enable the treatment in the brain microenvironment, which is inaccessible by most of the drugs. We found strong negative and positive contrasts originated from magnetic core of MPLs in magnetic resonance imaging (MRI) and magnetic particle imaging (MPI), respectively. The gold shell of MPLs showed bright positive contrasts in X-ray computed tomography (CT). MPLs achieved to enhance transmigration across an in vitro blood–brain barrier (BBB) model by magnetic targeting. Moreover, MPLs provided desired therapeutic effects against HIV infected microglia cells.
Graphical abstract
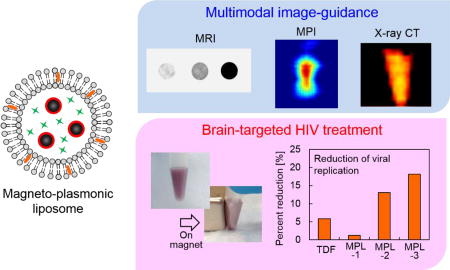
Magneto-plasmonic liposomes were developed for image-guided drug delivery, and showed multimodal imaging, enhanced BBB transmigration, and reduction of viral replication.
Introduction
Image-guided therapy or theranostics (combination of diagnosis and therapy) is one of the emerging biomedical applications in the field of nanomedicine.1,2,3 Image-guided drug delivery is a new strategy which helps to improve desired therapeutic effects by monitoring the exact biodistribution of the administered drugs, owing to the imaging contrast generated from their carriers (e.g. nanoparticles and polymers). Using targeted nano-systems as drug carriers increases the chances of successful therapy due to their effective role in adjusting the biodistribution, circulation time, and aqueous solubility of the drugs.4 Smart nano-systems can be designed for delivery of the vital drugs to most inaccessible parts of the body such as brain to act against diseases including HIV. Also, addition of imaging contrasts to these nano-systems, which show limited therapeutic effect due to lack of monitoring,5 helps to visualize them in body and validate their effective delivery to targeted regions by adjusting their physicochemical properties.
To achieve image-guided drug delivery, the nanoparticles need to possess imaging capability and targeting ability simultaneously. Various nano-formulations such as liposomes and polymers, which co-encapsulate both contrast agents and drugs, have been developed for image-guided drug delivery.6,7 These nano-formulations have a high drug loading capacity and can be tuned for sustained or controlled drug release. Contrary to these formulations, inorganic nanoparticles such as magnetic (e.g. iron oxide) and gold nanoparticles are considered as excellent candidates for image-guided drug delivery due to their intrinsic imaging capabilities. Magnetic nanoparticles (MNPs) show unique properties under external magnetic fields based on the field condition. One of the most established applications of MNPs is magnetic resonance imaging (MRI). MRI is a clinically established magnetic imaging system which uses magnetic nanoparticles as both negative and positive contrast enhancers based on the shortening effects on T2 or T1 relaxation time of surrounding tissues.8 Magnetic particle imaging (MPI) is a new pre-clinical imaging modality in which the imaging signal is directly generated from the non-linear magnetization of the nanoparticles in response to an external magnetic field.9 Unlike MRI, there is no tissue background signal interference in MPI. In addition, a magnetic force exerted on magnetic nanoparticles under a magnetic field gradient improves targeted delivery of drugs to desired tissues.10 Under an alternating magnetic field, MNPs induce heat, which can be used to control drug release and hyperthermia.11 Gold nanoparticles are also considered as effective contrast agents for biomedical imaging applications. Gold nanoparticles possess a unique optical property called surface plasmon resonance (SPR), which is based on the oscillation of free-electrons on the surface of nanoparticles under the light with specific wavelength.12 In addition, gold nanoparticles possess great X-ray attenuation. These properties allow gold nanoparticles to be used for multiple imaging modalities including photoacoustic imaging and X-ray CT.13,14 By combining magnetic and gold nanoparticles within a single nanostructure, magneto-plasmonic nanoparticles show multi-functionality including all the unique properties from magnetic and gold nanoparticles.15 This multi-functionality has a great advantage toward multi-modal imaging, which enables synergetic effect using multiple imaging modalities to overcome disadvantages of each modalities,16 thus allowing more precise imaging.
Human immunodeficiency virus (HIV) is a lentivirus which is a subfamily of retroviruses.17 Although successful antiretroviral therapy (ART) can reduce viral load of HIV infected patients significantly and improve life expectancy, eradication of HIV has not been achieved.18 Also, currently there is no preventive vaccine available for HIV.19 One of the hurdles for HIV treatment is the inaccessibility of anti-HIV drugs to sanctuary sites including central nervous system, which reduces the effectiveness of ART.20 Delivery of antiretroviral drugs or other external molecules to the brain is limited due to the existence of the blood–brain barrier (BBB), which separates the circulating blood from the brain.21,22 The BBB is a diffusion barrier formed by endothelial cells, astrocyte end-feet, and pericytes. The tight junctions between the cerebral endothelial cells selectively limit molecules to enter the brain.21 To overcome the limited accessibility of drugs to the brain, nanoparticle-based drug delivery has been applied for brain targeting by improving drug transport across the BBB. Receptor-mediated pathways have been primary strategies to deliver nanoparticles non-invasively to the brain. It is based on the affinity between targeting ligand on the nanoparticle surface and their receptors expressed on the brain endothelial cells, followed by transcytosis which is a transcellular transport mechanism.23 Enhanced BBB transmigration of MNPs, magneto-electric nanoparticles, and magneto-plasmonic nanoparticles has been shown using magnetic targeting.15,24,25,26
Here, we developed a multi-functional hybrid system containing biocompatible liposomes and magneto-plasmonic nanoparticles for image-guided delivery of anti-HIV drugs to the brain (Figure 1). This hybrid system allowed high loading of an antiretroviral drug within the liposomes, enhanced BBB transmigration, and enable precise monitoring of drug distribution using multi-modal imaging due to the unique properties of magneto-plasmonic nanoparticles. The developed hybrid system, magneto-plasmonic liposomes (MPLs) were tested for multi-modal imaging capabilities, cytotoxicity, BBB transmigration efficiency, and anti-HIV therapeutic effect.
Fig. 1.

Schematic illustration of preparation steps for magneto-plasmonic liposomes (MPLs). Sodium citrate coated magnetic nanoparticles (MNP-citrate) were synthesized by co-precipitation method, followed by Au coating on the surface by citrate reduction. Au coated MNPs (MNP@Au) were further coated with Polyethylene glycol (PEG). PEG coated MNP@Au and tenofovirdisoproxil fumarate (TDF) were encapsulated into DPPC liposomes. Prepared MPLs release TDF in a sustained manner.
Experimental
Materials
Iron(III) chloride hexahydrate (ACS reagent, 97%), Iron(II) chloride tetrahydrate (ReagentPlus®), 98%, hydrochloric acid (36.5–38.0%, BioReagent, for molecular biology), ammonium hydroxide (28% NH3 in H2O, ≥99.99% trace metals basis), sodium citrate dihydrate (≥99%, FG), Gold(III) chloride trihydrate (ACS reagent, ≥49.0% Au basis), potassium thiocyanate (ACS reagent, ≥99.0%), cholesterol (≥99%), XTT sodium salt (BioReagent), and phenazine methosulfate, Fibronectin from bovine plasma, Fluorescein isothiocyanate-dextran (average mol wt 3,000–5,000), and Polybrene were purchased from Sigma-Aldrich. Chloroform (HPLC Grade) was purchased from Fisher Scientific. Ultra Pure Agarose was purchased from Invitrogen. mPEG-Thiol, Mw 5000 was purchased from Laysan Bio, Inc. 1,2-dipalmitoyl-sn-glycero-3-phosphocholine (DPPC) and 1-palmitoyl-2-(dipyrrometheneboron difluoride)undecanoyl-sn-glycero-3-phosphocholine (TopFluor PC) were purchased from Avanti Polar Lipids, Inc. Tenofovir Disoproxil Fumarate (TDF) was purchased from United States Pharmacopeia. Human brain astrocytes (HAs), human brain endothelial cells (HBMECs), their culture media, and poly-L-lysine were purchased from ScienCell Research Laboratories. Human microglia cell line (CHME-5) was purchased from Applied Biological Materials. HIV-1 BaL (catalog #510) was provided by National Institutes of Health AIDS Research and Reference Reagent Program. Hoechst 33342, Trihydrochloride trihydrate was purchased from Invitrogen.
Synthesis of magnetic nanoparticles
Magnetic nanoparticles (MNPs) were synthesized by co-precipitation method. Briefly, Iron(III) chloride hexahydrate (FeCl3·6H2O, 1.17 g) dissolved in water and Iron(II) chloride tetrahydrate (FeCl2·4H2O, 0.43 g) dissolved in 2M hydrochloric acid solution were mixed. The temperature of the solution was increased to 70 °C and ammonium hydroxide was added dropwise with stirring at 200 rpm. Immediately after addition of ammonium hydroxide, the color of the solution turned black. After 30 min of stirring, an aqueous solution containing 0.95 g of sodium citrate was added and the temperature of the solution was further increased to 90 °C. This reaction was continued for 30 min under stirring at 400 rpm. The synthesized citrate coated MNPs (MNP-citrate) were purified with water by using a centrifuge followed by 30 min of sonication.
Synthesis of MNP@Au magneto-plasmonic nanoparticles
MNP@Au magneto-plasmonic nanoparticles were synthesized by using an adapted version of the method previously reported.15 Briefly, MNP-citrate (8 mg) dispersed in 5 mM sodium citrate was sonicated using a probe sonicator at 20% amplitude prior to gold coating. The solution was heated to boiling temperature and 85 µmol of HAuCl4 was added under stirring at 300 rpm. After 6 min reaction, the resulting nanoparticles (core-shell nanoparticles of magnetic nanoparticles core and gold shell, MNP@Au) were collected using a magnet and redispersed into distilled water.
Characterization of MNP@Au magneto-plasmonic nanoparticles
The iron and gold concentrations were determined using an Inductively Couple Plasma mass spectrometer (ICP-MS, Perkin Elmer Sciex, model ELAN DRC-II). Samples were dissolved in aqua regia and diluted by deionized water prior to the measurement. Transmission electron microscopy (TEM) images were acquired using a Phillips CM-200 200 kV transmission electron microscope operated at 80 kV. The magnetization curve of MNP@Au was measured using a vibrating sample magnetometer (VSM-3, Toei Kogyo) equipped with an electromagnet (TEM-WFR7, Toei Kogyo) and a gaussmeter (Model 421, Lake Shore Cryotronics, Inc.). The measurement was conducted at room temperature with a maximum field of 780 kA/m. X-ray powder diffraction (XRD) pattern of MNP@Au was recorded with Bruker GADD/D8 X-Ray system with Mo anode (wavelength: 0.708 A). Optical properties of MNP@Au were determined by measuring absorbance using a UV-Visible Spectrophotometer (HITACHI U-2910). Samples were diluted with distilled water to the Fe concentration of 10 µg/ml.
Preparation of magneto-plasmonic liposomes (MPLs)
MNP@Au was coated with polyethylene glycol (PEG) before liposomal preparation. Briefly, mPEG-Thiol (0.5 mg/ml) was added to MNP@Au and stirred at 300 rpm overnight. PEG coated MNP@Au (MNP@Au-PEG) was purified using centrifuge and sonicated for 1 min using a probe sonicator at 20% amplitude.
MPLs were prepared by hydration method. DPPC and cholesterol were mixed in chloroform and evaporated using a rotary evaporator. Resulting film was hydrated with 10 mM HEPES buffer saline containing 0.2 mg/ml of MNP@Au-PEG and TDF, and kept in a water bath at 50 °C for 2h. After the hydration, unilamellar liposomes were obtained by extrusion process using a membrane with pore size of 0.2 µm followed by purification using centrifuge at 1000g. For the optimization of liposomal formulation, the molar ratio of lipid to cholesterol was varied from 1:1, 2:1, 4:1, and no cholesterol, and the drug to lipid ratio was varied from 0.1:34 to 1:34.
Characterization of magneto-plasmonic liposomes (MPLs)
The encapsulation efficiency of drug was measured using a UV-visible spectrophotometer (HITACHI U-2910). The supernatant removed at purification process of MPLs was centrifuged at 200,000g for 60 min to separate unencapsulated drug. The drug concentration in the supernatant was measured using a UV-visible spectrophotometer. The encapsulation efficiency was calculated using following equation:
where WTotal is the total amount of drug added during preparation and WSupernatant is the amount of drug detected in supernatant. The amount of MNP@Au encapsulated into liposomes were also measured using a UV-visible spectrophotometer. The encapsulated MNP@Au was extracted by dissolving liposomes using Triton X-100. The amount of the extracted MNP@Au was measured using a UV-visible spectrophotometer. Hydrodynamic sizes and zeta potentials of MPLs dispersed in PBS were measured using a Zetasizer Nano-ZS (Malvern instruments).
TDF Release study from MPLs was performed using a dialysis membrane. MPLs were loaded in a dialysis membrane (Micro Float-A-Lyzer, Spectrum Labs) with molecular weight cut-off of 100 kDa and immersed in an isotonic solution, 10 mM phosphate buffered-saline solution (PBS, pH 7.4). The temperature of the heater surface was set at 40 °C and stirring rate was kept at 200 rpm. The sample was collected at each time points up to 3 days and replaced with PBS.
TEM images of MPLs were acquired using a Phillips CM-200 200 kV transmission electron microscope operated at 80 kV.
Multimodal imaging property
The MRI property of MPLs was evaluated in a 30cm horizontal bore 7-Tesla MRI system (Bruker Biospin). An aqueous solution of MPLs (100 µl) was placed into a polymerization chain reaction (PCR) tube and fixed with 1wt% agar. Sample temperature was maintained at room temperature. The transverse relaxation time T2-weighted images were obtained with the following parameters: pulse repetition time 2000 ms, echo time 5.21ms, slice thickness 1mm, and number of acquisitions 12.
MPI images of MPLs were acquired with the projection Field Free Line (FFL) Momentum MPI scanner (Magnetic Insight Co.). An aqueous solution of MPLs (100 µl) was placed into a polymerization chain reaction (PCR) tube and fixed with 1wt% agar. The MPI scanner was operated with a magnetic field gradient strength of 6, 6, and 6 T/m along x-, y- and z-axes of the instrument with an excitation field of peak amplitude 20 mT at 45 kHz along z-axis. Overlap fraction and harmonic bandwidth were 90% and 1000 kHz. 2D images were captured with a field of view (FOV) of 6 cm × 8 cm and acquisition time of 10 seconds per projection.
Micro-CT imaging was conducted using TriFoil Imaging CT120 with about 10 minutes acquisition time and 100mm isotropic resolution. VivoQuant software was used for image reconstructions. CT values were estimated in Hounsfield units (HU) by calibration with water and air as 0 HU and −1000 HU, respectively.
Cytotoxicity study
The cytotoxicity study of MPLs was conducted on primary human astrocytes and a human microglia cell line (CHME-5) using XTT (Sodium 3,3’-(-[(Phenlamino)carbonyl]-3,4-tetrazolium)-bis(4-methoxyl-6-nitro)benzene sulfonic acid hydrate) assay. Cells were seeded in 96-well cell culture plates at a density of 1×10⁴ cells/well and 4×10⁴ cells/well for primary human astrocytes and CHME-5, respectively. After 24h of incubation at 37°C, the medium was replaced with 100 µl of fresh medium containing MPLs with MNP@Au concentration of 0.5–10 µg/ml. After 24h and 48h incubation, cells were washed with PBS and 100 µl of fresh medium was added. XTT/PMS mixture solution was prepared by mixing XTT and phenazine methosulfate (PMS) immediately before use. XTT/PMS mixture solution (25 µl) was added to each well and incubated at 37°C for 4h. Absorbance was measured at 450 nm using a microplate reader (Synergy HT, multi-mode microplate reader, BioTek).
Experiments were performed in quadruplicate replicates (N=3). The results are represented as the mean ± standard deviation. Statistical analysis was performed using one-way analysis of variance (ANOVA) followed by Tukey’s multiple comparison test and difference was considered significant at P<0.05.
In vitro blood-brain barrier (BBB) model and BBB transmigration
For BBB transmigration test, MPLs containing fluorescent tagged-lipids (TopFluor PC) were prepared. Briefly, 0.5 mol% of DPPC was replaced with TopFluor PC and followed by the evaporation of lipid, hydration of lipid film with 10 mM HEPES buffer saline containing 0.2 mg/ml of MNP@Au-PEG and TDF, and extrusion process. Control plain liposomes were prepared by adding PBS for hydration process.
The in vitro BBB model was developed in a bicompartmental transwell culture plate as described earlier.27,24,25 Briefly, 2×10⁵ primary human brain microvascular endothelial cells (HBMECs) were grown to confluence on the upper side of the transwell inserts with 3 µm microporous membrane, and 1×10⁵ human astrocytes and 1×10⁵ human pericytes were grown underside of the inserts, respectively. The further experiments were conducted within 6 days after seeding the cells, and establishment of the BBB integrity was confirmed by the transendothelial electrical resistance (TEER) measurement.
Transmigration study was conducted by adding fluorescent labelled plain liposomes or MPLs to the upper chamber and incubating at 37°C for 24h with a magnet (a magnetic field of 150 mT at the surface of culture plate measured using a gaussmeter) below the cell culture plate. After incubation, the media containing liposomes was collected from the lower chamber and the fluorescent signal from the liposomes was measured with excitation/emission wavelengths at 485/520 nm using a microplate reader. Transmigration efficiency was calculated as
where FLower is the fluorescent signal in lower chamber and FTotal is the fluorescent signal from total amount of liposomes initially added to upper chamber.
The effect of MPLs exposure on the integrity of the in vitro BBB was determined by measuring TEER using Millicell ERS microelectrodes (Millipore) after exposure of MPLs to the BBB model. Experiments were performed in duplicate replicates (N=3), and the results are represented as the mean ± standard deviation.
Anti-HIV therapeutic efficacy of MPLs
The therapeutic efficacy of MPLs was tested on HIV infected CHME-5 human microglia cell line. Cells were seeded in a 12-well cell culture plate at a density of 2.5×10⁵ cells/well and incubated for 24h at 37°C. The cells were activated by treating with polybrene (15 µg/mL) for 1 hour prior to the infection. Then, they were infected with HIV-1 BaL overnight and washed with PBS. The medium was replaced with 1 ml of fresh medium containing MPLs and incubated for 3 days. The culture supernatants were collected and quantitated for HIV p24 antigen using an enzyme-linked immunosorbent assay kit (ZeptoMetrix, NY, USA). Experiments were performed in duplicate replicates (N=2).
For cellular internalization study, CHME-5 cells were seeded in a 12-well culture plate at a density of 2×10⁵ cells/well. After 24h of incubation at 37°C, the medium was replaced with 1 ml of fresh medium containing fluorescent labelled MPLs with MNP@Au concentration of 1 µg/ml. After 1, 3, and 6h incubation, the cells were washed with PBS and Hoechst 33342 was added for nucleus staining. The internalized MPLs were observed using a fluorescence microscope (Olympus IX51).
Results and discussion
Synthesis and characterization of MNP@Au magneto-plasmonic nanoparticles
MNP@Au magneto-plasmonic nanoparticles were synthesized by seeding approach. First, MNPs were synthesized by co-precipitation method and coated with sodium citrate (MNP-citrate). Then, MNP-citrate seeds were coated with gold by reducing Au3+ on the surface. This process was optimized in our previous report.15 MNP@Au was also coated with PEG to improve the stability. The Au-to-Fe weight ratio of MNP@Au-PEG measured by ICP-MS was 3.49 (72 wt% Au, 28 wt% Fe3O4). TEM images of MNP-citrate and MNP@Au-PEG are shown in Figure 2(a) and (b). MNP-citrate showed spherical morphology and the average particle size of 10.4 nm. After gold coating, MNP@Au-PEG showed almost sphere structure with the average particle size of 33.0 nm. The nanoparticles with weaker contrast in Figure 2(b) shows the existence of uncoated MNPs. Based on the Au-to-Fe weight ratio and average sizes of MNP@Au-PEG, the average diameter of MNPs core and thickness of Au shell were calculated to be 27.7 nm and 2.6 nm, respectively. This indicates that clusters of multiple MNPs were coated by Au shell with the thickness of 2.6 nm. Figure 2 (c) shows the magnetization curve of MNP@Au. The magnetization curve showed no coercivity or remanent magnetization at room temperature when the external magnetic field was zero, confirming their superparamagnetic behavior. Superparamagnetic nanoparticles show negligible magnetic interaction with each other and have better colloidal stability,28 thus preferred for in vivo applications. The saturation magnetization of MNP@Au before PEG coating was 35 emu/ MNP@Au·g (Am2/kg), which is 38% of bulk saturation magnetization of magnetite, 92 emu/g.29 Successful Au coating was confirmed through X-ray diffraction and absorbance. Figure 2 (d) shows X-ray diffraction patterns of MNP-citrate and MNP@Au. The peaks from MNP-citrate were indexed to the (2 2 0), (3 1 1), (4 0 0), (4 2 2), (5 5 1), (4 4 0) and (5 3 3) planes, which correspond to Fe3O4. On the other hand, MNP@Au showed sharp peaks from gold shell which can be indexed to the (1 1 1), (2 0 0), (2 2 0), (3 1 1), and (2 2 2) planes, and slight peaks which can be indexed to the planes correspond to Fe3O4. The Au shell thickness of MNP@Au was calculated using Scherrer’s equation30 and estimated to be 6.7 nm, which was larger than the thickness calculated from ICP data (2.6 nm). This can be explained by an inaccuracy of Au-to-Fe weight ratio in a single particle due to the existence of uncoated MNPs. The absorbance spectrum of MNP-citrate and MNP@Au are shown in Figure 2 (e). No apparent absorbance peaks were observed for MNP-citrate between 400 and 800 nm. An increase of absorbance from MNP-citrate was observed at the wavelength below 500 nm due to ligand to metal charge transition of iron oxides.31 On the other hand, sharp absorbance peak at 526 nm was observed for MNP@Au. This is due to the surface plasmon resonance (SPR) phenomenon which is a unique property of metal nanoparticles caused by the oscillation of free-electrons on the surface.32
Fig. 2.

Characterization of MNP@Au. (a) TEM image of MNP-citrate, (b) TEM image of MNP@Au-PEG, (c) a magnetization curve of MNP@Au, (d) X-ray diffraction (XRD) patterns of MNP-citrate and MNP@Au, and (e) absorbance of MNP-citrate and MNP@Au. The average sizes of MNP-citrate and MNP@Au were 10.4 nm and 33.0 nm, respectively. MNP@Au showed superparamagnetic property. Au specific diffraction pattern and SPR peak were observed from MNP@Au.
Preparation and characterization of magneto-plasmonic liposomes (MPLs)
MPLs were prepared by co-encapsulating MNP@Au-PEG and anti-HIV drug, tenofovir disoproxil fumarate (TDF) into Dipalmitoyl phosphatidylcholine (DPPC) liposomes. MNP@Au was coated with PEG before liposomal preparation to improve its colloidal stability. Since the composition of liposome can significantly change their drug encapsulation efficiency, hydrodynamic size, and drug release, MPLs were prepared by varying the drug-to-lipid and lipid-to-cholesterol ratios. The preparation conditions were tuned to achieve optimized TDF encapsulation efficiency, hydrodynamic sizes, and TDF release profile. Figure 3(a) shows TDF encapsulation efficiency of MPLs prepared by different drug-to-lipid ratios ranging from 0.1:34 to 1:34. Increased TDF encapsulation efficiency was observed with MPLs prepared with higher drug ratio. Figure 3 (b) and (c) show the TDF encapsulation efficiency and hydrodynamic size variations of MPLs prepared with the lipid-to-cholesterol ratio varied from no cholesterol to 1:1, while the drug-to-lipid ratio was fixed at 1:34. The TDF encapsulation efficiency increased significantly by reducing cholesterol ratio, showing the highest encapsulation for MPLs prepared without cholesterol. Hydrodynamic sizes of MPLs were also affected by the lipid-to-cholesterol ratios. Increasing the amount of cholesterol reduced hydrodynamic sizes of MPLs, except for MPLs prepared with the lipid-to-cholesterol ratio of 1:1. This suggests that cholesterol has a key role in the encapsulation efficiency, size, and drug release of MPLs. Due to its hydrophobicity and rigid structure, incorporation of cholesterol is known to improve the stability of liposome bilayer and reduce permeability.33,34 Increasing the amount of cholesterol increases the mechanical rigidity of liposome bilayers, and induces an expansion of lipid head groups.35,36 Resulting reduction of internal aqueous volume within the hydrophilic region decreased encapsulation efficiency of hydrophilic drug.37 A reduction of hydrophilic drug encapsulation efficiency was also reported due to the limited binding spaces caused by stearic hindrances when the amount of cholesterol was increased.38 We saw the same variations in MPLs, which showed lower encapsulation efficiency of hydrophilic drug TDF for MPLs prepared with higher cholesterol ratio.
Fig. 3.

Characterization of MPLs. (a) TDF encapsulation efficiency (EE) of MPLs prepared at fixed lipid-to-cholesterol ratio (2:1) and the drug-to-lipid ratio varied from 0.1:34 to 1:34. (b) TDF EE of MPLs prepared at fixed drug-to-lipid ratio (1:34) and the lipid-to-cholesterol ratio varied from no cholesterol to 1:1. (c) Hydrodynamic sizes of the MPLs prepared at fixed drug-to-lipid ratio (1:34) and the lipid-to-cholesterol ratio varied from no cholesterol to 1:1. (d) In vitro TDF release from MPLs prepared at fixed drug-to-lipid ratio (1:34) with no cholesterol and lipid to cholesterol ratio of 2:1. (e) TEM image of MPLs. (f) Apicture of MPLs attracted to a magnet.
The TDF release study was conducted on two MPLs prepared with no cholesterol and the lipid-to-cholesterol ratio of 2:1 based on selection criteria of the highest encapsulation efficiency and smallest hydrodynamic size, respectively. We found faster TDF release for MPLs prepared with no cholesterol (Figure 3 (d)). The encapsulated TDF of these MPLs was completely released within 2 days. In contrast, slower TDF release occurred for MPLs prepared with the lipid-to-cholesterol ratio of 2:1 after an initial burst release within the first 6h. This fast release at the beginning of release profile corresponds with other liposomal formulations.39 Lower permeability of cholesterol containing liposomes results in slower drug release,40 which is preferred for sustained drug release approaches. Based on the small hydrodynamic size and slower drug release profile, we chose MPLs (containing 2.4 µmol TDF per mg MNP@Au) prepared with the drug-to-lipid ratio of 1:34 and the lipid-to-cholesterol ratio of 2:1 for further imaging and in vitro experiments. The TEM image of the MPLs and the picture of the MPLs attracted by a magnet were shown in Figure 3 (e) and (f).
Multimodal imaging property
MRI, MPI, and micro-CT scan were conducted to demonstrate multimodal imaging capability of MPLs. Figures 4 (a) and (b) show the T2-weighted MR images and transverse relaxivity of MPLs as a function of Fe concentration. Stronger negative contrast and enhanced transverse relaxivity were observed by increasing Fe concentration, and the T2 relaxivity was calculated to be 424 mM−1·s−1. The relaxivity of magnetic nanoparticles strongly depends on their composition, size, and aggregation state of the particles. Iron oxide nanoparticles with larger core show greater T2 relaxivity.41 The relaxivity can be controlled by aggregation of monodispersed iron oxide nanoparticles, and enhanced T2 relaxivity is reported for the particles with larger hydrodynamic sizes.42 Higher T2 relaxivity of MPLs compared to clinically used T2 contrast agent Feridex® (133 mM−1 s−1)43 can be explained due to the cluster of multiple MNPs within the Au shell, which corresponds to the MNPs core diameter of 27.7 nm calculated from the ICP-MS result.
Fig. 4.

Multi-modal imaging properties of MPLs. (a) T2-weighted MRI images, (b) transverse relaxivity, (c) MPI images, (d) MPI signals, (e) micro-CT images, and (f) CT values of MPLs. MRI images showed strong negative contrast in a Fe concentration dependent manner, and a linear trend of transverse relaxivity was observed. MPI images showed concentration dependent positive contrast and exhibited linear signal variation with increasing MPLs concentration. Micro-CT images also showed concentration dependent positive contrast and higher CT value was observed with higher concentration of MPLs.
Figures 4 (c) and (d) show MPI images and MPI signal intensities of MPLs with different concentrations. The contrast of MPI image was enhanced by increasing MPLs concentration. The signal intensity was also increased linearly with concentration, showing an R-squared value of 0.998. MPI uses MNPs as contrast agents. Unlike MRI, which uses hydrogen proton as a signal source,44 MPI signal is generated directly from MNPs based on their intrinsic magnetic responses (non-linear magnetization), and there is no background from surrounding tissues due to their diamagnetic property.45 This makes MPI a promising candidate for quantitative imaging with high sensitivity and spatial resolution.
Micro-CT images and CT values of MPLs are shown in Figures 4 (e) and (f). Increasing the concentration of MNP@Au resulted in higher contrasts with CT attenuation values of 169 and 238 Hounsfield units (HU) for MPLs with MNP@Au concentrations of 10 and 48 µg/ml, respectively. The concentration dependent enhancement of CT contrast was generated from gold.46 Gold nanostructures (e.g. gold nanoparticles and nanoshells) are emerging as CT contrast enhancers that can be potentially used as alternatives for currently available iodine-based contrast agents in clinics. Iodine based CT contrast agents require high dose of administration to achieve effective diagnosis, and the associated toxicity and their short blood circulation times limit their application.47 Gold nanoparticles are expected to overcome these limitations due to the biocompatibility and higher X-ray attenuation coefficient.48 Overall, these results indicate that MPLs are excellent candidates for accurate image-guided therapy using triple-modal MRI/ MPI/ CT imaging.
Cytotoxicity study
Figure 5 shows the viability of primary human astrocytes and microglia cell line CHME-5 after exposure to MPLs containing 2.4 µmol TDF per mg MNP@Au evaluated by XTT assay. Exposure to MPLs up to the concentration of 10 µg MNP@Au/ml showed no significant decrease in the viability of the primary human astrocytes within 48 hours. CHME-5 exposed to MPLs for 24h showed no effect on the viability. However, the viability of CHME-5 cells was slightly decreased to 89% after 48h exposure to MPLs at a concentration of 10 µg MNP@Au/ml, which is negligible in terms of overall cytotoxicity concerns.
Fig. 5.

Effect of MPLs on cellular viability. (a) Human primary astrocytes and (b) CHME-5 after 24h and 48h exposure to MPLs. The concentration of MPLs was varied from 0.5 to 10 µg MNP@Au /ml. The viability was determined using XTT assay. (*P < 0.05; NS, not significant, P > 0.05; N = 3)
Although biocompatibility of liposomes has been proved in in vitro, in vivo, and clinical studies, there are less reports conducting the toxicity study of magneto-plasmonic nanoparticles especially on central nervous system (CNS) cells.49 Our previous study showed that magneto-plsmonic nanoparticles (MNP@Au-PEG) caused no toxicity on primary human astrocytes at the concentration up to 100 µg/ml.15 Separate cytotoxicity studies showed less cytotoxicity of TDF compared to other reverse transcriptase inhibitors such as stavudine.50 The highest concentration of encapsulated TDF in MPLs used for XTT assay was 24.2 µM (10 µg MNP@Au/ml), which was lower than the reported CC50 (50% cytotoxicity concentration) of 399 µM and 850 for HepG2 cells and skeletal muscle cells, respectively.51
In vitro blood−brain barrier (BBB) model
The blood−brain barrier (BBB) limits the transmigration of pathogens, chemicals, proteins, drugs and various nano-formulations due to the tight junctions between capillary endothelial cells, which regulate the transport of molecules based on size and charge. Therefore, nano-formulations must possess the capacity to cross the BBB in order to gain access to the brain. Magnetic targeting is a targeting strategy which utilizes magnetic force exerted on magnetic nanoparticles to achieve efficient delivery in an active manner. An enhanced transmigration of magnetized nano-formulations across the BBB has been demonstrated under an external magnetic field generated by a permanent magnet.15,24,25,26
BBB transmigration capacity of MPLs was evaluated using an in vitro BBB model prepared as previously described.27 Figure 6 (a) shows the BBB transmigration efficiency of control plain liposomes and MPLs. Higher transmigration efficiency was observed by increasing the incubation time of control liposomes and MPLs in the presence of a magnetic field gradient. MPLs showed significantly higher BBB transmigration efficiency compared to control liposomes after 3, 6, and 24h incubation. The magnetic force exerted on MPLs under a magnetic field gradient contributed to the higher transmigration efficiency which was 1.8-fold increase compared to the transmigration efficiency of control liposomes after 24h incubation. Transendothelial electric resistance (TEER) of the in vitro BBB model was measured after transmigration study to evaluate the integrity of the BBB. The BBB untreated, exposed to control liposomes, or exposed to MPLs showed TEER values of 260 ± 20, 253± 15, and 257 ± 16 Ω/cm2, respectively. Since the TEER value of 200 Ω/cm2 is considered to be the baseline reading indicative of BBB formation,52 the TEER values of untreated and treated BBB models prove sufficient integrity. Moreover, no significant difference was observed for the TEER values of the BBB models after transmigration study of control liposomes and MPLs, which indicates that the transmigration of liposomes in the presence of a magnetic field gradient did not disrupt BBB integrity.
Fig. 6.

BBB transmigration and therapeutic efficacy of MPLs. (a) BBB transmigration efficiency of MPLs across an in vitro BBB model. (b) Percent reduction in p24 level of HIV infected CHME-5 after three day incubation with TDF alone (13.2 µM) and MPLs with concentrations of 3.1 µg (MPL-1), 6.2 µg (MPL-2), and 9.3 µg MNP@Au /ml (MPL-3). (c) MPLs uptake by microglia cells. Bright field images and fluorescent images of CHME-5 exposed to fluorescent labelled MPLs (green fluorescence) for 1, 3, and 6h. The cell nucleus (blue) was stained with Hoechst 33342. Uptake of MPLs were clearly observed after 3h incubation, and significant amount of MPLs were internalized at 6h.
Anti-HIV therapeutic efficacy of MPLs
Therapeutic effect of MPLs on HIV infected microglia cells (CHME-5) was evaluated by monitoring the levels of HIV p24 antigen released in the supernatant. The p24 antigen is the HIV capsid protein, a major component of viral core,53 and is used as a marker to detect in vitro HIV infections.54 Figure 6 (b) shows percent reduction in p24 level of HIV infected CHME-5 after three day treatment with TDF alone (13.2 µM) and MPLs containing 2.4 µmol TDF per mg MNP@Au. The concentration of MPLs was varied from 3.1 µg MNP@Au /ml (MPL-1) to 9.3 µg
MNP@Au/ml (MPL-3). The encapsulated and released TDF concentration on day 3 was calculated based on the drug release profile (Table 1). HIV replication as measured by p24 ELISA was reduced from 370 pg/ml in control/untreated cells and to 349 pg/ml in cells treated with 13.2 µM TDF, respectively. After 3 day treatment with three different concentrations of MPLs, p24 antigen decreased to 365, 324, and 308 pg/ml for the cells incubated with the MPL-1, MPL-2, and MPL-3, respectively. The treatment with higher concentration of MPLs resulted in a greater p24 reduction for HIV-infected CHME-5. The percent reduction of CHME-5 treated with the highest concentration of MPLs (MPL-3) was 18%, which was three times effective compared to CHME-5 treated with TDF alone. Although the TDF concentration released from MPL-3 at day3 was 13.2 µM, which was same concentration for TDF alone control sample, MPLs showed greater effect on p24 reduction. This greater therapeutic effect of TDF encapsulated in MPLs could be due to the cellular internalization of MPLs.
Table 1.
MPLs used for therapeutic efficacy study. Three different concentrations of MPLs were used for p24 measurement. Corresponding values for total encapsulated TDF were calculated from encapsulation efficiency of MPLs (2.4 µmol TDF per mg MNP@Au). Released TDF within 3 days was calculated from in vitro release profile of MPLs.
| MNP@Au | Encapsulated TDF |
Released TDF | |
|---|---|---|---|
| TDF | - | - | 13.2 µM |
| MPL-1 | 3.1 µg/ml | 7.4 µM | 4.4 µM |
| MPL-2 | 6.2 µg/ml | 14.8 µM | 8.8 µM |
| MPL-3 | 9.3 µg/ml | 22.2 µM | 13.2 µM |
To evaluate cellular internalization, CHME-5 cells were exposed to the fluorescent labelled MPLs and monitored up to 6h using fluorescent microscopy. Figure 6 (c) shows bright field and fluorescent images of the CHME-5 cells exposed to MPLs for 1, 3, and 6h. Significant uptake of MPLs was observed after 3h incubation, and the overall fluorescence intensity increased after 6h incubation, indicating enhanced uptake of MPLs over incubation time. The fluorescent signals from MPLs (green color) was uniformly distributed throughout the cells except for their nuclei. Cellular uptake of liposomes is known to be mediated mainly by cell membrane fusion or endocytosis.55 The membrane fusion allows delivery of molecules directly into cytoplasm, which is preferred for certain applications such as gene delivery.56 The uptake via fusion can be promoted by incorporating cations and membrane-disrupting peptides.57 On the other hand, the nanomaterials internalized via endocytosis are transferred to endosomes, which ultimately fuse with lysosomes and degrade internalized nanomaterials depending on the pathway.58 The liposomes containing DPPC as a main lipid component are neutral, which are not actively fusogenic. However, cellular uptake of DPPC liposomes and their accumulation in lysosomes have been reported previously.59,60 These results indicate that MPLs were internalized into CHME-5 possibly via endocytosis. TDF is a nucleotide reverse-transcriptase inhibitor, which inhibits viral replication by chain termination of viral DNA.61 Since this mechanism occurs intracellularly, the cellular transport efficiency strongly affects the therapeutic effect. Although TDF has been reported to enter cells by passive diffusion,62 their encapsulation into liposomes facilitated effective cellular uptake. The enhanced delivery and release of the encapsulated TDF inside the cells enabled efficient inhibition of viral replication.
In this study, we developed multi-functional MPLs for brain-targeted image-guided drug delivery for HIV treatment. We demonstrated sustained release of TDF from MPLs, their biocompatibility, and the therapeutic effect on HIV infected microglia after a treatment with MPLs. The ability to generate contrasts using MRI, MPI, and X-ray CT and the capability to cross the BBB will enable brain-targeted drug delivery with highly precise image guidance. Taken together, MPLs have a great potential for image-guided drug delivery targeting other brain diseases such as brain tumors and Alzheimer's disease.
Conclusions
Magneto-plasmonic liposomes (MPLs) containing MNP@Au and anti-HIV drug, tenofovir disoproxil fumarate (TDF) were developed for HIV treatment in the brain. We optimized MPLs for sustained release with 59% TDF release over three days. They showed negative contrasts in T2-weighted MRI and positive contrasts in MPI and X-ray CT. The BBB transmigration efficiency of MPLs was enhanced under an external magnetic field gradient without disrupting the integrity. The treatment of HIV infected microglia with MPLs successfully reduced viral replication. Given our findings, we conclude that MPLs can effectively deliver anti-HIV drug to HIV infected cells with a guidance of triple-modal imaging.
Acknowledgments
We would like to acknowledge Advance Materials Engineering Research institute (AMERI) at FIU for TEM, Trace Evidence Analysis Facility at FIU for ICP-MS, and Center for Study of Matter at Extreme Conditions (CeSMEC) at FIU for XRD. This work was supported by NIH grants 1R01DA037838, 1R01DA040537, R01DA034547, and 5R01DA042706. ER was supported by Florida Science Training and Research Fellowship (FSTAR) Program with a support of Office of Minority Health of the United States Department of Health & Human Services grant CPIMP151112-01-00.
Notes and references
- 1.Kelkar SS, Reineke TM. Bioconjug. Chem. 2011;22:1879–1903. doi: 10.1021/bc200151q. [DOI] [PubMed] [Google Scholar]
- 2.Fernandez-fernandez A, Manchanda R, Mcgoron AJ. Appl. Biochem. Biotechnol. 2011;165:1628–1651. doi: 10.1007/s12010-011-9383-z. [DOI] [PMC free article] [PubMed] [Google Scholar]
- 3.Lammers T, Kiessling F, Hennink WE, Storm G. Mol. Pharm. 2010;7:1899–1912. doi: 10.1021/mp100228v. [DOI] [PubMed] [Google Scholar]
- 4.Mudshinge SR, Deore AB, Patil S, Bhalgat CM. Saudi Pharm. J. 2011;19:129–141. doi: 10.1016/j.jsps.2011.04.001. [DOI] [PMC free article] [PubMed] [Google Scholar]
- 5.Chakravarty R, Hong H, Cai W. Curr. Drug Targets. 2016;16:592–609. doi: 10.2174/1389450115666140902125657. [DOI] [PMC free article] [PubMed] [Google Scholar]
- 6.De Smet M, Langereis S, Van Den Bosch S, Bitter K, Hijnen NM, Heijman E, Grüll H. J. Control. Release. 2013;169:82–90. doi: 10.1016/j.jconrel.2013.04.005. [DOI] [PubMed] [Google Scholar]
- 7.Mieszawska AJ, Kim Y, Gianella A, Van Rooy I, Priem B, Labarre MP, Ozcan C, Cormode DP, Petrov A, Langer R, Farokhzad OC, Fayad ZA, Mulder WJM. Bioconjug. Chem. 2013;24:1429–1434. doi: 10.1021/bc400166j. [DOI] [PMC free article] [PubMed] [Google Scholar]
- 8.Bin Na H, Song IC, Hyeon T. Adv. Mater. 2009;21:2133–2148. [Google Scholar]
- 9.Panagiotopoulos N, Duschka RL, Ahlborg M, Bringout G, Debbeler C, Graeser M, Kaethner C, Lüdtke-Buzug K, Medimagh H, Stelzner J, Buzug TM, Barkhausen J, Vogt FM, Haegele J. Int. J. Nanomedicine. 2015;10:3097–3114. doi: 10.2147/IJN.S70488. [DOI] [PMC free article] [PubMed] [Google Scholar]
- 10.Pankhurst QA, Connolly J, Jones SK, Dobson J. J. Phys. D. Appl. Phys. 2003;36:167–181. [Google Scholar]
- 11.Tomitaka A, Takemura Y. J. Pers. NanoMedicine. 2015;1:33–37. [Google Scholar]
- 12.Eustis S, el-Sayed Ma. Chem. Soc. Rev. 2006;35:209–217. doi: 10.1039/b514191e. [DOI] [PubMed] [Google Scholar]
- 13.Wang LV, Hu S. Science (80-.) 2012;335:1458–1462. doi: 10.1126/science.1216210. [DOI] [PMC free article] [PubMed] [Google Scholar]
- 14.Xu C, Tung GA, Sun S. Chem Mater. 2008;20:4167–4169. doi: 10.1021/cm8008418. [DOI] [PMC free article] [PubMed] [Google Scholar]
- 15.Tomitaka A, Arami H, Raymond A, Yndart A, Kaushik A, Jayant RD, Takemura Y, Cai Y, Toborek M, Nair M. Nanoscale. 2017;9:764–773. doi: 10.1039/c6nr07520g. [DOI] [PMC free article] [PubMed] [Google Scholar]
- 16.Caruso F, Hyeon T, Rotello V, Lee D, Koo H, Sun I, Ryu JH, Kim K, Kwon IC. Chem. Soc. Rev. 2012;41 doi: 10.1039/c2cs15261d. [DOI] [PubMed] [Google Scholar]
- 17.Gupta U, Jain NK. Adv. Drug Deliv. Rev. 2010;62:478–490. doi: 10.1016/j.addr.2009.11.018. [DOI] [PubMed] [Google Scholar]
- 18.Lafeuillade A. Curr. HIV/AIDS Rep. 2012;9:121–131. doi: 10.1007/s11904-012-0115-y. [DOI] [PubMed] [Google Scholar]
- 19.Mamo T, Moseman EA, Kolishetti N, Salvador C, Shi J, Kuritzkes DR, Langer R, Von Andrian U, Farokhzad OC. Nanomedicine. 2010;5:269–285. doi: 10.2217/nnm.10.1. [DOI] [PMC free article] [PubMed] [Google Scholar]
- 20.Cory TJ, Schacker TW, Stevenson M, Fletcher CV. Curr. Opin. HIV AIDS. 2013;8:190–195. doi: 10.1097/COH.0b013e32835fc68a. [DOI] [PMC free article] [PubMed] [Google Scholar]
- 21.Ballabh P, Braun A, Nedergaard M. Neurobiol. Dis. 2004;16:1–13. doi: 10.1016/j.nbd.2003.12.016. [DOI] [PubMed] [Google Scholar]
- 22.Nair M, Jayant RD, Kaushik A, Sagar V. Adv. Drug Deliv. Rev. 2016;103:202–217. doi: 10.1016/j.addr.2016.02.008. [DOI] [PMC free article] [PubMed] [Google Scholar]
- 23.Wohlfart S, Gelperina S, Kreuter J. J. Control. Release. 2012;161:264–273. doi: 10.1016/j.jconrel.2011.08.017. [DOI] [PubMed] [Google Scholar]
- 24.Jayant RD, Atluri VSR, Agudelo M, Sagar V, Kaushik A, Nair M. Int. J. Nanomedicine. 2015;10:1077–1093. doi: 10.2147/IJN.S76517. [DOI] [PMC free article] [PubMed] [Google Scholar]
- 25.Ding H, Sagar V, Agudelo M, Pilakka-Kanthikeel S, Atluri VSR, Raymond A, Samikkannu T, Nair MP. Nanotechnology. 2014;25:055101. doi: 10.1088/0957-4484/25/5/055101. [DOI] [PMC free article] [PubMed] [Google Scholar]
- 26.Kaushik A, Jayant RD, Nikkhah-Moshaie R, Bhardwaj V, Roy U, Huang Z, Ruiz A, Yndart A, Atluri V, El-Hage N, Khalili K, Nair M. Sci. Rep. 2016;6:25309. doi: 10.1038/srep25309. [DOI] [PMC free article] [PubMed] [Google Scholar]
- 27.Persidsky Y, Stins M, Way D, Witte MH, Weinand M, Kim KS, Bock P, Gendelman HE, Fiala M. J. Immunol. 1997;158:3499–3510. [PubMed] [Google Scholar]
- 28.Wilczewska AZ, Niemirowicz K, Markiewicz KH, Car H. Pharmacol. Reports. 2012;64:1020–1037. doi: 10.1016/s1734-1140(12)70901-5. [DOI] [PubMed] [Google Scholar]
- 29.Sato T, Iijima T, Seki M, Inagaki N. J. Magn. Magn. Mater. 1987;65:252–256. [Google Scholar]
- 30.Yasukawa K, Nishimura M. J. Am. Ceram. Soc. 2007;90:1107–1111. [Google Scholar]
- 31.Jain PK, Xiao Y, Walsworth R, Cohen AE. Nano Lett. 2009;9:1644–1650. doi: 10.1021/nl900007k. [DOI] [PubMed] [Google Scholar]
- 32.Huang X, El-Sayed Ma. J. Adv. Res. 2010;1:13–28. [Google Scholar]
- 33.Raffy S, Teissie J. Biophys. J. 1999;76:2072–2080. doi: 10.1016/S0006-3495(99)77363-7. [DOI] [PMC free article] [PubMed] [Google Scholar]
- 34.Oliveira J, Claro M, Souza D, Petrilli R, Palma J, Barcellos A, Lee RJ, Maldonado J. Colloids Surfaces B Biointerfaces. 2014;123:345–363. doi: 10.1016/j.colsurfb.2014.09.029. [DOI] [PubMed] [Google Scholar]
- 35.Monteiro N, Martins A, Reis RL, Neves NM. J. R. Soc. Interface. 2014;11:20140459. doi: 10.1098/rsif.2014.0459. [DOI] [PMC free article] [PubMed] [Google Scholar]
- 36.Scarlata SF. Biophys. Chem. 1997;69:9–21. doi: 10.1016/s0301-4622(97)00034-3. [DOI] [PubMed] [Google Scholar]
- 37.Glavas-dodov M, Fredro-kumbaradzi E, Goracinova K, Simonoska M. Int. J. Pharm. 2005;291:79–86. doi: 10.1016/j.ijpharm.2004.07.045. [DOI] [PubMed] [Google Scholar]
- 38.Briuglia M-L, Rotella C, McFarlane A, Lamprou DA. Drug Deliv. Transl. Res. 2015;5:231–242. doi: 10.1007/s13346-015-0220-8. [DOI] [PubMed] [Google Scholar]
- 39.Ramana LN, Sethuraman S, Ranga U, Krishnan UM. J. Biomed. Sci. 2010;17:1–9. doi: 10.1186/1423-0127-17-57. [DOI] [PMC free article] [PubMed] [Google Scholar]
- 40.Wallace SJ, Nation RL, Li J, Boyd BJ. J. Pharm. Sci. 2013;102:1578–1587. doi: 10.1002/jps.23508. [DOI] [PubMed] [Google Scholar]
- 41.Jun Y, Huh Y, Choi J, Lee J, Song H, Kim S, Yoon S, Kim K, Shin J, Suh J, Cheon J. J. Am. Chem. Soc. 2005;127:5732–5733. doi: 10.1021/ja0422155. [DOI] [PubMed] [Google Scholar]
- 42.Larsen BA, Haag MA, Serkova NJ, Shroyer KR, Stoldt CR. Nanotechnology. 2008;19:265102. doi: 10.1088/0957-4484/19/26/265102. [DOI] [PubMed] [Google Scholar]
- 43.Lee N, Kim H, Hong S, Park M, Kim D, Kim H. Proc. Natl. Acad. Sci. 2011;108:2662–2667. doi: 10.1073/pnas.1016409108. [DOI] [PMC free article] [PubMed] [Google Scholar]
- 44.Berger A. BMJ. 2002;324:35. doi: 10.1136/bmj.324.7328.35. [DOI] [PMC free article] [PubMed] [Google Scholar]
- 45.Bauer LM, Situ SF, Griswold MA, Samia ACS. J. Phys. Chem. Lett. 2015;6:2509–2517. doi: 10.1021/acs.jpclett.5b00610. [DOI] [PubMed] [Google Scholar]
- 46.Jing L, Liang X, Deng Z, Feng S, Li X, Huang M, Li C, Dai Z. Biomaterials. 2014;35:5814–5821. doi: 10.1016/j.biomaterials.2014.04.005. [DOI] [PubMed] [Google Scholar]
- 47.Lusic H, Grinstaff MW. Chem. Rev. 2013;113:1641–1666. doi: 10.1021/cr200358s. [DOI] [PMC free article] [PubMed] [Google Scholar]
- 48.Xing H, Bu W, Zhang S, Zheng X, Li M, Chen F, He Q, Zhou L, Peng W, Hua Y, Shi J. Biomaterials. 2012;33:1079–1089. doi: 10.1016/j.biomaterials.2011.10.039. [DOI] [PubMed] [Google Scholar]
- 49.Ren J, Shen S, Pang Z, Lu X, Deng C, Jiang X. Chem. Commun. 2011;47:11692. doi: 10.1039/c1cc15528h. [DOI] [PubMed] [Google Scholar]
- 50.Grim SA, Romanelli F. Ann. Pharmacother. 2003;37:849–859. doi: 10.1345/aph.1C388. [DOI] [PubMed] [Google Scholar]
- 51.Cihlar T, Birkus G, Greenwalt DE, Hitchcock MJM. Antiviral Res. 2002;54:37–45. doi: 10.1016/s0166-3542(01)00210-8. [DOI] [PubMed] [Google Scholar]
- 52.Wilhelm I, Fazakas C, Krizbai IA. Acta Neurobiol Exp. 2011;71:113–128. doi: 10.55782/ane-2011-1828. [DOI] [PubMed] [Google Scholar]
- 53.Tang S, Zhao J, Wang A, Viswanath R, Harma H, Little RF, Yarchoan R, Stramer SL, Nyambi PN, Lee S, Wood O, Wong EY, Wang X, Hewlett IK. Clin. Vaccine Immunol. 2010;17:1244–1251. doi: 10.1128/CVI.00066-10. [DOI] [PMC free article] [PubMed] [Google Scholar]
- 54.Duong T, Brennan C, Vallari A, Ebel A, Hunt J, Martin L, Daghfal D, Schochetman G, Devare S. J. Virol. Methods. 2004;122:185–194. doi: 10.1016/j.jviromet.2004.08.018. [DOI] [PubMed] [Google Scholar]
- 55.Sandra A, Pagan0 RE. J. Biol. CHEMWTRY. 1979;254:2244–2249. [PubMed] [Google Scholar]
- 56.Deng H, Zhao X, He D, Guo W, Yang K, Dong A, Liang X. Chem. Commun. 2016;52:7406–7408. doi: 10.1039/c6cc01996j. [DOI] [PubMed] [Google Scholar]
- 57.Dutta D, Pulsipher A, Luo W, Mak H, Yousaf MN. Bioconjug. Chem. 2011;22:2423–2433. doi: 10.1021/bc200236m. [DOI] [PubMed] [Google Scholar]
- 58.Bareford LM, Swaan PW. Adv. Drug Deliv. Rev. 2007;59:748–758. doi: 10.1016/j.addr.2007.06.008. [DOI] [PMC free article] [PubMed] [Google Scholar]
- 59.Onuki Y, Obata Y, Kawano K, Sano H, Matsumoto R, Hayashi Y, Takayama K. Mol. Pharm. 2016;13:369–378. doi: 10.1021/acs.molpharmaceut.5b00601. [DOI] [PubMed] [Google Scholar]
- 60.Chithrani DB, Dunne M, Stewart J, Allen C, Jaffray DA. Nanomedicine Nanotechnology, Biol. Med. 2010;6:161–169. doi: 10.1016/j.nano.2009.04.009. [DOI] [PubMed] [Google Scholar]
- 61.Fung HB, Stone EA, Piacenti FJ. Clin. Ther. 2002;24:1515–1548. doi: 10.1016/s0149-2918(02)80058-3. [DOI] [PubMed] [Google Scholar]
- 62.Taneva E, Crooker K, Park H, Su JT, Ott A, Cheshenko N, Szleifer I, Kiser PF, Frank B, Mesquita PMM, Herold C. Antimicrob. Agents Chemother. 2016;60:1667–1675. doi: 10.1128/AAC.02793-15. [DOI] [PMC free article] [PubMed] [Google Scholar]