

Abstract
Functional magnetic resonance imaging (fMRI) has been used to infer age-differences in neural activity from the hemodynamic response function (HRF) that characterizes the blood-oxygen-level-dependent (BOLD) signal over time. BOLD literature in healthy aging lacks consensus in age-related HRF changes, the nature of those changes, and their implications for measurement of age differences in brain function. Between-study discrepancies could be due to small sample sizes, analysis techniques, and/or physiologic mechanisms. We hypothesize that, with large sample sizes and minimal analysis assumptions, age-related changes in HRF parameters could reflect alterations in one or more components of the neural-vascular coupling system. To assess HRF changes in healthy aging, we analyzed the large population-derived dataset from the Cambridge Center for Aging and Neuroscience (CamCAN) study (Shafto et al., 2014). During scanning, 74 younger (18–30 years of age) and 173 older participants (54–74 years of age) viewed two checkerboards to the left and right of a central fixation point, simultaneously heard a binaural tone, and responded via right index finger button-press. To assess differences in the shape of the HRF between younger and older groups, HRFs were estimated using FMRIB’s Linear Optimal Basis Sets (FLOBS) to minimize a priori shape assumptions. Group mean HRFs were different between younger and older groups in auditory, visual, and motor cortices. Specifically, we observed increased time-to-peak and decreased peak amplitude in older compared to younger adults in auditory, visual, and motor cortices. Changes in the shape and timing of the HRF in healthy aging, in the absence of performance differences, support our hypothesis of age-related changes in the neural-vascular coupling system beyond neural activity alone. More precise interpretations of HRF age-differences can be formulated once these physiologic factors are disentangled and measured separately.
1. Introduction
Functional magnetic resonance imaging (fMRI) has been used to investigate the physiologic basis of age-related changes in brain function. MRI signal is sensitive to the ratio of diamagnetic oxygenated- to paramagnetic deoxygenated-hemoglobin in the blood. Following neural activity, local deoxygenated-hemoglobin concentration increases causing local magnetic inhomogeneities and a decrease in signal on T2*-weighted images. Subsequent increases in local blood flow results in a higher ratio of oxygenated- to deoxygenated-hemoglobin and an overall increase in T2*-weighted signal. This blood-oxygen-level-dependent signal (BOLD) reflects the venous blood oxygenation and is influenced by cerebral blood flow, cerebral blood volume, and cerebral metabolic rate of oxygen (Davis et al., 1998; Hoge et al., 1999; Ogawa and Lee, 1990; Raichle, 1998). The hemodynamic response function (HRF) characterizes changes in BOLD signal over time, typically peaking around three to five seconds after stimulus presentation (Hirano et al., 2011; Martindale et al., 2003; Yeşilyurt et al., 2008).
Many studies have aimed to infer age-related changes in neural activity from the HRF. However, this inference relies on the assumption that all other components of the neural-vascular coupling system are age-equivalent (i.e., hemodynamic equivalence; Boynton et al., 1996; Logothetis, 2010). The assumption that the HRF directly reflects neural activity may be reasonable in individual differences studies limited to younger healthy adults but may not be tenable in healthy older adults and diseased populations with known glial and vascular differences (Bonakdarpour et al., 2007; D’Esposito et al., 2003; D’Esposito et al., 1999; Hillman, 2014; Hubbard et al., 2016; Rypma and D’Esposito, 2001; Turner et al., 2018; Zou et al., 2011). According to the hemodynamic-equivalence assumption, age-related differences in HRF peak amplitude would be interpreted as differences in neural activity alone. Alternatively, other studies have assumed neural equivalence by utilizing passive, sensory stimuli (e.g., visual and auditory). The assumption is that these stimuli place relatively minimal demands on the neural component of the neural-vascular unit (Buckner et al., 2000; Cunnington et al., 1995; Huettel et al., 2001; Ross et al., 1997; Rypma and D’Esposito, 2001). According to the neural-equivalence assumption, HRF shape differences can be interpreted as changes in the glial and/or vascular components of the neural-vascular coupling system. Thus, interpretations of the HRF have been complicated by a priori assumptions across studies. To address the validity of these assumptions, one focus of investigation has been on age-related neural-vascular coupling differences and their underlying mechanisms (e.g. D’Esposito et al., 1999, Huettel et al., 2001).
Studies investigating age-related changes in the HRF have produced mixed results. For example, some studies observe age-related decreases in HRF amplitude in response to visual stimuli (Ances et al., 2009; Fabiani et al., 2014; Handwerker et al., 2007; Ross et al., 1997; Tekes et al., 2005; Ward et al., 2015) and motor tasks (Buckner et al., 2000; Hesselmann et al., 2001; Riecker et al., 2003; Tekes et al., 2005), while others observe no significant differences (Aizenstein et al., 2004; Brodtmann et al., 2003; D’Esposito et al., 1999; Grinband et al., 2017; Huettel et al., 2001; Richter and Richter, 2003; Rosengarten et al., 2003; Schroeter et al., 2004). Additionally, some studies observe age-related delayed time-to-peak (Handwerker et al., 2007; Taoka et al., 1998) while others observe accelerated time-to-peak (Huettel et al., 2001). Thus, studies of age-related changes in HRF shape have been inconsistent, both in detecting differences and determining the nature of those differences.
One explanation for between-study inconsistencies could be sample-specific age-related differences in any of the neural, glial, or vascular components of the neural-vascular coupling system. Efficient brain function requires finely-tuned communication between each component of this system to provide energy resources in the timely manner required by neurons to maintain ionic homeostasis during action potential firing at sub-millisecond rates (Attwell et al., 2010; Cauli and Hamel, 2010). Thus, even minor perturbations in any component of the neural-vascular coupling system could result in age-related HRF alterations.
Beyond physiologic explanations, the current literature features a wide-variety of sample sizes, with most fMRI studies including 10–17 participants (David et al., 2013; Yarkoni and Braver, 2010). Small sample sizes can lead to sampling bias and sample-specific results, potentially impeding replicability and accurate interpretations of results across studies (Yarkoni and Braver, 2010). Results may also vary depending on study-specific HRF modeling methods. Some studies assume a rigid response function that can only model differences in response amplitude (i.e., the canonical HRF), whereas others use more flexible functions that allow for modeling of amplitude and timing parameters (i.e., finite impulse response models, basis sets; Grinband et al., 2017; Lindquist et al., 2009; Turner et al., 2018). Between-study differences in HRF modeling methods could render inter-study comparisons misleading.
Beyond HRF model selection, results could depend on spatial normalization to standard space or region-of-interest (ROI) selection. For instance, one study observed significant age-related differences in HRF amplitude when images were transformed to standard space, but there were no observed differences when the data remained in subjects’ native space (Liu et al., 2017). The authors of this study concluded that the combination of age-related atrophy and spatial normalization created artifactual HRF amplitude differences. ROI selection criteria can also influence between-group differences in HRF shape or timing. The spatial extent of supra-threshold voxels may differ between participant groups. Therefore, whether studies average the signal across supra-threshold voxels or an entire functional or anatomical ROI can significantly impact the detection of HRF differences (Aizenstein et al., 2004; D’Esposito et al., 1999; Rypma and D’Esposito, 2001). Accordingly, the goal of this study was to assess age-related HRF shape differences in a large population-based sample with flexible HRF modeling in native space, and careful consideration of ROI selection to adjudicate of the question of age-related HRF changes.
The current study utilizes the large dataset acquired from a population-based study, comprising 80 younger and 212 older healthy adults (Shafto et al., 2014), to minimize sample-specific influences on results. During fMRI scanning, participants were presented with short bimodal (visual and auditory) sensory stimuli and responded via right index finger button-press to evoke responses in occipital, temporal, and precentral cortices. To circumvent a priori assumptions of HRF shape, we modeled the event-related data using flexible basis sets (FSL-FLOBS), with the only constraint being sensible HRF shape (Woolrich et al., 2004). Both supra-threshold and anatomical ROIs were used to assess influences of ROI selection criteria on age-related HRF results. We observed significant age-related differences in HRF shape and timing parameters in occipital, temporal, and precentral regions. With no age-related performance differences, we assumed neural equivalence during these sensory tasks. Results suggest that neural-vascular coupling is probably not consistent between healthy younger and older adults.
2. Methods
2.1. Participants
Samples of younger (18–30 years of age) and older (54–74 years of age) participants were taken from the population-derived Stage 2 sample of the Cambridge Center for Aging and Neuroscience (CamCAN) repository (available at http://www.mrc-cbu.cam.ac.uk/datasets/camcan/; Shafto et al., 2014; Taylor et al., 2017). All participants were fluent in English and screened for cognitive impairment, neurological and psychiatric diagnoses, history of substance abuse, and fMRI contraindicators (for complete information see Shafto et al., 2014). Additionally, participants with vision (corrected vision of 20/100 or worse with both eyes) or hearing (failing to hear 35 dB at 1000Hz in either ear or had a non-removable hearing aid) problems, which could affect their ability to participate in experiments, were excluded from the study. If necessary, correction eye goggles were worn in the scanner. Due to brain segmentation and parcellation abnormalities, 6 younger and 25 older participants were excluded from analysis. An additional 1 younger and 14 older participants were excluded due to negative response (see 2.3 Analysis for further details). A final sample of 74 younger participants (18–30 years of age; M=25.41, SD=3.58, 33 males, 40 females) and 173 older participants (54–74 years of age; M=63.72, SD=6.00, 100 males, 73 females) were included in the study.
2.2. Imaging data and acquisition
Magnetic resonance imaging (MRI) was collected as part of a one-hour session in a 3T Siemens TIM Trio scanner with a 32-channel head-coil. High-resolution 3D T1-weighted structural images were acquired using Magnetization Prepared Rapid Gradient Echo (MPRAGE) sequences with the following parameters: Repetition Time (TR) =2250 ms; Echo Time (TE) =2.99 ms; Inversion Time (TI) =900 ms; flip angle =9 degrees; field of view (FOV) =256 mm x 240 mm x 192 mm; voxel size =1 mm isotropic; GRAPPA acceleration factor =2; acquisition time =4 minutes and 32 seconds. Functional MRI (fMRI) was acquired using a T2*-weighted Echo-Planar Imaging (EPI) sequence while participants completed a sensorimotor task with the following parameters: TR =1970 ms; TE =30 ms; flip angle =78 degrees; total of 261 volumes; FOV =192 mm x 192 mm; 32 axial slices, slice thickness =3.7 mm, interslice gap =20%; voxel size =3 mm x 3 mm x 4.44 mm; acquisition time =8 minutes and 40 seconds.
The audio/visual sensorimotor task consisted of 120 bimodal trials and eight unimodal trials. The timing of trials was optimized for fMRI impulse response estimation by generating a sequence of stimulation and null trials using a 255-length m-sequence (Buracas and Boynton, 2002) with m=2 and minimal stimulus onset asynchrony (SOA) of 2 seconds, (SOA range = 2–26seconds). The order was identical across subjects. In 40 pseudorandomly-ordered bimodal trials participants saw two checkerboards to the left and right of a central fixation point (34 ms) and heard a 300 ms binaural tone at 1200 Hz. Age-related pure-tone hearing loss is consistent between 300 and 1200Hz, thus we focused on one auditory frequency (Brant and Fozard, 1990). Participants were instructed to focus on a central fixation cross and respond via right index finger if they heard or saw any stimuli. For further details see Shafto et al. (2014) and Taylor et al. (2017).
2.3. Analysis
All preprocessing was done in FMRIB Software Library (FSL v5.0.9; Oxford, UK; Jenkinson et al., 2012). Time-series of images were slice-time corrected, motion-corrected with Motion Correction using FMRIB’s Linear Image Registration Tool (MCFLIRT; Jenkinson et al., 2002), high-pass filtered (100s) to remove low-frequency noise, spatially smoothed with Gaussian kernel (5mm), skull-stripped using Brain Extraction Tool (BET; Smith, 2002) and co-registered to each participants’ MPRAGE structural image, thus each image remained in native space throughout analysis (Liu et al., 2017). FMRIB’s Linear Optimal Basis Sets (FLOBS; Woolrich et al., 2004) was used to create a FLOBS-generated basis set for Hemodynamic Response Function (HRF) convolution (number of basis functions =3, m1=0–2, m2 =3–8, m3 =3–8, m4 =3–8, c =0–0.3; see Supplemental Figure 1). Based on singular value decomposition, the first three eigen functions contain 99.5% of the variance (Woolrich et al., 2004). Voxel-wise time-series was input into FMRIB’s Expert Analysis Tool (FEAT) with temporal autocorrelation correction (FILM prewhitening; Woolrich et al., 2001), and regressed with each stimulus onset and motion parameters from MCFLIRT as nuisance covariates. We corrected for multiple comparisons using cluster analysis (z-thresh=2.3 with clusterwise p<0.05).
Cortical parcellation was done using Freesurfer (Desikan et al., 2006; Fischl et al., 2004). For each subject, regions of interest (ROI) were defined as the occipital, temporal and left-hemisphere (LH) precentral lobes as defined by Freesurfer. All subsequent data analysis was done using in-house code written in MATLAB (R2016a, The Mathworks, Natick MA). Participants’ HRFs were created using the parameter estimates and FLOBS basis functions (i.e., pe1*f1+pe2*f2+pe3*f3). Each participant’s HRF (ΔBOLD) was normalized to their voxel-wise baseline mean (resting) signal resulting in each HRF reflecting %BOLD change. An average HRF was calculated across each ROI and smoothed via a moving average filter (span = 1s). HRF parameters of interest (see Fig 1) were calculated from each smooth HRF and included peak amplitude, time-to-peak, rise slope, trough amplitude, time-to-trough, fall slope, peak-to-trough, full width half maximum of the peak (FWHM), and area under curve (AUC). A participant was excluded from the group if he or she exhibited no significant activation in the ROI and thus a negative peak amplitude (D’Esposito et al., 2003).
Figure 1.
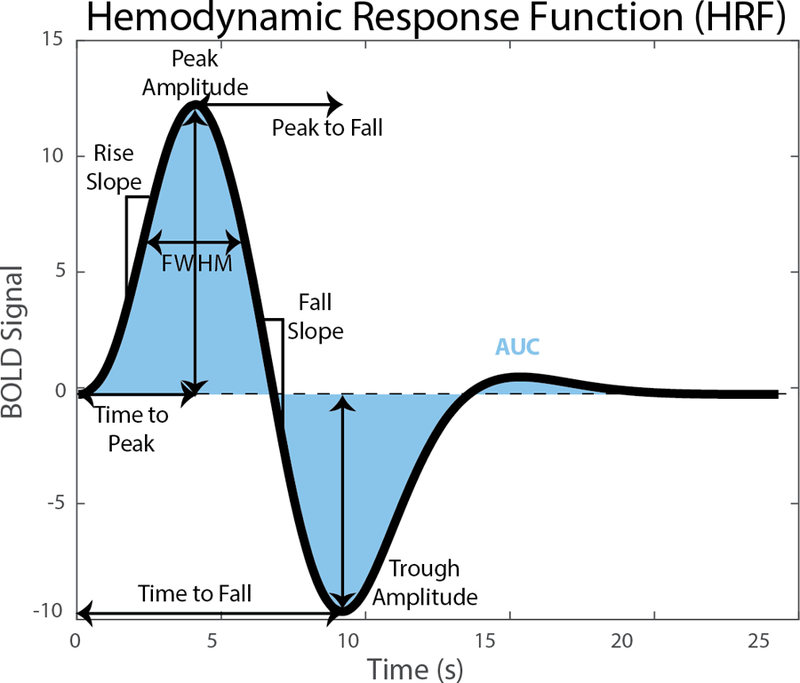
Hemodynamic Response Function (HRF) with visual descriptions of HRF parameters of interest.
To assess ROI influence, two criteria for ROI selection were used: (1) anatomical (occipital, temporal, or LH precentral lobes); (2) significant voxels (whole brain voxel-wise thresholding; p<0.05) masked by the anatomical ROI. Group mean HRF curves from each ROI were calculated from all participants that exhibited a positive peak amplitude. Due to previous research reporting differences in volumes between young and old (Coffey et al., 1992; Ge et al., 2002), and to test for any significant interactions between age and volume, a one-way analysis of covariance (ANCOVA) was conducted with respective ROI volumes as the covariate. To increase power while also controlling for multiple comparisons, a Holm-Bonferroni procedure was used to test for significant age differences of all nine HRF parameters (Holm, 1979). ROI volumes for each participant were mean-centered within group to allow for detection of interactions. Cohen’s d effect sizes were computed using pooled standard deviations adjusted for unequal sample sizes with 95% confidence intervals.
2.4. Monte Carlo Analysis
Considering the inconsistency in HRF shape differences between younger and healthy older groups among studies, we assessed the effect of sample size differences based on those found in the literature. Thus, we performed a Monte Carlo analysis of each HRF parameter (see 2.3 Analysis and Fig 1) using the large population-based sample (see 2.1 Participants). We randomly selected n = 10, 20, 30, 40, 50, 60, and 70 per group to simulate representative sample sizes in literature. Random selection was repeated 10,000 times and significant age-group differences were calculated at each iteration using two-sample independent t-tests (p<0.05). Finally, the probability of finding a significant difference for each sample size was calculated as the number of significant iterations per 10,000 trials.
3. Results
In the occipital ROI, healthy older participants had a delayed and decreased response along with a reduced undershoot and longer return to baseline compared to younger participants (Fig 2A). In the temporal and LH precentral ROIs, we also observed a delayed onset and return to baseline but minimal differences in response amplitude in healthy older participants compared to younger participants (Fig 2B & C). Figs 2D-I display the HRFs from all participants with included participants displayed as colored lines and excluded participants as black lines (See 2.3 Analysis). From these plots it is apparent that only one young participant was excluded for non-significant/negative peak amplitude while there were 14 healthy older participants that displayed a negative response. This illustrates the flexibility of our basis set modelling and suggests that the healthy older group exhibited higher variance and a less canonical HRF response compared to the younger group (D’Esposito et al., 1999). These excluded older participants had no difference in age or task performance compared to the included older participants. Further analysis showed that the lack of supra-threshold BOLD in the ROI of these individuals was due to a significantly higher standard deviation across the timeseries, indicating a noisy signal.
Figure 2.
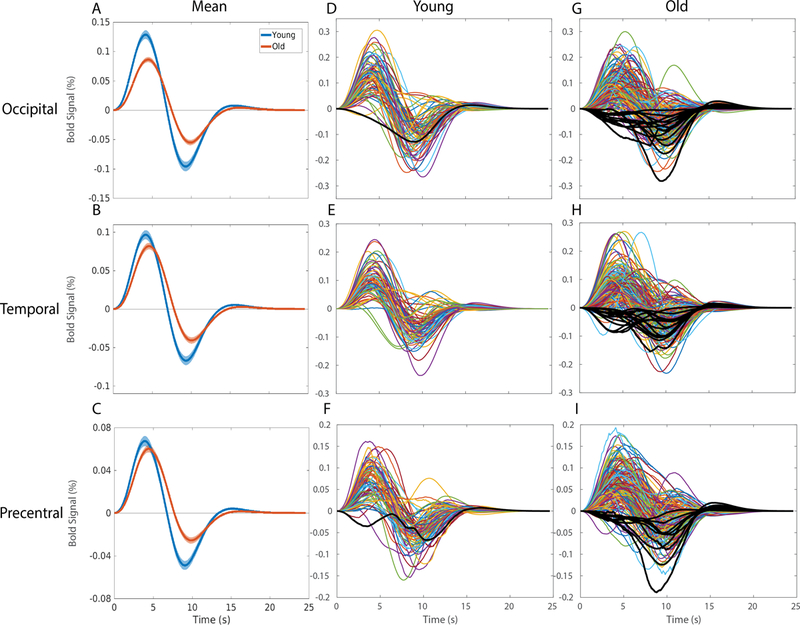
Hemodynamic Response Functions across (blue) young and (orange) healthy older adults in A) the occipital region of interest in response to a checkerboard stimulus for 34 ms, B) the temporal region of interest in response to 300 ms binaural tone at 1200 Hz, and C) the LH precentral region of interest due to right-index finger button-press response with the (solid line) mean and (shading) standard error of the mean. All regions display significant HRF differences between groups. All individual HRF are displayed from (D,E,F) young and (G,H,I) old participants with black lines representing negative response participants removed from further analyses.
Analyses of occipital HRF parameters between younger and healthy older groups showed significant differences in peak amplitude [F(1, 243)=20.90, MSE=0.07 p<.001, d=0.80 (95% CI: 0.52 to 1.08)], time-to-peak [F(1, 243)=8.76, MSE=10.80 p=.003, d=0.55 (95% CI: 0.27 to 0.82)], trough amplitude [F(1, 243)=24.66, MSE=0.07 p<.001, d=0.82 (95% CI: 0.55 to 1.11)], time-to-trough [F(1, 243)=6.27, MSE=27.21 p=.01, d=0.44 (95% CI: 0.16 to 0.71)], rise slope [F(1, 243)=37.32, MSE=0.01 p<.001, d=1.03 (95% CI: 0.74 to 1.31)], and fall slope [F(1, 243)=37.68, MSE=0.01 p<.001, d=1.03 (95% CI: 0.74 to 1.31)] displayed in Fig 3. There were no significant interactions between age-group and occipital ROI volume for any of the HRF parameters.
Figure 3.
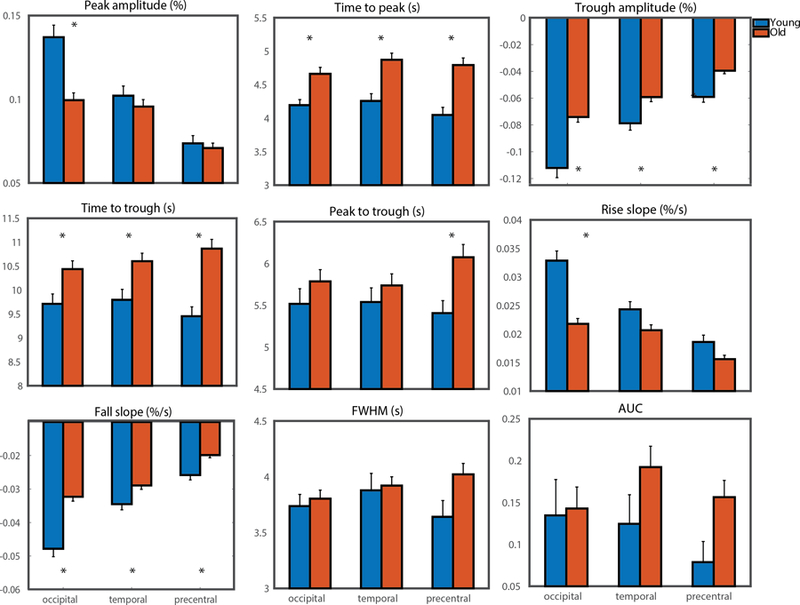
Bar graphs of HRF parameters of interest for (blue) younger and (orange) healthy older adults in the occipital region of interest and the temporal region of interest. (* = significant at Holm-Bonferroni corrected level between groups)
Analyses of temporal HRF parameters between younger and healthy older groups show significant differences in time-to-peak [F(1, 245)=13.54, MSE=19.34 p<.001, d=0.66 (95% CI: 0.38 to 0.93)], trough amplitude [F(1, 245)=9.90, MSE=0.02, p=.002, d=0.54 (95% CI: 0.26 to 0.81)], time-to-trough [F(1, 245)=7.88, MSE=33.95, p=.005, d=0.50 (95% CI: 0.21 to 0.76)], and fall slope [F(1, 245)=7.11, MSE=0.002, p=.008, d=0.46 (95% CI: 0.19 to 0.74)] as displayed in Fig 3. There were no significant interactions between age-group and temporal ROI volume for any of the HRF parameters. There were no significant age-related differences when including only left- or right-hemisphere occipital or temporal lobes compared to the bilateral ROI (See Supplemental Fig 4).
Analyses of LH precentral HRF parameters between younger and healthy older groups show significant differences in time-to-peak [F(1, 250)=16.64, MSE=28.96 p<.001, d=0.74 (95% CI: 0.46 to 1.01)], trough amplitude [F(1, 250)=20.10, MSE=0.02, p<.001, d=0.76 (95% CI: 0.48 to 1.03)], time-to-trough [F(1, 250)=18.97, MSE=104.14, p<.001, d=0.79 (95% CI: 0.51 to 1.07)], peak-to-trough [F(1, 250)=6.84, MSE=23.27, p<.001, d=0.48 (95% CI: 0.20 to 0.75)], and fall slope [F(1, 250)=15.50, MSE=0.002, p<.001, d=0.65 (95% CI: 0.37 to 0.92)] as displayed in Fig 3. There were no significant interactions between age-group and LH precentral ROI volume for any of the HRF parameters.
We considered the potential impact of age-related increases in motion on the current results (D’Esposito et al., 1999; Power et al., 2012; Van Dijk et al., 2012). Rotation parameters were converted from radians to mm (Power et al., 2012) and root mean square (RMS) displacement was calculated from the 6 (3 rotation and 3 translation) realignment parameters from MCFLIRT (see 2.3 Analysis) across all timepoints. Older individuals had significantly higher (p<0.003) RMS displacement (mean = 0.172mm, SEM = 0.009mm) compared to younger individuals (mean = 0.123mm, SEM = 0.013mm). However, all individuals had <0.85mm RMS displacement and >98% of individuals had <0.5mm RMS displacement, which is minimal compared to the 3mm voxel size. Additionally, RMS displacement did not correlate with any of the HRF parameters in either younger or older individuals, suggesting minimal age-related impact of motion on the current data.
To assess the effect that sample-size contributes to discrepant findings in the literature concerning HRF shape differences between younger and healthy older groups, we performed a Monte Carlo analysis (see 2.4 Monte Carlo Analysis). Results are illustrated in Fig 4A for occipital ROI, Fig 4B for temporal ROI, and Fig 4C for LH precentral ROI. These results show the probability of finding a significant difference between younger and healthy older groups for each HRF shape parameter with different sample sizes (i.e., n =10 subjects per group). The range of typical samples sizes in fMRI studies is shaded in gray. Truly non-significant differences between younger and healthy older groups remain relatively flat, near 5%, across sample sizes. The consistency of observing significant age differences in HRF parameters increases as sample size increases but varies considerably across parameters and ROIs. For example, a study aiming to assess potential age differences in peak amplitude in the occipital ROI with n =20 per group, will observe a significant difference (p<0.05) about half of the time. However, with n =60 per group, a truly significant age difference in peak amplitude will be observed > 95% of the time. Thus, sample size makes a significant contribution to detection and characterization of HRF differences between age groups.
Figure 4.
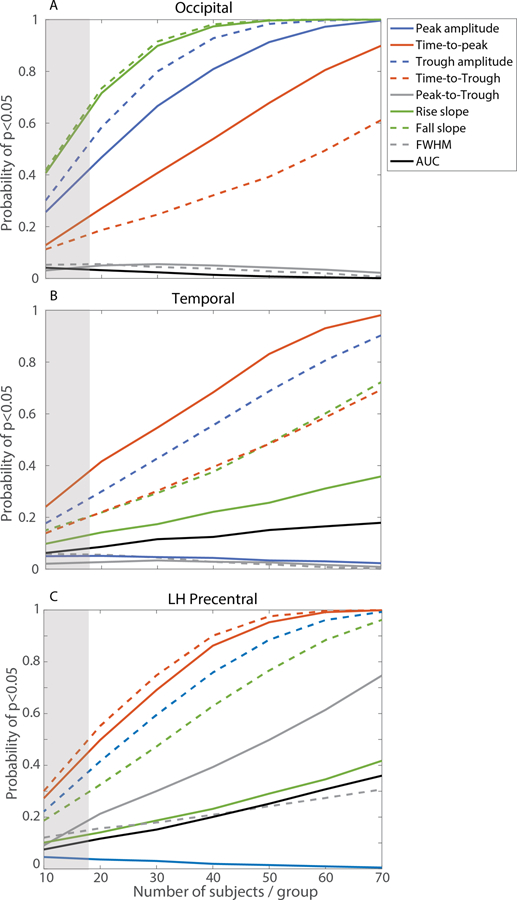
Monte Carlo analysis in (top) occipital, (middle) temporal, and (bottom) left hemisphere precentral regions of interest. Curves display probability from 10,000 iterations of finding a significant difference between healthy young and older adults for each HRF parameter based on sample sizes (typical
Results from statistical analyses of behavioral data from the audio-visual button-press task are displayed in Table 1 and Supplemental Fig 5. There was no significant difference (p>0.59) in reaction time (RT) between younger (mean= 304.78ms, SEM= 7.38ms) and healthy older participants (mean= 309.30ms, SEM= 5.27ms). There was also no significant difference (p>0.75) in accuracy (% correct trials) between younger (mean= 99.17%, SEM= 0.62%) and healthy older participants (mean= 98.99%, SEM= 0.26%). Thus, healthy older participants performance nearly equaled that of younger participants in the sensorimotor task and we did not observe any significant correlations between RT or accuracy with any HRF parameters. Previous work has shown that multisensory integration processing is enhanced in older adults compared to younger adults (Diaconescu et al., 2013). While older adults have more difficulty using selective attention to filter distracting sensory information (Hasher et al., 1991), older adults appear to benefit more from congruent multisensory stimuli. For example, when previously distracting extraneous sensory information becomes task-relevant and helpful, older adults exhibit larger gains and improved task performance. While this multisensory integration hypothesis may explain the lack of age-related behavioral differences, the neural mechanisms remain unclear (Diaconescu et al., 2013; Diederich et al., 2008; Laurienti et al., 2006; Peiffer et al., 2007).
Table 1.
Participant Demographics, Behavioral Data, and Brain Volumes
| Participant Characteristics | Young | Old |
|---|---|---|
| N | 74 | 173 |
| Age (Mean/SD) | 25.41 (3.58) | 63.72 (6.00) |
| Gender (M/F) | 33/40 | 100/73 |
| Reaction Time (mean (SEM); ms) | 304.28 (7.38) | 309.30 (5.17) |
| Accuracy (mean (SEM); % correct) | 99.10 (0.62) | 98.99 (0.26) |
| Grey Matter Volume* | 683,794 mm3 | 599,681 mm3 |
| White Matter Volume* | 461,695 mm3 | 453,3444 mm3 |
| Whole Brain Volume* | 1,176,906 mm3 | 1,083,714 mm3 |
| Occipital ROI Volume* | 92,583 mm3 | 88,279 mm3 |
| Temporal ROI Volume* | 155,455 mm3 | 143,118 mm3 |
| Left Hemisphere Precentral ROI Volume* | 28,525 mm3 | 27,187 mm3 |
Note:
denotes significant difference at p<.05
4. Discussion
In the present study we assessed population-based, age-related changes in BOLD-HRF shape and timing using the sensorimotor functional MRI data from the CamCAN dataset (Shafto et al., 2014). To our knowledge, this is the largest functional neuroimaging study yet to assess age-related changes in BOLD-HRF shape. Most previous cognitive aging studies have utilized the canonical HRF to model the BOLD response, which inherently assumes age-invariant HRF timing and age-equivalent neural-vascular coupling (D’Esposito et al., 2003; Lindquist et al., 2009). To test this assumption, we used FLOBS modeling to minimize a priori assumptions of HRF shape. There were significant age-related HRF differences in the occipital, temporal, and precentral ROIs. There were no significant differences in performance between younger and healthy older participants. Together, these results suggest that age-equivalent HRF modeling assumptions are not tenable, and more importantly, that the HRF is providing information about broad physiologic changes in the aging brain. To wit, age differences in the BOLD response might be a greater reflection of age differences in the neural-vascular coupling unit than simply changes in neural activity (Attwell et al., 2010; Fabiani et al., 2014; Hillman, 2014; Logothetis, 2008, 2010).
In this study we assessed age-differences in HRF shape parameters. We observed age-related decreases in occipital peak amplitude that are consistent with previous studies (Ances et al., 2009; Fabiani et al., 2014; Handwerker et al., 2007; Hutchison et al., 2012; Ross et al., 1997; Tekes et al., 2005; Ward et al., 2015). Theoretically speaking, age-related changes in HRF peak amplitude could reflect alterations in neural activity, glial communication, vascular response, or, more probably, a combination of these. While BOLD data cannot directly assess neural activity, behavioral results from the present study showed age-equivalent performance, suggesting minimal contribution of neural input to the BOLD HRF. Moreover, previous studies have shown minimal or no age-related changes in occipital-cortex neural activity using electroencephalography and magnetoencephalography during simple visual tasks similar to those used here (e.g., Gao et al., 2018; Jorge et al., 2017; Mitchell et al., 1987; Puligheddu et al., 2005). Thus, differences in occipital peak amplitude probably reflect a greater contribution from age-related neural-vascular coupling changes than neural changes. Additionally, known changes to vascular reactivity, tortuosity, and density (Ances et al., 2009; Brown and Thore, 2011; D’Esposito et al., 2003; Farkas and Luiten, 2001; Hillman, 2014), and minimal anatomical age-related differences in the occipital ROI (Fjell et al., 2009; Saunders et al., 1999) provide converging evidence to support the hypothesis of age-related neural-vascular uncoupling in occipital cortex.
Age-related decreases in HRF peak amplitude could reflect decreases in vascular dilation (Devor et al., 2005; Metea and Newman, 2006) or a decreased ratio of extracted oxygen from capillaries relative to neural activity (Griffeth and Buxton, 2011; Hyder et al., 2001; Lu and van Zijl, 2005; Trapp and Stys, 2009). Moreover, MRI research using dual-echo methods, that permit measurement of both neural and vascular BOLD components, provide evidence that, due to its dependence on cerebral blood flow, BOLD does not faithfully reflect neural activity alone in older adults (Hutchison et al., 2012). Thus, age-related differences in BOLD amplitude provide valuable evidence of physiologic changes and probably reflect the integration of changes in the neural, vascular and glial components of the neural-vascular coupling system.
In contrast to the occipital ROI, we did not observe significant peak-amplitude decreases in the temporal or precentral ROIs. Region-specific changes in HRF amplitude have also been observed in other studies (Buckner et al., 2000) suggesting regional variation in age-related vascular, neural, or neural-vascular coupling changes. Using the same CamCAN dataset as we used here, another study also observed similar region-specific age-related signal amplitude differences (Price et al., 2017). A separate study found that hemodynamic alterations accounted for BOLD variability among older participants in some regions but not others (Kannurpatti et al., 2010). Thus, evidence suggests regional variability in both the extent of age-related BOLD amplitude differences and the underlying causes of these differences.
In both the time-to-peak and time-to-trough parameters, we observed age-related delays in the occipital, temporal, and precentral ROIs (Handwerker et al., 2007; Li et al., 2018; Taoka et al., 1998). Previous studies utilizing sensorimotor tasks have suggested that HRF latency reflects age-related vascular alterations (Kannurpatti et al., 2010; Taoka et al., 1998). MEG studies during similar audiovisual tasks have not observed age-related latency differences (Diaconescu et al., 2013; Stephen et al., 2010), suggesting age-equivalent neural activity. In contrast, age-related latency differences were observed in MEG studies from the same CamCAN dataset (Price et al., 2017). That study, however, employed a broader age-range sample than we utilized here, suggesting that latency delays may develop in older samples than those used here. More work is certainly needed to understand age-related changes between neural activity, vascular activity, and latency differences in BOLD.
Overall, the time-to-peak latency of the HRF reflects a delay of the system to reach maximal oxygen perfusion, possibly due to disrupted vasodilatory signals from glial cells (Bonakdarpour et al., 2007; Devor et al., 2005; Metea and Newman, 2006) or reduced efficiency of neuronal oxygen extraction from capillaries (Griffeth and Buxton, 2011; Hyder et al., 2001; Lu and van Zijl, 2005; Trapp and Stys, 2009). Without energy storage, neurons depend on the finely-tuned neural-vascular coupling system to provide the energy resources (O2 and glucose) necessary to maintain high-frequency firing rates and restore membrane potentials (Engl and Attwell, 2015). Thus, age-related latency differences in MEG and HRF data, suggesting delayed neuronal firing and vascular reactivity, might originate from changes to the neural-vascular coupling unit.
There were no significant age differences in the peak-to-trough duration in occipital and temporal ROIs. That is, older adults showed a constant delay with a time-shifted HRF onset but maintain similar duration as younger adults. In the same CamCAN dataset, a constant age-related delay was also observed in MEG data from the visual region, but the auditory response displayed a cumulative delay, wherein response delay increased over time. However, MEG data reflect responses within 200ms of stimulus onset whereas HRF data reflect responses within 2–20 seconds of stimulus onset precluding direct comparison. Thus, although the exact mechanism cannot be elucidated from HRF or MEG data, decreases in amplitude and response latency of the HRF suggest age-related alterations to the neural-vascular coupling system, such as changes in vascular reactivity, oxygen extraction, or glial communication that could affect neural activity.
Age-related HRF differences in the current study are in direct contrast to another similar study in which participants (n = 55 young, 34 old) were presented with visual and auditory stimuli but with additional instructions to attend to only one stimulus (visual or auditory) at a time. That study also included a relatively large sample size and also intended to minimize a priori HRF assumptions using FSL-FLOBS to model the BOLD response (Grinband et al., 2017). However, the HRF for each participant was constrained to originate at 0 and was normalized to peak at 1, which maintains HRF timing differences but removes variation in amplitude. Thus, this manipulation precluded assessment of age differences in peak amplitude and slopes, two parameters our results suggest are important to consider when measuring age-related HRF shape differences. Indeed, as they point out in a post-hoc power analysis, excessively large numbers of subjects would be required to detect differences in parameters that have been constrained a priori to be equal. Despite these manipulations, the authors concluded that neural-vascular coupling is uniquely impervious to aging. Manipulations like these highlight the importance of analysis technique choices and the influences they have on study conclusions and between-study comparisons.
Differences in analysis techniques provide one explanation for discrepancies in the literature in HRF shape. One choice in analysis of fMRI data is ROI selection. Previous work has demonstrated age-related differences in the spatial extent of BOLD response, underscoring the importance of ROI selection in analyses and between-study comparisons (Aizenstein et al., 2004; D’Esposito et al., 1999; Ross et al., 1997). To address this issue, in addition to the anatomical ROI-averaged HRF results presented above, we performed the same analysis including only supra-threshold voxels (See 2.3 Analysis). Including only supra-threshold voxels resulted in increased peak and trough amplitudes compared to anatomical ROI amplitudes, but the same age-related differences for HRF parameters (see Supplemental Figs 2–3). Thus, neither spatial extent nor the proportion of voxels with a negative BOLD response had a significant impact on the HRF characteristics. Nonetheless, these remain important considerations for age- or disease-comparative functional imaging studies.
Differences in whole brain or anatomical ROI volumes could also influence detection of age-related HRF changes. As seen in Table 1, there were significant age-related decreases in whole brain and anatomical ROI volumes, similar to previous studies (Coffey et al., 1992; Ge et al., 2002; Raz et al., 1997). However, when variability due to ROI volume differences was accounted for in each HRF parameter (See 2.3 Analysis; ANCOVA), there were no significant interactions between age and volume. These results suggest that, although volume and HRF characteristics change with age, the effect of age on HRF parameters does not depend on anatomical ROI volume. This relationship might change in the sequelae of age-related disease (Johnson et al., 2000). Age-related atrophy could also influence detection of HRF differences if images are not assessed in native space (Liu et al., 2017). Thus, age-comparative studies that transform images to standard space could bias results, contributing to some of the discrepant findings in the literature.
Differing sample sizes between studies could also contribute to the discrepancies in BOLD literature. The power of a study is in direct relation to the effect size, statistical significance threshold, measurement reliability, and sample size. While effect size is mostly inherent to the contrast of interest, other variables can be controlled using statistical and experimental methods (e.g., sample size; Yarkoni and Braver, 2010). Our Monte Carlo simulations highlight the impact of typical sample sizes (n = 10–17) on the interpretation of BOLD-HRF results (see shaded area in Fig 4; David et al., 2013; Yarkoni and Braver, 2010). For example, these simulations show that, in a study assessing age-differences with 10 participants per group, all HRF parameters would have <50% probability of detecting true significant between-group differences. Thus, according to these simulations, discrepant findings would be expected in a literature consisting of sample sizes of ~10–20 participants. Our analysis shows that, as the number of participants increases, the probabilities of finding significant occipital ROI differences in the HRF parameters asymptote with fewer subjects compared to those probabilities in the temporal ROI, reflecting regional differences in effect sizes. Conversely, age-equivalent HRF parameters (i.e., peak-to-trough) exhibit a greater chance of producing false positives with small sample sizes. Although these results may appear intuitive, they empirically highlight the importance of large-sample size imaging studies (e.g., >50 participants/group) for veridical between-group comparisons. Additionally, there is variability between ROIs in the power of age-related HRF differences. For example, HRF amplitude parameters have more significant age-related differences with smaller sample sizes in the occipital ROI, whereas the HRF time parameters are most significantly different with smaller sample sizes between age groups in the temporal and precentral ROIs. Thus, the current Monte-Carlo simulations provide one explanation for the discrepancies in age-related HRF differences found in the literature.
Overall, careful considerations of HRF analysis techniques, ROI selection, and sample size are needed for the most informative inter-study comparisons of age-differential results. Beyond statistics and methodology, BOLD HRF arises from the finely-tuned interplay between the cellular structures that comprise the neural-vascular coupling system. Age-related alterations in any of the vascular, neural, or glial components of the neural-vascular coupling system could lead to observed changes in the BOLD HRF.
Age differences in the HRF probably do not arise exclusively from age-related changes in neural activity or vascular response. Several studies have shown consistent age-related changes in vascular reactivity, blood flow, and tortuosity (Brown and Thore, 2011; Farkas and Luiten, 2001; Hillman, 2014; Iadecola, 2017; Thore et al., 2007) that, independent of neural activity, could lead to age-related HRF differences (D’Esposito et al., 2003; D’Esposito et al., 1999; Uludağ et al., 2004). Further, one study showed that the relative contributions of neural or vascular age-differences are region specific (Kannurpatti et al., 2010). The numerous underlying physiologic mechanisms that could lead to changes in the shape and timing of the HRF necessitate further investigation with advanced imaging techniques, such as calibrated fMRI. These advanced techniques permit direct assessment of age-differences in the neural and vascular factors underlying BOLD signal (Ances et al., 2009; Gauthier and Hoge, 2012; Hoge et al., 1999; Hubbard et al., 2017; Hutchison et al., 2012; Wise et al., 2013). This work in humans, combined with study of model systems in rodents and primates (Chen et al., 2014; Peters and Sethares, 2002, 2003, 2004), suggests that interpretations of HRF age-differences as reflecting differences in neural activity alone are insufficient to explain the brain-basis of cognitive aging. In light of this new knowledge, more precise interpretations of HRF age-differences can be formulated once the effects of age on the underlying physiologic factors are understood, disentangled, and measured separately.
5. Conclusions
In a large-scale population-based study, we observed differences in the HRF shape and timing between healthy younger and older groups during an audiovisual task. Significant age-related HRF differences without performance differences suggest alterations to the neural-vascular coupling system in healthy aging. These results provide the strongest evidence to date that BOLD should not be interpreted as changes in neural activity alone. Using Monte Carlo simulations, we also demonstrated the impact of small sample-size studies in the current literature on meaningful inter-study conclusions. Studies that aim to elucidate the exact physiological mechanism underlying HRF shape and timing differences will provide new insights of age-related changes in brain function and their relationship to cognitive performance.
Supplementary Material
Supplemental Figure 1. (left) Three eigen-HRF’s from FMRIB’s Linear Optimal Basis Sets (FLOBS) with the largest eigenvalues and (right) their corresponding eigenvalues obtained from singular value decomposition (SVD) on NH =1000 HRF samples of length NT = 560 (resolution = 0.05s).
Supplemental Figure 2. Hemodynamic Response Functions averaged across (blue) young and (orange) healthy older adults in the significant voxels (whole brain voxel-wise thresholding; p<0.05) in a) the occipital region of interest in response to a checkerboard stimulus for 34 ms and in b) the temporal region of interest in response to 300 ms binaural tone at 1200 Hz. Both regions display significant HRF differences between groups.
Supplemental Figure 3. Bar graphs of HRF parameters of interest for (blue) younger and (orange) healthy older adults in the significant voxels (whole brain voxel-wise thresholding; p<0.05) in occipital region of interest and the temporal region of interest. (* = significant at Holm-Bonferroni corrected level between groups)
Supplemental Figure 4. Hemodynamic Response Functions averaged across (blue) young and (orange) healthy older adults in the (top) occipital region of interest in response to a checkerboard stimulus for 34 ms and in (bottom) the temporal region of interest in response to 300 ms binaural tone at 1200 Hz. HRF are displayed for the (left) left hemisphere and (right) right hemisphere of the occipital and temporal lobes, respectively. There are no significant differences within or between groups in unilateral ROIs versus bilateral ROIs (see Fig 2).
Supplemental Figure 5. Mean and SEM of response reaction time (ms) and accuracy (% current trials) in (blue) young and (orange) old participants. There were no significant differences between groups.
Table 2.
Group HRP parameter means (SEM) and/7-values from ANCOVA analyses with effect sizes (d).
| HRF parameter | Young | Old | P | Holm-Bonferroni significance level | d (95% Cl) |
|---|---|---|---|---|---|
| Occipital | |||||
| Peak amplitude | 0.137 (0.007) | 0.099 (0.004) | <.001 | .008 | 0.80 (0.52. 1.08) |
| Time-to-Peak (s) | 4.194 (0.083) | 4.652 (0.096) | .003 | .010 | 0.55 (0.27, 0.82) |
| Trough Amplitude | −0.112 (0.007) | −0.074 (0.004) | <.001 | .007 | 0.82 (0.55, 1.11) |
| Time-to-Trough (s) | 9.711 (0.207) | 10.437(0.173) | .012 | .013 | 0.44 (0.16, 0.71) |
| Peak-to-Trough (s) | 5.517(0.181) | 5.785 (0.141) | .274 | .017 | 0.19 (−0.08, 0.47) |
| Rise Slope | 0.033 (0.002) | 0.022 (0.001) | <.001 | .006 | 1.03 (0.74, 1.31) |
| Fall slope | −0.048 (0.002) | −0.032 (0.001) | <.001 | .006 | 1.03 (0.74, 1.31) |
| Full Width Half Maximum | 3.737 (0.105) | 3.804 (0.077) | .622 | .025 | 0.09 (−0.19, 0.36) |
| Area Under the Curve | 0.135 (0.043) | 0.143 (0.026) | .864 | .050 | 0.03 (−0.24, 0.30) |
| Temporal | |||||
| Peak amplitude | 0.102 (0.006) | 0.096 (0.004) | .381 | .017 | 0.15 (−0.12,0.42) |
| Time-to-Peak (s) | 4.257 (0.109) | 4.866 (0.099) | <.001 | .006 | 0.66 (0.38, 0.93) |
| Trough Amplitude | −0.079 (0.005) | −0.059 (0.003) | .001 | .006 | 0.54 (0.26, 0.81) |
| Time-to-Trough (s) | 9.796 (0.218) | 10.603 (0.166) | .005 | .007 | 0.50 (0.21,0.76) |
| Peak-to-Trough (s) | 5.539 (0.169) | 5.737 (0.139) | .407 | .025 | 0.15 (−0.12,0.42) |
| Rise Slope | 0.024 (0.001) | 0.021 (0.001) | .031 | .010 | 0.37 (0.10, 0.64) |
| Fall slope | −0.035 (0.002) | −0.029 (0.001) | .008 | .008 | 0.46 (0.19, 0.74) |
| Full Width Half Maximum | 3.878 (0.152) | 3.921 (0.079) | .783 | .050 | 0.04 (−0.23, 0.32) |
| Area Under the Curve | 0.125 (0.035) | 0.192 (0.025) | .126 | .013 | 0.27 (−0.01,0.54) |
| Precentral | |||||
| Peak amplitude | 0.074 (0.005) | 0.071 (0.003) | .608 | .050 | 0.09 (−0.19,0.36) |
| Time-to-Peak (s) | 4.048 (0.116) | 4.792 (0.108) | <.001 | .007 | 0.74 (0.46, 1.01) |
| Trough Amplitude | −0.059 (0.004) | −0.040 (0.002) | <.001 | .006 | 0.76 (0.48, 1.03) |
| Time-to-Trough (s) | 9.452 (0.198) | 10.865 (0.193) | <.001 | .006 | 0.79 (0.51, 1.07) |
| Peak-to-Trough (s) | 5.406 (0.150) | 6.073 (0.153) | .009 | .010 | 0.48 (0.20, 0.75) |
| Rise Slope | 0.019(0.001) | 0.016(0.001) | .021 | .013 | 0.39 (0.11,0.66) |
| Fall slope | −0.026 (0.001) | −0.020(0.001) | <.001 | .008 | 0.65 (0.37, 0.92) |
| Full Width Half Maximum | 3.641 (0.146) | 4.021 (0.098) | .034 | .025 | 0.37 (0.09, 0.64) |
| Area Under the Curve | 0.079 (0.025) | 0.156 (0.020) | .028 | .017 | 0.40 (0.12, 0.67) |
Acknowledgements
This work was supported by the National Institutes of Health (1R01AG047972 to BR), and the National Multiple Sclerosis Society (RG150704951 to BR). Data collection and sharing for this project was provided by the Cambridge Centre for Ageing and Neuroscience (CamCAN). CamCAN funding was provided by the UK Biotechnology and Biological Sciences Research Council (grant number BB/H008217/1), together with support from the UK Medical Research Council and University of Cambridge, UK. The content does not necessarily reflect the position or the policy of the Federal government or the sponsoring agencies, and no official endorsement should be inferred.
References
- Aizenstein HJ, Clark KA, Butters MA, Cochran J, Stenger VA, Meltzer CC, Reynolds CF, Carter CS, 2004. The BOLD hemodynamic response in healthy aging. Journal of cognitive neuroscience 16, 786–793. [DOI] [PubMed] [Google Scholar]
- Ances BM, Liang CL, Leontiev O, Perthen JE, Fleisher AS, Lansing AE, Buxton RB, 2009. Effects of aging on cerebral blood flow, oxygen metabolism, and blood oxygenation level dependent responses to visual stimulation. Human brain mapping 30, 1120–1132. [DOI] [PMC free article] [PubMed] [Google Scholar]
- Attwell D, Buchan AM, Charpak S, Lauritzen M, MacVicar BA, Newman EA, 2010. Glial and neuronal control of brain blood flow. Nature 468, 232–243. [DOI] [PMC free article] [PubMed] [Google Scholar]
- Bonakdarpour B, Parrish T, Thompson C, 2007. Hemodynamic response function in patients with stroke-induced aphasia: implications for fMRI data analysis. Neuroimage 36, 322–331. [DOI] [PMC free article] [PubMed] [Google Scholar]
- Boynton GM, Engel SA, Glover GH, Heeger DJ, 1996. Linear systems analysis of functional magnetic resonance imaging in human V1. Journal of Neuroscience 16, 4207–4221. [DOI] [PMC free article] [PubMed] [Google Scholar]
- Brant LJ, Fozard JL, 1990. Age changes in pure‐tone hearing thresholds in a longitudinal study of normal human aging. The Journal of the Acoustical Society of America 88, 813–820. [DOI] [PubMed] [Google Scholar]
- Brodtmann A, Puce A, Syngeniotis A, Darby D, Donnan G, 2003. The functional magnetic resonance imaging hemodynamic response to faces remains stable until the ninth decade. Neuroimage 20, 520–528. [DOI] [PubMed] [Google Scholar]
- Brown WR, Thore CR, 2011. Cerebral microvascular pathology in ageing and neurodegeneration. Neuropathology and applied neurobiology 37, 56–74. [DOI] [PMC free article] [PubMed] [Google Scholar]
- Buckner RL, Snyder AZ, Sanders AL, Raichle ME, Morris JC, 2000. Functional brain imaging of young, nondemented, and demented older adults. Journal of cognitive neuroscience 12, 24–34. [DOI] [PubMed] [Google Scholar]
- Buracas GT, Boynton GM, 2002. Efficient design of event-related fMRI experiments using M-sequences. Neuroimage 16, 801–813. [DOI] [PubMed] [Google Scholar]
- Cauli B, Hamel E, 2010. Revisiting the role of neurons in neurovascular coupling. Frontiers in neuroenergetics 2, 9. [DOI] [PMC free article] [PubMed] [Google Scholar]
- Chen BR, Kozberg MG, Bouchard MB, Shaik MA, Hillman EM, 2014. A critical role for the vascular endothelium in functional neurovascular coupling in the brain. Journal of the American Heart Association 3, e000787. [DOI] [PMC free article] [PubMed] [Google Scholar]
- Coffey C, Wilkinson W, Parashos L, Soady S, Sullivan R, Patterson L, Figiel G, Webb M, Spritzer C, Djang W, 1992. Quantitative cerebral anatomy of the aging human brain A cross‐sectional study using magnetic resonance imaging. Neurology 42, 527–527. [DOI] [PubMed] [Google Scholar]
- Cunnington R, Iansek R, Bradshaw JL, Phillips JG, 1995. Movement-related potentials in Parkinson’s disease: presence and predictability of temporal and spatial cues. Brain 118, 935–950. [DOI] [PubMed] [Google Scholar]
- D’Esposito M, Deouell LY, Gazzaley A, 2003. Alterations in the BOLD fMRI signal with ageing and disease: a challenge for neuroimaging. Nature Reviews Neuroscience 4, 863. [DOI] [PubMed] [Google Scholar]
- D’Esposito M, Zarahn E, Aguirre GK, Rypma B, 1999. The effect of normal aging on the coupling of neural activity to the bold hemodynamic response. Neuroimage 10, 6–14. [DOI] [PubMed] [Google Scholar]
- David SP, Ware JJ, Chu IM, Loftus PD, Fusar-Poli P, Radua J, Munafò MR, Ioannidis JP, 2013. Potential reporting bias in fMRI studies of the brain. PloS one 8, e70104. [DOI] [PMC free article] [PubMed] [Google Scholar]
- Davis TL, Kwong KK, Weisskoff RM, Rosen BR, 1998. Calibrated functional MRI: mapping the dynamics of oxidative metabolism. Proceedings of the National Academy of Sciences 95, 1834–1839. [DOI] [PMC free article] [PubMed] [Google Scholar]
- Desikan RS, Ségonne F, Fischl B, Quinn BT, Dickerson BC, Blacker D, Buckner RL, Dale AM, Maguire RP, Hyman BT, 2006. An automated labeling system for subdividing the human cerebral cortex on MRI scans into gyral based regions of interest. Neuroimage 31, 968–980. [DOI] [PubMed] [Google Scholar]
- Devor A, Ulbert I, Dunn AK, Narayanan SN, Jones SR, Andermann ML, Boas DA, Dale AM, 2005. Coupling of the cortical hemodynamic response to cortical and thalamic neuronal activity. Proceedings of the National Academy of Sciences of the United States of America 102, 3822–3827. [DOI] [PMC free article] [PubMed] [Google Scholar]
- Diaconescu AO, Hasher L, McIntosh AR, 2013. Visual dominance and multisensory integration changes with age. Neuroimage 65, 152–166. [DOI] [PubMed] [Google Scholar]
- Diederich A, Colonius H, Schomburg A, 2008. Assessing age-related multisensory enhancement with the time-window-of-integration model. Neuropsychologia 46, 2556–2562. [DOI] [PubMed] [Google Scholar]
- Engl E, Attwell D, 2015. Non‐signalling energy use in the brain. The Journal of physiology 593, 3417–3429. [DOI] [PMC free article] [PubMed] [Google Scholar]
- Fabiani M, Gordon BA, Maclin EL, Pearson MA, Brumback-Peltz CR, Low KA, McAuley E, Sutton BP, Kramer AF, Gratton G, 2014. Neurovascular coupling in normal aging: a combined optical, ERP and fMRI study. Neuroimage 85, 592–607. [DOI] [PMC free article] [PubMed] [Google Scholar]
- Farkas E, Luiten PG, 2001. Cerebral microvascular pathology in aging and Alzheimer’s disease. Progress in neurobiology 64, 575–611. [DOI] [PubMed] [Google Scholar]
- Fischl B, Van Der Kouwe A, Destrieux C, Halgren E, Ségonne F, Salat DH, Busa E, Seidman LJ, Goldstein J, Kennedy D, 2004. Automatically parcellating the human cerebral cortex. Cerebral Cortex 14, 11–22. [DOI] [PubMed] [Google Scholar]
- Fjell AM, Westlye LT, Amlien I, Espeseth T, Reinvang I, Raz N, Agartz I, Salat DH, Greve DN, Fischl B, 2009. High consistency of regional cortical thinning in aging across multiple samples. Cerebral Cortex 19, 2001–2012. [DOI] [PMC free article] [PubMed] [Google Scholar]
- Gao Y, Huber C, Sabel BA, 2018. Stable Microsaccades and Microsaccade-Induced Global Alpha Band Phase Reset Across the Life Span. Investigative ophthalmology & visual science 59, 2032–2041. [DOI] [PubMed] [Google Scholar]
- Gauthier CJ, Hoge RD, 2012. Magnetic resonance imaging of resting OEF and CMRO2 using a generalized calibration model for hypercapnia and hyperoxia. Neuroimage 60, 1212–1225. [DOI] [PubMed] [Google Scholar]
- Ge Y, Grossman RI, Babb JS, Rabin ML, Mannon LJ, Kolson DL, 2002. Age-related total gray matter and white matter changes in normal adult brain. Part I: volumetric MR imaging analysis. American journal of neuroradiology 23, 1327–1333. [PMC free article] [PubMed] [Google Scholar]
- Griffeth VE, Buxton RB, 2011. A theoretical framework for estimating cerebral oxygen metabolism changes using the calibrated-BOLD method: modeling the effects of blood volume distribution, hematocrit, oxygen extraction fraction, and tissue signal properties on the BOLD signal. Neuroimage 58, 198–212. [DOI] [PMC free article] [PubMed] [Google Scholar]
- Grinband J, Steffener J, Razlighi QR, Stern Y, 2017. BOLD neurovascular coupling does not change significantly with normal aging. Human brain mapping 38, 3538–3551. [DOI] [PMC free article] [PubMed] [Google Scholar]
- Handwerker DA, Gazzaley A, Inglis BA, D’Esposito M, 2007. Reducing vascular variability of fMRI data across aging populations using a breathholding task. Human brain mapping 28, 846–859. [DOI] [PMC free article] [PubMed] [Google Scholar]
- Hasher L, Stoltzfus ER, Zacks RT, Rypma B, 1991. Age and inhibition. Journal of experimental psychology: Learning, memory, and cognition 17, 163. [DOI] [PubMed] [Google Scholar]
- Hesselmann V, Weber OZ, Wedekind C, Krings T, Schulte O, Kugel H, Krug B, Klug N, Lackner KJ, 2001. Age related signal decrease in functional magnetic resonance imaging during motor stimulation in humans. Neuroscience letters 308, 141–144. [DOI] [PubMed] [Google Scholar]
- Hillman EM, 2014. Coupling mechanism and significance of the BOLD signal: a status report. Annual review of neuroscience 37, 161–181. [DOI] [PMC free article] [PubMed] [Google Scholar]
- Hirano Y, Stefanovic B, Silva AC, 2011. Spatiotemporal evolution of the functional magnetic resonance imaging response to ultrashort stimuli. Journal of Neuroscience 31, 1440–1447. [DOI] [PMC free article] [PubMed] [Google Scholar]
- Hoge RD, Atkinson J, Gill B, Crelier GR, Marrett S, Pike GB, 1999. Investigation of BOLD signal dependence on cerebral blood flow and oxygen consumption: the deoxyhemoglobin dilution model. Magnetic resonance in medicine 42, 849–863. [DOI] [PubMed] [Google Scholar]
- Holm S, 1979. A simple sequentially rejective multiple test procedure. Scandinavian journal of statistics, 65–70.
- Hubbard NA, Turner M, Hutchison JL, Ouyang A, Strain J, Oasay L, Sundaram S, Davis S, Remington G, Brigante R, 2016. Multiple sclerosis-related white matter microstructural change alters the BOLD hemodynamic response. Journal of Cerebral Blood Flow & Metabolism 36, 1872–1884. [DOI] [PMC free article] [PubMed] [Google Scholar]
- Hubbard NA, Turner MP, Ouyang M, Himes L, Thomas BP, Hutchison JL, Faghihahmadabadi S, Davis SL, Strain JF, Spence J, 2017. Calibrated imaging reveals altered grey matter metabolism related to white matter microstructure and symptom severity in multiple sclerosis. Human brain mapping 38, 5375–5390. [DOI] [PMC free article] [PubMed] [Google Scholar]
- Huettel SA, Singerman JD, McCarthy G, 2001. The effects of aging upon the hemodynamic response measured by functional MRI. Neuroimage 13, 161–175. [DOI] [PubMed] [Google Scholar]
- Hutchison JL, Lu H, Rypma B, 2012. Neural mechanisms of age-related slowing: the ΔCBF/ΔCMRO2 ratio mediates age-differences in BOLD signal and human performance. Cerebral Cortex 23, 2337–2346. [DOI] [PMC free article] [PubMed] [Google Scholar]
- Hyder F, Kida I, Behar KL, Kennan RP, Maciejewski PK, Rothman DL, 2001. Quantitative functional imaging of the brain: towards mapping neuronal activity by BOLD fMRI. NMR in Biomedicine 14, 413–431. [DOI] [PubMed] [Google Scholar]
- Iadecola C, 2017. The neurovascular unit coming of age: a journey through neurovascular coupling in health and disease. Neuron 96, 17–42. [DOI] [PMC free article] [PubMed] [Google Scholar]
- Jenkinson M, Bannister P, Brady M, Smith S, 2002. Improved optimization for the robust and accurate linear registration and motion correction of brain images. Neuroimage 17, 825–841. [DOI] [PubMed] [Google Scholar]
- Jenkinson M, Beckmann CF, Behrens TE, Woolrich MW, Smith SM, 2012. Fsl. Neuroimage 62, 782–790. [DOI] [PubMed] [Google Scholar]
- Johnson SC, Saykin AJ, Baxter LC, Flashman LA, Santulli RB, McAllister TW, Mamourian AC, 2000. The relationship between fMRI activation and cerebral atrophy: comparison of normal aging and Alzheimer disease. Neuroimage 11, 179–187. [DOI] [PubMed] [Google Scholar]
- Jorge MS, Spindola L, Katata JHB, Anghinah R, 2017. Alpha band EEG coherence in healthy nonagenarians. Arquivos de neuro-psiquiatria 75, 609–613. [DOI] [PubMed] [Google Scholar]
- Kannurpatti SS, Motes MA, Rypma B, Biswal BB, 2010. Neural and vascular variability and the fMRI-BOLD response in normal aging. Magnetic resonance imaging 28, 466–476. [DOI] [PMC free article] [PubMed] [Google Scholar]
- Laurienti PJ, Burdette JH, Maldjian JA, Wallace MT, 2006. Enhanced multisensory integration in older adults. Neurobiology of aging 27, 1155–1163. [DOI] [PubMed] [Google Scholar]
- Li Y, Wu P, Lu J, Chu Y, Hsu Y, Lin F, 2018. Inter-Regional BOLD Latency Reactivity Calibration is Correlated to Reaction Time [Abstract]. International Society of Magnetic Resonance in Medicine, Paris, France
- Lindquist MA, Loh JM, Atlas LY, Wager TD, 2009. Modeling the hemodynamic response function in fMRI: efficiency, bias and mis-modeling. Neuroimage 45, S187–S198. [DOI] [PMC free article] [PubMed] [Google Scholar]
- Liu X, Gerraty RT, Grinband J, Parker D, Razlighi QR, 2017. Brain atrophy can introduce age‐related differences in Bold response. Human brain mapping 38, 3402–3414. [DOI] [PMC free article] [PubMed] [Google Scholar]
- Logothetis NK, 2008. What we can do and what we cannot do with fMRI. Nature 453, 869. [DOI] [PubMed] [Google Scholar]
- Logothetis NK, 2010. Neurovascular uncoupling: much ado about nothing. Frontiers in neuroenergetics 2, 2. [DOI] [PMC free article] [PubMed] [Google Scholar]
- Lu H, van Zijl P, 2005. Experimental measurement of extravascular parenchymal BOLD effects and tissue oxygen extraction fractions using multi‐echo VASO fMRI at 1.5 and 3.0 T. Magnetic resonance in medicine 53, 808–816. [DOI] [PubMed] [Google Scholar]
- Martindale J, Mayhew J, Berwick J, Jones M, Martin C, Johnston D, Redgrave P, Zheng Y, 2003. The hemodynamic impulse response to a single neural event. Journal of Cerebral Blood Flow & Metabolism 23, 546–555. [DOI] [PubMed] [Google Scholar]
- Metea MR, Newman EA, 2006. Glial cells dilate and constrict blood vessels: a mechanism of neurovascular coupling. Journal of Neuroscience 26, 2862–2870. [DOI] [PMC free article] [PubMed] [Google Scholar]
- Mitchell K, Howe J, Spencer S, 1987. Visual evoked potentials in the older population: age and gender effects. Clinical Physics and Physiological Measurement 8, 317. [DOI] [PubMed] [Google Scholar]
- Ogawa S, Lee TM, 1990. Magnetic resonance imaging of blood vessels at high fields: in vivo and in vitro measurements and image simulation. Magnetic resonance in medicine 16, 9–18. [DOI] [PubMed] [Google Scholar]
- Peiffer AM, Mozolic JL, Hugenschmidt CE, Laurienti PJ, 2007. Age-related multisensory enhancement in a simple audiovisual detection task. Neuroreport 18, 1077–1081. [DOI] [PubMed] [Google Scholar]
- Peters A, Sethares C, 2002. Aging and the myelinated fibers in prefrontal cortex and corpus callosum of the monkey. Journal of Comparative Neurology 442, 277–291. [DOI] [PubMed] [Google Scholar]
- Peters A, Sethares C, 2003. Is there remyelination during aging of the primate central nervous system? Journal of Comparative Neurology 460, 238–254. [DOI] [PubMed] [Google Scholar]
- Peters A, Sethares C, 2004. Oligodendrocytes, their progenitors and other neuroglial cells in the aging primate cerebral cortex. Cerebral Cortex 14, 995–1007. [DOI] [PubMed] [Google Scholar]
- Power JD, Barnes KA, Snyder AZ, Schlaggar BL, Petersen SE, 2012. Spurious but systematic correlations in functional connectivity MRI networks arise from subject motion. Neuroimage 59, 2142–2154. [DOI] [PMC free article] [PubMed] [Google Scholar]
- Price D, Tyler LK, Henriques RN, Campbell K, Williams N, Treder M, Taylor J, Brayne C, Bullmore ET, Calder AC, 2017. Age-related delay in visual and auditory evoked responses is mediated by white-and grey-matter differences. Nature communications 8, 15671. [DOI] [PMC free article] [PubMed] [Google Scholar]
- Puligheddu M, de Munck JC, Stam CJ, Verbunt J, de Jongh A, van Dijk BW, Marrosu F, 2005. Age distribution of MEG spontaneous theta activity in healthy subjects. Brain topography 17, 165–175. [DOI] [PubMed] [Google Scholar]
- Raichle ME, 1998. Behind the scenes of functional brain imaging: a historical and physiological perspective. Proceedings of the National Academy of Sciences 95, 765–772. [DOI] [PMC free article] [PubMed] [Google Scholar]
- Raz N, Gunning FM, Head D, Dupuis JH, McQuain J, Briggs SD, Loken WJ, Thornton AE, Acker JD, 1997. Selective aging of the human cerebral cortex observed in vivo: differential vulnerability of the prefrontal gray matter. Cerebral cortex (New York, NY: 1991) 7, 268–282. [DOI] [PubMed] [Google Scholar]
- Richter W, Richter M, 2003. The shape of the fMRI BOLD response in children and adults changes systematically with age. Neuroimage 20, 1122–1131. [DOI] [PubMed] [Google Scholar]
- Riecker A, Grodd W, Klose U, Schulz JB, Gröschel K, Erb M, Ackermann H, Kastrup A, 2003. Relation between regional functional MRI activation and vascular reactivity to carbon dioxide during normal aging. Journal of Cerebral Blood Flow & Metabolism 23, 565–573. [DOI] [PubMed] [Google Scholar]
- Rosengarten B, Aldinger C, Spiller A, Kaps M, 2003. Neurovascular coupling remains unaffected during normal aging. Journal of Neuroimaging 13, 43–47. [PubMed] [Google Scholar]
- Ross M, Yurgelun-Todd D, Renshaw P, Maas L, Mendelson J, Mello N, Cohen B, Levin J, 1997. Age-related reduction in functional MRI response to photic stimulation. Neurology 48, 173–176. [DOI] [PubMed] [Google Scholar]
- Rypma B, D’Esposito M, 2001. Age-related changes in brain–behaviour relationships: Evidence from event-related functional MRI studies. European Journal of Cognitive Psychology 13, 235–256. [Google Scholar]
- Saunders DE, Howe FA, van den Boogaart A, Griffiths JR, Brown MM, 1999. Aging of the adult human brain: in vivo quantitation of metabolite content with proton magnetic resonance spectroscopy. Journal of Magnetic Resonance Imaging: An Official Journal of the International Society for Magnetic Resonance in Medicine 9, 711–716. [DOI] [PubMed] [Google Scholar]
- Schroeter ML, Schmiedel O, von Cramon DY, 2004. Spontaneous low-frequency oscillations decline in the aging brain. Journal of Cerebral Blood Flow & Metabolism 24, 1183–1191. [DOI] [PubMed] [Google Scholar]
- Shafto MA, Tyler LK, Dixon M, Taylor JR, Rowe JB, Cusack R, Calder AJ, Marslen-Wilson WD, Duncan J, Dalgleish T, 2014. The Cambridge Centre for Ageing and Neuroscience (Cam-CAN) study protocol: a cross-sectional, lifespan, multidisciplinary examination of healthy cognitive ageing. BMC neurology 14, 204. [DOI] [PMC free article] [PubMed] [Google Scholar]
- Smith SM, 2002. Fast robust automated brain extraction. Human brain mapping 17, 143–155. [DOI] [PMC free article] [PubMed] [Google Scholar]
- Stephen JM, Knoefel JE, Adair J, Hart B, Aine CJ, 2010. Aging-related changes in auditory and visual integration measured with MEG. Neuroscience letters 484, 76–80. [DOI] [PMC free article] [PubMed] [Google Scholar]
- Taoka T, Iwasaki S, Uchida H, Fukusumi A, Nakagawa H, Kichikawa K, Takayama K, Yoshioka T, Takewa M, Ohishi H, 1998. Age correlation of the time lag in signal change on EPI-fMRI. Journal of Computer Assisted Tomography 22, 514–517. [DOI] [PubMed] [Google Scholar]
- Taylor JR, Williams N, Cusack R, Auer T, Shafto MA, Dixon M, Tyler LK, Henson RN, 2017. The Cambridge Centre for Ageing and Neuroscience (Cam-CAN) data repository: structural and functional MRI, MEG, and cognitive data from a cross-sectional adult lifespan sample. Neuroimage 144, 262–269. [DOI] [PMC free article] [PubMed] [Google Scholar]
- Tekes A, Mohamed MA, Browner NM, Calhoun VD, Yousem DM, 2005. Effect of age on visuomotor functional MR imaging1. Academic radiology 12, 739–745. [DOI] [PubMed] [Google Scholar]
- Thore CR, Anstrom JA, Moody DM, Challa VR, Marion MC, Brown WR, 2007. Morphometric analysis of arteriolar tortuosity in human cerebral white matter of preterm, young, and aged subjects. Journal of neuropathology and experimental neurology 66, 337–345. [DOI] [PubMed] [Google Scholar]
- Trapp BD, Stys PK, 2009. Virtual hypoxia and chronic necrosis of demyelinated axons in multiple sclerosis. The Lancet Neurology 8, 280–291. [DOI] [PubMed] [Google Scholar]
- Turner MP, Hubbard NA, Sivakolundu DK, Himes LM, Hutchison JL, Hart J, Spence J, Frohman E, Frohman T, Okuda D, 2018. Preserved canonicality of the BOLD hemodynamic response reflects healthy cognition: Insights into the healthy brain through the window of multiple sclerosis. Neuroimage [DOI] [PMC free article] [PubMed]
- Uludağ K, Dubowitz DJ, Yoder EJ, Restom K, Liu TT, Buxton RB, 2004. Coupling of cerebral blood flow and oxygen consumption during physiological activation and deactivation measured with fMRI. Neuroimage 23, 148–155. [DOI] [PubMed] [Google Scholar]
- Van Dijk KR, Sabuncu MR, Buckner RL, 2012. The influence of head motion on intrinsic functional connectivity MRI. Neuroimage 59, 431–438. [DOI] [PMC free article] [PubMed] [Google Scholar]
- Ward LM, Aitchison RT, Tawse M, Simmers AJ, Shahani U, 2015. Reduced haemodynamic response in the ageing visual cortex measured by absolute fNIRS. PloS one 10, e0125012. [DOI] [PMC free article] [PubMed] [Google Scholar]
- Wise RG, Harris AD, Stone AJ, Murphy K, 2013. Measurement of OEF and absolute CMRO2: MRI-based methods using interleaved and combined hypercapnia and hyperoxia. Neuroimage 83, 135–147. [DOI] [PMC free article] [PubMed] [Google Scholar]
- Woolrich MW, Behrens TE, Smith SM, 2004. Constrained linear basis sets for HRF modelling using Variational Bayes. Neuroimage 21, 1748–1761. [DOI] [PubMed] [Google Scholar]
- Woolrich MW, Ripley BD, Brady M, Smith SM, 2001. Temporal autocorrelation in univariate linear modeling of FMRI data. Neuroimage 14, 1370–1386. [DOI] [PubMed] [Google Scholar]
- Yarkoni T, Braver T, 2010. Handbook of Individual Differences in Cognition Springer; New York, NY. [Google Scholar]
- Yeşilyurt B, Uğurbil K, Uludağ K, 2008. Dynamics and nonlinearities of the BOLD response at very short stimulus durations. Magnetic resonance imaging 26, 853–862. [DOI] [PubMed] [Google Scholar]
- Zou P, Helton KJ, Smeltzer M, Li C-S, Conklin HM, Gajjar A, Wang WC, Ware RE, Ogg RJ, 2011. Hemodynamic responses to visual stimulation in children with sickle cell anemia. Brain imaging and behavior 5, 295–306. [DOI] [PMC free article] [PubMed] [Google Scholar]
Associated Data
This section collects any data citations, data availability statements, or supplementary materials included in this article.
Supplementary Materials
Supplemental Figure 1. (left) Three eigen-HRF’s from FMRIB’s Linear Optimal Basis Sets (FLOBS) with the largest eigenvalues and (right) their corresponding eigenvalues obtained from singular value decomposition (SVD) on NH =1000 HRF samples of length NT = 560 (resolution = 0.05s).
Supplemental Figure 2. Hemodynamic Response Functions averaged across (blue) young and (orange) healthy older adults in the significant voxels (whole brain voxel-wise thresholding; p<0.05) in a) the occipital region of interest in response to a checkerboard stimulus for 34 ms and in b) the temporal region of interest in response to 300 ms binaural tone at 1200 Hz. Both regions display significant HRF differences between groups.
Supplemental Figure 3. Bar graphs of HRF parameters of interest for (blue) younger and (orange) healthy older adults in the significant voxels (whole brain voxel-wise thresholding; p<0.05) in occipital region of interest and the temporal region of interest. (* = significant at Holm-Bonferroni corrected level between groups)
Supplemental Figure 4. Hemodynamic Response Functions averaged across (blue) young and (orange) healthy older adults in the (top) occipital region of interest in response to a checkerboard stimulus for 34 ms and in (bottom) the temporal region of interest in response to 300 ms binaural tone at 1200 Hz. HRF are displayed for the (left) left hemisphere and (right) right hemisphere of the occipital and temporal lobes, respectively. There are no significant differences within or between groups in unilateral ROIs versus bilateral ROIs (see Fig 2).
Supplemental Figure 5. Mean and SEM of response reaction time (ms) and accuracy (% current trials) in (blue) young and (orange) old participants. There were no significant differences between groups.