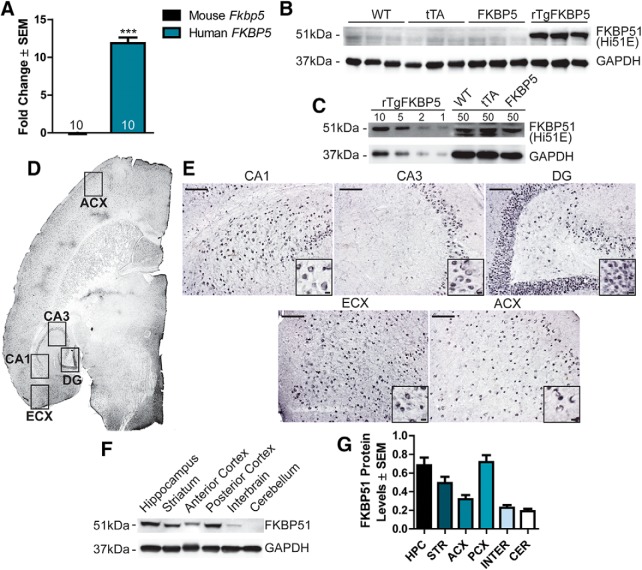
Figure 2.
FKBP51 expression and distribution in rTgFKBP5 mice. A, Expression of human and mouse FKBP5 in rTgFKBP5 mice expressed as fold change ± SEM compared to WT mice using qPCR; ***p < 0.001 by t test (N = 10) with three technical replicates. B, Western blotting showing FKBP51 levels in the hippocampus from rTgFKBP5, WT, FKBP5, and tTA mice. C, Western blotting showing levels of FKBP51 levels in the rTgFKBP5 hippocampus from 1 to 10 µg of protein loaded compared to 50 µg of protein from WT or FKBP51 mice. GAPDH levels are shown to confirm protein load. See Extended Data Figure 2-1 for more information on the antibody. D, 20× images of anti-FKBP51 staining from rTgFKBP5 mice. The entorhinal cortex (ECX), anterior cortex (ACX), CA1, CA3, and dentate gyrus (DG) are labeled. E, 20× images of anti-FKBP51 staining from rTgFKBP5 mice in the CA1, CA3, DG, ECX, and ACX. Scale bar = 100 µm; 10 µm (inset). F, Western blotting showing FKBP51 levels in the hippocampus, striatum, ACX, posterior cortex (PCX), interbrain, thalamus and hypothalamus, and cerebellum of a rTgFKBP5 mouse. G, Quantitation of FKBP51 proteins levels throughout the hippocampus (HPC), striatum (STR), ACX, PCX, interbrain, thalamus and hypothalamus (INTER), and cerebellum (CER), of rTgFKBP5 mice from multiple exposures.

