

Abstract
Human induced pluripotent stem cells (iPSCs) provide a renewable supply of patient-specific and tissue-specific cells for cellular and molecular studies of disease mechanisms. Combined with advances in various omics technologies, iPSC models can be used to profile the expression of genes, transcripts, proteins, and metabolites in relevant tissues. Recently, large panels of iPSC lines have been derived from hundreds of genetically heterogeneous individuals, further enabling genome-wide mapping to identify co-expression networks and elucidate gene regulatory networks. Here we review recent developments in omics profiling various molecular phenotypes, and the emergence of human iPSCs as a systems biology model of human diseases.
Keywords: induced pluripotent stem cells, disease modeling, transcriptomics, proteomics, systems biology
1. Introduction
The advent of iPSCs has transformed biomedical research (1) by allowing primary cells from individual donors to be reprogrammed to their pluripotent state that is virtually identical to embryonic stem cells (2). Reliable methods now exist to de-differentiate adult donor cells into iPSCs with minimal mutations and genome instability (3), and to further direct their differentiation into human tissue types. Current protocols can create with high efficiency and purity cells in the nervous system (4), the heart (5, 6), the liver (7), the vasculature (8, 9), and other tissues. Further work has refined differentiation protocols to derive precise cellular subtypes, including motor vs. sensory neurons (4, 10), and ventricular cardiac myocytes vs. pacemaker cells (11–13). These breakthroughs have sparked novel preclinical applications of iPSCs. With the en masse production of iPSC-derived allogeneic human cells, preclinical cell-based or cell-free therapies have been performed to restore tissue function by directly administering the cells or their secreted factors into sites of injury (14, 15). In parallel, iPSC-derived cells are used as patient surrogates in molecular screening to discover new therapeutic compounds (16, 17) or to assess their pharmacokinetics and safety (18, 19). But arguably, the most transformative applications of iPSCs have been in modeling the origin and development of human diseases (20, 21). With genetic diseases in particular, iPSCs carrying the exact genetic backgrounds of patients offer an attractive route to study diseased tissues directly. Patient-specific iPSC-derived cells have been studied in cardiomyopathies (21–24) and arrhythmias (25–27), pulmonary hypertension (28), and neurodegenerative disorders (29, 30), and have led to new insights into the cellular processes disrupted in these disease processes.
In parallel, advances in next generation sequencing and mass spectrometry technologies in the past decade have fundamentally altered how biological molecules are interrogated on a large scale. RNA sequencing (RNA-seq) has become ubiquitous for measuring the output of gene expression in experimental models (31, 32), and with recent technologies has been extended to measuring full-length transcripts (33) or gene expression in single cells (34, 35). Mass spectrometry-based proteomics in turn allows large-scale quantification of protein expression (36, 37), protein post-translational modifications (38, 39), and metabolite profiles (40). Transcript expression, proteins, metabolites, and other “intermediary” molecular phenotypes provide mechanistic information connecting genes to traits of interest (41–43), such that potential pathogenic mechanisms can be broadly discovered in unbiased manners from differential expression analysis in disease models. The availability of large-scale omics data has spurred systems biology approaches, which aim to connect observed phenotypes to omics changes at scale such that their underlying regulatory networks can be revealed (42, 44).
Owing to their ability to reproduce individual-specific and tissue-specific molecular expression profiles, iPSC models have proven to be particularly suited for omics experiments (45). One advantage is the ability to circumvent the inaccessibility of primary tissues, especially cardiac and neuronal cells, so that representative transcripts, proteins, and metabolites can be procured for high-throughput quantitative experiments. Discoveries can further be tested in identical live cells, such as using gene editing techniques to introduce variants (46, 47). More recently, omics approaches in iPSCs have been extended to large donor cohorts, where the natural variability in human populations is leveraged to uncover the genetic architecture connecting natural variants to observable traits.
2. Omics methods to quantify molecular and cellular phenotypes
Epigenome and chromatin structure
Unlike the genome, which is largely uniform across cells in the body, molecular phenotypes such as chromatin landscapes, gene expression, and protein profiles are highly dynamic and cell-specific.
Epigenomic factors including DNA methylation, transcription factor binding, enhancer-promoter contact, chromatin accessibility and chromatin structure have been shown to critically regulate gene expression and may in fact be mechanistically responsible for the function of some GWAS variants in intergenic regions. In addition, it is now known that the interphase genome folds like an origami into a defined three-dimensional shape that determines cell type specification and gene expression. Two notable technologies have emerged to assay chromatin structure, including Chromatin Conformation Capture (3C) and its derivatives for assaying long-range interactions and chromatin topology (48), and Assay for Transposase Accessible Chromatin with Sequencing (ATAC-seq) for identifying open and accessible chromatin region (49). 3C and its derivative techniques employ formaldehyde crosslinking to physically join together DNA in proximity, then use the proximity library for high-throughput DNA-sequencing to discern the three-dimensional structure of chromatin and long range interactions (48). These studies have generally found that human chromosomes are partitioned into Mb-sized topologically associated domains, in which genes tend to be coregulated and which could be classified as active or inactive. A number of extensions of these methods including Chromatin Interaction Analysis by Paired-End Tag Sequencing (ChIA-PET) and 3C-coupled Chromatin Immunoprecipitation (Hi-ChIP) further simplify the method and produce more targeted data, by immunoprecipitation of crosslinked DNA using particular proteins of interest to identify long-range contact associated with each protein factor (50). ATAC-seq uses a hyperactive prokaryotic Tn5 transposable to sequence accessible chromatin regions that are open to the transposase (49). ATAC-seq has gained in popularity as it provides a sensitive method to sequence open chromatin regions in native chromatin while requiring significantly fewer cells than previous methods (49).
In iPSC models, ATAC-seq has been applied to discover epigenomic changes during differentiation processes. There appears to be a general correlation between genome-wide transcriptome and chromatin accessibility, for instance, during directed cardiomyocyte differentiation (51), where transcription factor binding motifs including those for TBX, JUN, and STAT3 families progressively became more open at the chromatin level to activate of cardiac-specific gene regulatory networks. Moreover, the binding status of epigenetic factors including the histone methyltransferases has been shown to be important for regulating directed differentiation (52). In iPSC-derived neurons, ATAC-seq shows that open chromatin regions can be used to generate testable hypotheses on the function of genome-wide association study (GWAS)-implicated psychiatric risk variants in non-coding regions (53).
Transcriptome and single-cell gene expression
Enabled by next-generation DNA sequencers, RNA-seq has supplanted earlier microarrays to allow routine quantitation of transcripts in biological samples (31, 32). Latest high-throughput sequencers from Illumina and other manufacturers can generate billions of sequences from a single experiment thanks to the massively parallel nature of sequencing reactions. Deducing the sequence of messenger RNAs with these sequencers allows rapid quantitative assessment of the expression of tens of thousands of transcripts within a cell or tissue sample. Measurements of bulk RNA expression on a large scale are now commonly deployed to query gene expression in iPSC-derived cells. From RNA-seq data, clustering and unsupervised classification analyses are commonly used to determine specific groups of genes or pathways that may be changed when comparing diseased over normal cells, and thus implicating their potential importance in disease origin or in explaining observed cellular pathologies. RNA-seq also provides context to functions of gene variants in association studies and can be used for fine-mapping and identification of causal variants, as well as the potential mechanisms by which they affect traits. Many GWAS variants function as expression quantitative trait loci (eQTLs) by affecting transcript level whereas other, exonic, variants affect splicing ratios that can likewise be discerned using RNA sequencing (54).
Single-cell RNA sequencing (scRNA-seq) is a recent development for resolving transcriptional heterogeneity within cell populations by allowing transcript expression from single cells to be characterized. Its emergence was driven by technical advances in constructing and amplifying sequencing libraries from the miniscule amounts of RNA, as well as microfluidic contraptions that allow separation of individual cells. To date, three major scRNA-seq approaches are in popular use. The first involves plate-based protocols that place individual cells into wells. The second involves automated microfluidic platforms that capture individual cells on microfluidic chips. The third involves droplet-based massively parallel technique (Table 1).
Table 1:
Comparison of common single-cell analysis techniques
| Technology | Microfluidic-based (e.g. Fluidigm C1) | Droplet-based (e.g. Drop-seq, inDrop) | Plate-based (e.g. SMART-seq, SMART-seq2) | Pooled approaches (e.g. CEL-seq2, MARS-seq) | Mass cytometry (e.g., CyTOF) |
|---|---|---|---|---|---|
| Molecule target | RNA | Protein | |||
| Single-cell separation/ library construction principle | Align and separate cells in microfluidic channels based on size | Using emulsion chemistry to construct separate libraries within each droplet | Deposit cells into individual wells of physical 96- or 384- well plates | Single-cell barcoding is combined with FACS or microfluidic-based cell sorting | Tag single cells with antibodies conjugated with heavy metal isotopes; separate by flow cytometry |
| Detection principle | RNA sequencing | RNA sequencing | RNA sequencing | RNA sequencing | Elemental mass spectrometry |
| Advantages and disadvantages | (+) Works well with homogeneous populations (+) Commercially available (–) High cost and input cell number requirement (–) Can only analyze up to 96–300 cells per experiment (–) Large-scale experiments are not feasible (–) Inadvertent multiplet capture |
(+) Unbiased cell capture (+) Massive parallelization of 800–10,000 cells per experiment (+) Does not require cell sorting (–) Reduced sensitivity and transcript recovery (–) Restricted to analysis of cells smaller in size than droplet diameter |
(+) Unbiased cell capture (+) Fast and efficient way to capture 50 to 500 single cells (+) Single cells can be stored in plates long-term (+) Generalizable, can analyze cells of any shape or size (–) Experimental protocol can introduce technical noise (–) Low sensitivity and high cost |
(+) Increased target cell number (500–2,000 cells) per experiment (+) Decreased labor and reagent costs with higher sensitivity |
(+) Acquires protein-level information or cell-surface expression
information (–) Requires compatible antibodies for targets (–) Only analyzes ~50–100 markers per cell |
Plate-based techniques such as SMART-Seq offer a fast and efficient method to analyze 50 to 500 single cells in one experiment with flexible experimental set-up (55). Current plate-based techniques boast increased accuracy and short processing time, and are compatible with automation by liquid-handling robotics. They also allow cells of any morphology and size to be analyzed and can read up to 5,000–10,000 genes per single cell. Commercially available, automated microfluidic platform (Fluidigm C1) allows 96 individual cells to be captured at a time on a microfluidic chip. It offers the option to evaluate the captured cells under the microscope before reverse transcription and is effective for comparison of homogeneous cell populations. However, the cost of reagents remains high and >10,000 cells are required as input, rendering analysis of rare or small cell populations possible only when multiple samples are pooled. Ineffective automated sorting of cells into singlets also has been reported, in which multiplets are falsely analyzed as single cells. To overcome such limitations, cell expression by linear amplification and sequencing (CEL-seq) has been developed by combining the two technologies (56). CEL-seq applies molecular barcode to cells at early stages, lowering the reagent cost and increasing the cell number per sample to 500 to 2,000 cells. Subsequently, massively parallel scRNA-seq (MARS-seq) has also been developed by combining single-cell barcoding with 384-well-plate fluorescence-activated cell sorting (FACS) to increase the scale and lower the costs (57). These pooled techniques allow the isolation of various cell types and enhanced throughput. Finally, droplet-based scRNA-seq can tackle tens of thousands of single cells per sample, using barcoded complementary DNAs to label single cells encapsulated in individual droplets (58).
Insights into single-cell transcriptomes have revealed hidden heterogeneity in cell types and cell states (59, 60), decoded dynamic processes and developmental timelines (61, 62), and uncovered disease markers that are masked when averaged in bulk sequencing (59, 63). In iPSC models, scRNA-seq has been used to understand spatial and temporal heterogeneity of reprogramming (64) and differentiation (65), and to identify novel surface markers for enrichment of induced cardiomyocytes (65). Machine-learning algorithms have also been used to predict functional states of iPSC-derived neurons based on single-cell transcriptomes, in which a combination of scRNA-seq and patch-clamping analyses allowed prediction of neuronal physiology and identified biomarkers for electrophysiologically active neurons (66).
Proteome and proteoforms
Although the central dogma dictates that information encoded in proteins derives from nucleic acids, the expression of proteins, and by extension the metabolites they catalyze, is poorly correlated with the expression of transcripts in many systems. In some instances, changes in transcript explain only 10–40% of protein expression changes (67, 68). This non-correlation is partly attributable to the fact that protein abundance is controlled by both the rate of production and degradation. Whereas the rate of production scales with transcript abundance, the rate of degradation is influenced by post-translational factors including ubiquitin ligase activity that cannot be easily modeled from transcripts alone (69–71). A comprehensive model of molecular signatures therefore requires the integration of protein- and transcript-level inquiries (71, 72). Moreover, the functional state of the proteome in a cell is only fully described in higher dimensionality space, such as the localization, structure, modification, turnover dynamics of protein molecules (73), hence there is interest in assaying these molecular parameters as well. However, proteome analysis is a challenging endeavor. The ~20,000 genes in the human genome can produce up to 6 million different protein species due to the addition of conformational, splicing, or chemically modified isomers sometimes referred to as proteoforms (74). The dynamic range of concentration across protein species is also far greater than transcripts, where the most abundant protein can be ten trillion (1013) times more abundant than the rarest species in some samples (75).
Two prevalent approaches to quantify proteomes are affinity-based proteomics and tandem mass spectrometry (Table 2). For affinity-based proteomics using antibodies, mass cytometry/CyTOF approaches multiplex protein detection by attaching up to 134 metal isotopes to target-specific antibodies (76), which can then be resolved by elemental mass spectrometry (77). As with antibodies, aptamer probes operate by specific molecular affinity to target antigens. Unlike immunoglobulins, aptamer probes are made of specifically designed nucleic acid sequences, which fold into specific shapes to bind to targets, and can be further modified to include hydrophobic motifs to enhance protein binding (78). An advantage of aptamers is that the probes can be easily synthesized de novo, and the selection of high-affinity probes can be automated by successive rounds of in vitro enrichment. Recent applications have employed aptamers to analyze hundreds of samples to identify protein markers of myocardial infarcts (79) and the retrospective cause of torcetrapib toxicity in a clinical trial (80). These assays are attractive for large clinical or population-based studies because they are commercially accessible and scalable, allowing over a thousand proteins to be quantified in hundreds of samples to be quantified with little prior expertise or investments needed. They have also been successfully demonstrated to yield multi-protein marker panels that can predict cardiovascular risks (81, 82).
Table 2:
Comparisons of proteomics technologies
| Technology | Mass spectrometry-based proteomics | Affinity-based proteomics | ||||
|---|---|---|---|---|---|---|
| Approach | Bottom-up DDA (shotgun) | Bottom-up DIA | Bottom-up targeted (PRM/MRM/SRM) | Top-down | Antibody arrays | Aptamer arrays |
| Peptide/protein identification principle | Measures m/z of precursor and select for fragmentation | Fragments m/z windows and assign fragments to multiple peptides | Program instrument to monitor only specific precursor/fragment transition pairs | Measures m/z of intact proteins to discover proteoforms | Recognize antigen epitopes using immunoglobulins | Recognize antigen epitopes using nucleic acid |
| Advantages and disadvantages | (+) High protein coverage than other mass spec methods | (+) Higher reproducibility than DDA and higher throughput than targeted methods | (+) Higher sensitivity than other mass spec. methods | (+) Unique capability to identify isoforms and combinatorial modifications | (+) Lower cost than other affinity-based methods | (+) Higher coverage than other affinity-based methods |
| (+) Can be adapted to protein modifications and different species or
proteoforms (+) High specificity (–) Requires hefty initial investment and access to technical expertise (–) Sensitivity not as good as affinity approach |
(+) Ease and commercial availability (+) High sensitivity (–) Specificity is uncertain (–) Requires dedicated reagents for each target |
|||||
In tandem mass spectrometry, the accurate masses of tryptic peptides within a biological sample are measured and the peptides are fragmented in a predictable manner. The resulting tandem mass spectrum is computationally matched to theoretical spectrum generated from genomic sequences to identify the peptide sequence. The performance of proteomics experiments has steadily increased with the availability of advanced Orbitrap (83) and time-of-flight (84) mass spectrometers that feature high mass resolution and scan speed. Parallel to instrumentation advances, there has also been recent progresses in data acquisition methodologies. Conventional data-dependent “shotgun” acquisition (DDA) has continued to be optimized in its sample processing chemistry and sampling regimen, and can now reliably quantify virtually complete proteomes (10,000+ proteins), both in human cultured cells (36) and in more challenging tissues such as sub-anatomical regions of primary human heart (37). Data independent acquisition (DIA) methods such as Sequential Windowed Acquisition of All Theoretical Fragment Ion Mass Spectra (SWATH-MS) instruct the mass spectrometer to systematically queue all detectable ions in the parent MS scan for fragmentation rather than being triggered by top-abundance ions. With modern fast-scanning instruments, DIA can overcome stochasticity in peptide detection and allow the same proteins to be targeted reliably in consecutive experiments (69, 85, 86). Recent DIA applications have demonstrated consistently quantification of over 4,000 proteins across experiments in a manner that is reproducible across laboratories and operators with low CV (87). Tandem mass spectrometry has the advantage of being a universal analyzer that can be readily applied to identify neoantigens, post-translational modifications (74), protein interactions (88), novel isoforms (89), and proteins from any species.
In iPSC models, the power of mass cytometry to detect multiple surface protein markers in single cells has led to discovery of markers of early stages of iPSC reprogramming that are absent both in the starting fibroblasts and reprogrammed iPSCs (90, 91). Mass spectrometry-based proteomics has also been widely utilized, including to identify cell surface glycoproteome markers for differentiating iPSC-derived hepatocytes that may be used for cell purification (92). A recent study used tandem mass spectrometry to measure protein expression in 16 iPSC lines, and identified that donor specific differences in expression profiles remain discernible at the proteome levels (93).
Metabolome and exposome
Metabolomics concerns the study of small molecules including amino acids, α-keto acids, fatty acids, acylcarnitines, medium and long chain acyl-CoAs, and other lipids and organic acids, which are absorbed and released by cell types in the body. The Human Metabolome Database (HMDB) lists over 105 known metabolites, which include endogenous circulating metabolites in body fluids as well as xenobiotics such as metabolites from foodstuff and environmental pollutants (94). Environmental exposures including small molecules and other factors that can modulate disease risk and disease development have been termed the “exposome” of an individual. The gut microbiome also interacts with the microbiome by metabolizing small molecules, some of which have been found to directly influence disease risks (95). Tandem mass spectrometry is also one of the principal techniques alongside nuclear magnetic resonance (NMR) for the large-scale discovery of metabolites and lipids. These two techniques are complementary; whereas NMR can measure metabolites in nondestructive manner in live biological specimens, mass spectrometry has higher sensitivity and throughput. When combined with stable isotope analogues of metabolites, mass spectrometry can also calculate the rate of flux of metabolites through metabolic pathways.
In iPSC models, mass spectrometry metabolomics profiling can be used to identify mechanisms in disease models, for example to implicate oxidative stress and mitochondrial dysfunction in Pompe disease (96). For cell therapy research, metabolomic profiles of the cell culture medium of iPSC-derived cardiomyocyte under oxygen depletion revealed hypoxic responses involving ketogenesis, ketolysis, and methylglyoxal-related metabolism (97). Metabolomic profiling was also performed on a large panel of iPSC-hepatocytes to investigate the mechanism through which a GWAS variant operates on metabolic diseases, discovering a clear association between the risk allele at the implicated locus with variations in lipid synthesis in iPSC-derived hepatocytes. More importantly, this association was cell-type specific and was not found in iPSCs or adipocytes, corroborating the importance of measuring functional phenotypes in cells relevant to the tissue of interest (7)
Phenome and live cell functions
The complement of patient phenotypes is sometimes called the “phenome” to mirror the concept of the genome. The phenotypes of iPSC-derived cells can likewise be measured as the in vitro “phenome” and “exposome”, which often cannot be directly observed from patient records or archived primary tissues. These phenotypes are useful for association mapping with molecular profiles to identify the molecular pathways and genetic variants that control variations of functional traits.
For iPSC-derived excitable cells such as cardiomyocytes and neurons, their action potential duration, velocity, and amplitude, depolarization curve, resting membrane potential, and individual ion currents can be measured using multielectrode arrays (98), voltage-sensitive optical reporters (99), or patch clamps (100, 101). L-type Ca2+ currents and intracellular Ca2+ store (102) can be measured with calcium-sensitive fluorescence imaging (102, 103). These electrophysiological parameters are sensitive to individual donor differences, arrhythmias (26, 27), cytotoxicity (19), cardiomyopathies (104, 105) and neuronal pathologies (103). From contractile cells such as derived myocytes, the amplitude and kinetics of contraction can be measured by video imaging microscopy (106, 107) or electrical impedance (108). Their contractile force can be measured by atomic force microscopy (109), physical microposts (110), or substrate displacement (111), which decreases as expected in cardiomyopathy models (109, 112), mimicking clinical observations. Structurally, sarcomere lengths and widths can be measured by microscopy, and have been shown to alter expectedly in dilated cardiomyopathy models (105).
Functions of the endothelium and the vasculature can be modeled by iPSC-derived endothelial cells and smooth muscle cells in tests for morphology, nitric oxide (NO) production, migration, and proliferation; these functional values can change in accordance to endothelial dysfunction in diseases like pulmonary arterial hypertension (28) and diabetes (113). Finally, other measurable parameters include cellular functions as related to metabolism (114), energetics (22), oxidative stress (115), cell death, and proliferation.
3. Using large iPSC panels for network biology
Systems biology approaches using omics data
Many common disorders including coronary artery diseases and neurodegenerative diseases arise from the interactions of complex genetic and environmental factors. Omics experiments suggest that even simple stimuli can trigger the differential expression of a plethora of genes (116), which poses questions on the overall contribution of individual targets or pathways. GWAS results further show that variants contributing to complex traits are scattered relatively evenly and ubiquitously across chromosomes in the genome, and hence many traits may in fact be conceptualized as being “omnigenic” (117). This complexity has prompted interest in systems biology and network biology approaches, which take cues from the study of complex systems and attempt to model biological phenomena as the products of interacting molecular networks. Contrary to conventional single-target approaches, systems-wide approaches assume that genes function within the context of networks, in which members within a network module collectively function as a critical unit to define cell state and function (118). An example of a gene network is the cellular pluripotency network involving NANOG, OCT4, SOX2 and other genes. The functional state of the network cannot be reduced to any one gene (119), and the comparative analysis of a single gene is insufficient to define the network (120).
The topology of molecular networks can be inferred from large-scale surveys of its components prior to and after perturbations, then fitted to suitable models (43, 116, 118). In practice, two approaches have been demonstrated in iPSC models to define the relationships across genes (Figure 2), namely (i) the association of genetic variants and molecular profiles (QTL studies) to unravel gene regulatory networks and (ii) the identification of correlated expression profiles among modules of genes (co-expression networks). Other types of biological networks, including physical protein-protein interaction networks (121, 122) and cell-cell interactions (123), also exist and await investigation in iPSC models.
Figure 2. Identify disease networks using QTL and co-expression analysis.
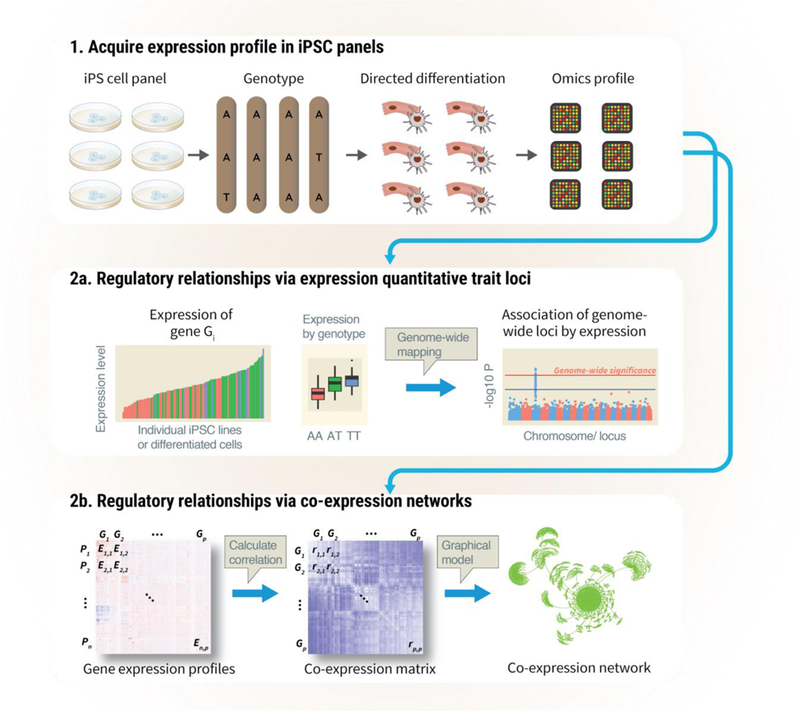
1. Gene variants and expression profiles are acquired in large iPSC panels. 2a. QTL studies use of genetic variants as a causality anchor to map out relationships between genes and traits (gene regulatory networks). 2b. Co-expression network modeling take advantage of co-variation in expression profiles of functionally related genes across individuals to generate hypotheses on the underlying regulations of genetic program.
Capturing individual variabilities in iPSC panels
eQTL analysis finds associations between genetic variants in a population and the expression levels of transcripts (124). From this association, eQTL studies infer the genes and variants that regulate gene expression in particular cell types. It is thought that many GWAS variants modulate the expression levels of particular genes, hence eQTLs often provide a mechanistic layer to explain how GWAS variants influence complex traits and to discern gene regulatory networks (43). Because of the accessibility of blood samples, many initial human eQTL studies were performed using transcript expression profiles from blood cells (124). Although informative, these studies did not capture all regulatory variants that are associated with traits of interests. Whereas many eQTLs are conserved across tissues (125), other regulate gene expression in tissue-specific manners, due in part to the unique physiological cues or chromatin landscapes in each cell type. This has motivated studies that leverage RNA-seq datasets from archived tissues; for instance, the Gene-Tissue Expression Consortium (GTEx) dataset on 44 tissues across 449 human donors (32, 126) allowed the genetic architectures of separate tissues to be examined. A drawback of archived tissues, however, is that interesting variants cannot be easily followed, because live cell materials are not available from expired donors.
Human iPSCs provide an alternative route to discern tissue-specific genetic architecture and also allow results to be validated in individual-specific live cells. Initial comparisons of inter-individual vs. intra-individual variations of RNA-seq data confirmed that iPSC lines made from individual donors can be reliably distinguished apart using RNA-seq profiles (127–129), and that such individual differences in RNA-seq are sufficient to predict patient-specific phenotypes such as drug response (127). A study compared 12 iPSC lines from female breast cancer patients undergoing doxorubicin treatment, and found that iPSC-derived cardiomyocytes recapitulated individual differences in drug cardiotoxicity that may be explained by individual RNA-seq profiles (19). It is generally observed that genetic differences between individuals are preserved in iPSCs regardless of origin cells used for reprogramming (128, 129), suggesting the architectures of gene regulatory networks may be reproduced with sufficient finesse to model individual variance in gene expression within even larger populations.
An early hurdle of using large iPSC panel for association mapping was the lack of consistent and scalable methods to produce sufficient number of cell lines from large cohorts. Moreover, reprogramming and culturing conditions can create additional, non-genetic, sources of variance (130, 131). Although on the other hand, iPSC models eschew some variances in primary tissue analysis such as individual life history and environmental exposure, the overall variability of gene expression in iPSCs is thought to be greater than that in primary tissues (132). Because technical variances can mask biological signals, association studies using iPSCs require large N numbers to achieve sufficient power for discovery. It has been estimated that 40 to 80 or more lines are needed to detect regulatory variants with large effect size in a given gene (132), and hundreds of lines are expected to be needed to discover QTLs with moderate effects. Recently large human iPSC panels have emerged to compare iPSC lines from hundreds of donors with healthy versus diseased backgrounds. This development was enabled by advances in reprogramming and culturing protocols (133–135), quality control (136–138), and high-throughput production methods (136, 139), which increased the throughput of generating high-quality iPSCs.
Several consortia have been established to create iPSC panels from diverse donors, particularly for cardiovascular, metabolic, and neurobiology research (140). The National Heart, Lung, and Blood Institute (NHLBI) NextGen Consortium (141) was launched in 2011 to create iPSC libraries of thousands of multiethnic donors to study left ventricular hypertrophy, long QT syndrome, insulin resistance, and sickle cell anemia (141–143). The European Union StemBANCC/IMI initiative aims to generate 1,500 lines from 500 individuals including healthy and diabetic donors (140). The HipSci consortium funded by the UK Medical Research Council and Wellcome Trust aims to established ~1,000 cell lines from healthy and diseased individuals (93) and to differentiate them into functional neurons. Complementing these efforts, more iPSC libraries have been established in biobanks at Stanford Cardiovascular Institute, Cedars-Sinai, Allen Institute and other institutes around the globe to capture patient cohorts and ensure iPSC panels are representative of diverse populations (144).
Several landmark studies have been published on iPSC panels from hundreds of individual donors. One early finding is the conclusive demonstration that iPSC lines preserve the genetic variability and architecture of individual donors (93, 132, 143, 145). Because the cohort designs of these studies involve hundreds of donors as well as multiple iPSC clones per donor, comparisons can be made on variations of gene expression that exist across individuals (biological differences) and variations across lines from identical donors (technical variation). Comparisons of gene expression suggest that intra-individual clones cluster much more closely than inter-individual lines and that inter-individual variations account for 10 to 50% of differences in transcript expression (93, 132, 143), confirming the findings of early smaller-scale studies (127). However, significant intra-individual heterogeneity was also evident that explains almost 50% of gene expression variability. These residual variances are attributable, to various extents, to differences in reprogramming method (133), culturing condition (93, 143), batch effect (93, 143), donor gender (93), cell passage number (93), cell type of origin of iPSC cells (128, 146), and other unexplained sources. Curiously, the respective contributions of biological and technical variances appear to be gene-specific, with donor differences being the largest contributor of variance in ~50% of genes (93). Genes with the highest intra-individual variance were strongly enriched for developmental function whereas housekeeping genes had low variance (143), suggesting that reprogramming variability preferentially affects certain genes and that a network model may be used to unearth gene modules associated with reprogramming errors. A recent HipSci study further confirmed that iPSCs preserve individual differences at the epigenome and proteome level (93).
Identifying regulatory networks from genetic variants in iPSC models
A second major finding is the demonstration that iPSC panels capture sufficient variability across individuals to power association mapping and identify eQTLs. One study in iPSC panels identified over 4,000 eQTLs and rediscovered loci from GTEx tissue studies (143). Another study, somewhat unexpectedly, found that the power to discover eQTL regulated genes in iPSCs was in fact comparable to that in somatic tissues under identical sample size (93). Remarkably, up to one-third of iPSC eQTLs appear to be specific to iPSCs and are not found in other somatic tissues (93). These iPSC-specific eQTLs preferentially affect regulatory networks in stem cells and early development, including binding motifs for NANOG and other pluripotency factors (93, 147). They also appear to be significantly enriched in variants implicated in macroscopic GWAS traits, thus helping to connect some GWAS loci to eQTLs of genes of interest, including telomerase reverse transcriptase in cancer (93). Moreover, up to three quarters of these tissue-specific eQTL-regulated genes are controlled by a different set of variants in other tissues (i.e., their tissue specificity was not due to gene non-expression in other tissues) (93), therefore strongly indicating that gene expression can be controlled by different regulatory networks in different tissues. In corroboration, many iPSC eQTLs have been found not only adjacent to transcription start sites of the genes they regulate, but also next to enhancers and promoters (143). Because enhancers and promoters are highly cell-specific, this corroborates the utility of using human-specific differentiated cells to identify regulatory elements that are critical to traits of interest in relevant tissues.
Indeed, with the pluripotency of iPSC, systems-level inquiries are readily extended to differentiated cell types to uncover genes that contribute to individual variability in tissue-specific phenotypes. The “iPSCORE” study provided proof-of-concept of connecting molecular and cellular traits in differentiated cardiovascular cells. The study used a panel of publicly available iPSC from 222 ethnically diverse individuals including 39 individuals with heart diseases (arrhythmia or cardiomyopathies) (148). Genotyping indicated that the panel contains risk/benefit alleles for up to 95% of the SNPs implicated in GWAS, including multiple SNPs associated with coronary artery disease. Following directed differentiation of 7 lines into iPSC-cardiomyocytes, gene expression profiling showed that iPSC-derived cardiomyocyte gene expression profiles clustered by genetic background, and identified variants associated with cellular phenotypes including beat rates and electrophysiological measurements (148).
For metabolic traits, one NextGen study differentiated 86 iPSC lines into hepatocytes (145). RNA-seq in both cell types allowed the assessment of tissue specificity of regulatory networks, and identified eQTL genes that were specific to iPSCs, iPSC-derived hepatocytes, or common to both. Hepatocyte-specific eQTL genes are enriched in the regulation of cholesterol levels. The study further uncovered novel associations between hepatocyte-regulated genes and lipid metabolism that were not found in primary tissue analysis in GTEx, including CPNE1 and ANGPTL3 (145). In parallel, one HipSci study differentiated iPSC lines from 100 donors to sensory neurons (132) and performed RNA-seq to identify eQTLs on ~3,800 genes in sensory neurons, approximately a quarter of which were again novel and not found in GTEx. In addition, RNA-seq and ATAC-seq data from the same study enabled the discovery of neuron-specific splicing QTLs and quantitative chromatin accessibility QTLs. The identified expression, splicing, and chromatin accessibility variants overlapped with GWAS hits for neuronal traits, thereby demonstrating that large-scale RNA-seq and ATAC-seq in iPSC panels can provide valuable mechanistic contexts for GWAS findings (132).
Identifying co-expression networks in iPSC models
In addition to QTL mapping, co-expression analysis represents another approach to query the structure of gene networks (42, 118). Co-expression network analysis is predicated on the assumption that under selection, an efficient genetic program will evolve with an organization such that genes that work together physically or functionally should come to be co-regulated by the cell. The analysis asks which genes tend to have their expression levels cluster together across individuals under homeostatic vs. stimulated conditions, the result of which is used to infer functionally co-regulated genes (155). Further inference may be drawn by introducing constraints to co-regulated genes, either by seeding a network based on prior knowledge on “gold standard” regulatory relationships, or by making additional assumptions on the behavior and structure of the network (155, 156). The constructed correlation network can be combined with probabilistic causal modeling to predict directionality of network edges and identify driver genes. Bayesian networks are frequently employed to predict that, based on their variance across all samples, which one of a cohort of co-expressed gene is statistically more likely to influence the expression of the other genes.
In iPSC models, consensus co-expression networks from multiple transcriptomics datasets have been leveraged to determine cell identity and guide iPSC engineering and differentiation (157). RNA-seq data from iPSC panel have also leveraged co-expression network analysis. In one study comparing 300 iPSC lines, the expression variance that was not explained by eQTLs was found to derive mostly from targets of the polycomb repressive complex, suggesting that epigenetic regulation from chromatin remodeling is a major factor in reprogramming reproducibility (143). Co-expression analysis was subsequently performed to to infer a probabilistic causal network, identifying a number of key drivers that causally affect the expression levels of developmental pathways in iPSCs, namely GATA4, GATA6, EOMES, FOXQ1, CER1, APOA2, and LINC00261, notably with the first five also being known polycomb targets (143). In the same study, causal network inference also nominated HOXA5 and HOXC10 as likely key driver genes that can influence the endothelial differentiation potential of the cells (143). Interestingly, the contribution of the polycomb repressive complex to differentiation variability was corroborated in an independent comparison of gene expression profiles of iPSCs generated with different reprogramming methods (lentivirus, sendai virus, episomal, mRNA, minicircles, or mRNA/miRNA) (133).
Finally, scRNA-seq is opening new avenues to co-expression network analysis. Individual cells can regulate transcription based on stochastic heterogeneity in cell states, volume, and cycle (142), and thus variations of transcripts across cells can inform on their co-expression even under identical genetic backgrounds. Co-expression networks can be constructed with higher throughput by considering the correlated expression of genes across many cells on the same culture dish rather than across many cell lines (158, 159). scRNA-seq can be further combined with recent advances in genome-editing for massively parallel reverse genetic screens, such as in Perturb-seq (160) or CRISP-seq (161) approaches for modeling genetic networks. In brief, a CRISPR pooled screen is set up such that each individual cell is targeted with a random guide RNA and barcode to knock down or knock out a random gene. The resulting transcriptomic change within the cell is then measured by scRNA-seq and connected to each barcode, resulting in a massive genetic screen that simultaneously measures the consequences of the individual disruptions of tens of thousands of genes. The resulting data can be modeled as a regulatory network in which the expression level of each gene is a linear combination of regulatory inputs at one or more disrupted genes.
4. Concluding Remarks
The confluence of iPSCs and omics technologies now allows tissue-specific and patient-specific expression profiles of genes, transcripts, proteins, and metabolites to be queried on a large scale. Large-scale omics data across samples can be further leveraged to provide useful information on gene regulatory networks in relevant cell types. We anticipate the combination of systems-wide approaches and iPSCs to benefit two primary areas of disease inquiries in the near term. Firstly, the availability of large iPSC panels will serve as surrogates of human populations and allow systems genetics studies to identify gene-trait correlations in complex diseases (162). The construction of iPSC panels from donors of multiple ethnicities will allow association studies to more routinely cover underrepresented populations. Secondly, understanding the architecture of gene regulatory networks in various cell types will likely improve understanding of cell type specification in development and diseases, iPSC engineering, and deconvolution of mixture samples (157, 163). With continued improvements to iPSC models (see Box 2) as well as falling costs of sequencing, one can envision that iPSC-based systems biology will become increasingly valuable for studies of disease mechanism
Box 2. Current limitations and ongoing refinement of iPSC models.
A major limitation for iPSC models is that derived cells are immature and resemble fetal cells. This is true for iPSC-derived neurons (132), hepatocytes (145), and cardiomyocytes (166). Derived myocyte, for example, have underdeveloped calcium handling and contraction (111), and their gene expression profiles resemble first-trimester fetal hearts (167). This immaturity casts doubt on whether discovered gene regulatory networks are relevant to adult tissues and diseases that manifest in adulthood. Efforts to promote maturity include optimization of culturing substrates and conditions (168, 169), exercising the cells to biophysical or electrical stimulation (170), as well as supplementing the culture media with molecular signaling cues and trophic factors (21, 171).
Another limitation is that two-dimensional iPSC cultures do not capture tissue-level features such as three-dimensional geometries and cell-cell interactions (172). To address this, there are ongoing efforts to capture essential missing interactions in tractable iPSC models with organoids and tissues-on-a-chip approaches (173). These engineering efforts attempt to create three-dimensional cellular models that incorporate defined geometries or tissue microstructures (114, 174), and can further incorporate multiple cell types that make up a resident tissue including endothelial and myocyte cells (175) or astrocytes and neurons (176). These engineered systems have been demonstrated to mimic the heart, brain, liver, kidney, and other tissues (177, 178). However, a drawback is a further increase in technical variations and a decrease in throughput for large iPSC panels. Finally, the life histories and environmental exposures of individuals are not captured and need to be reintroduced in vitro. A clear consensus has yet to emerge on whether iPSCs reprogrammed from young and old individuals resets cellular age (179, 180).
To make iPSC panels more accessible to biomedical researchers, we believe there is a need to improve standardization and accessibility of cell line material and data. The influx of omics big data has prompted technical and policy advances to make biomedical data science findable, accessible, interoperable, and reusable (FAIR). A parallel effort in iPSC democratization will include the adoption and free sharing of standardized cell lines, nomenclature, open data from iPSC model studies. Provided that the iPSC lines used for association studies are made publicly available, iPSC panels would constitute an additive resource over time. As new sequencing techniques become more accessible in the future, new data acquired across these standard iPSC lines can be analyzed within the context of existing genotype and transcriptome data. This collaborative systems genetics model has yielded biological insights for preclinical studies in rodent models (Hybrid Mouse Diversity Panel (164) and the Collaborative Cross (165)). With openly accessible iPSC lines from consortiums and individual biobanks, we foresee iPSC panels will have similar impact for human studies.
Figure 1. Omics approaches in iPSC models of human diseases.
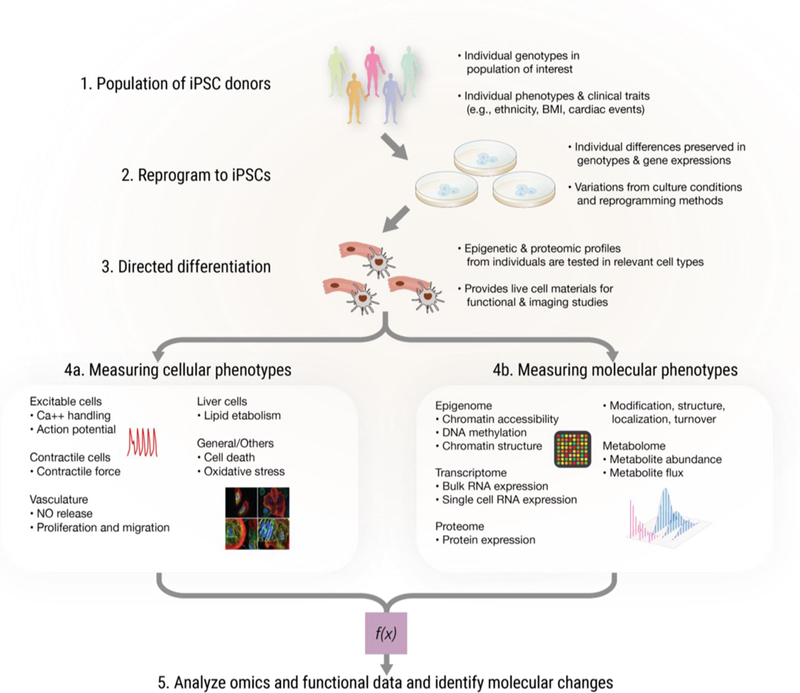
1. Populations of healthy and/or diseased individuals donate skin or blood cells. 2. iPSCs are derived from donors to capture their genetic backgrounds. 3. The individual-specific iPSCs are coaxed into differentiated cells resembling primary tissues including cardiomyocytes, neurons, and hepatocytes. 4. The resulting iPSC-derived cells are used to profile (4a) live cell functional phenotypes and (4b) molecular expression. 5. Large-scale profiling data are analyzed to discern molecular mechanisms responsible for cellular phenotypes and disease traits.
Figure 3. Genes conceptualized as linear pathways vs. complex networks.
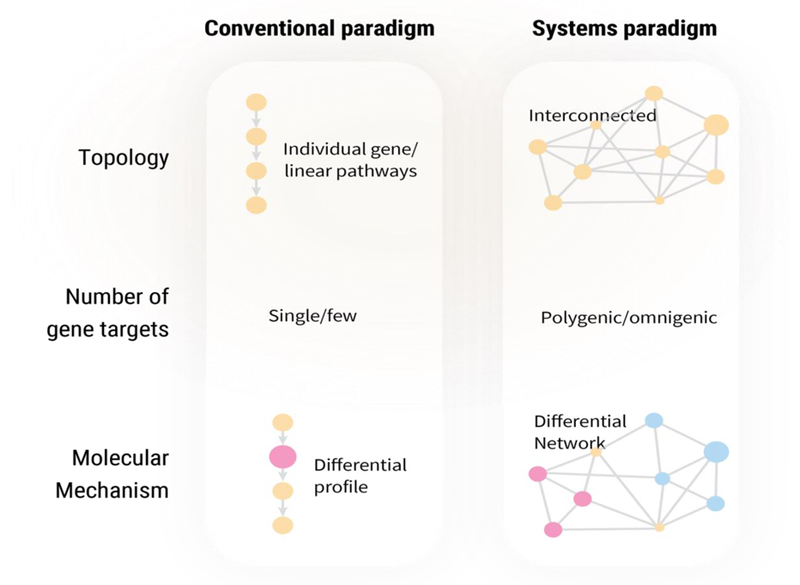
In the linear pathway worldview, disease genes are identified via conspicuous differential expression of one or few molecular markers along known pathways (differential profile). In the complex network view, differences in subnetwork memberships can be analyzed to detect changes in networks or subnetworks between two states and to identify disease modules.
Box 1. Properties of gene networks.
Network theories have discovered a number of properties commonly found in biological networks including gene networks (118). Gene networks are assumed to follow a scale-free topology, in which the distribution of degrees (i.e., the number of neighbors) of nodes in the network follows a power distribution. Scale-free topology has been found in various social and biological networks, is thought to emerge automatically from individual interactions (149), and underlies the resilience and evolvability of complex adaptive systems (150, 151). It also predicts the emergence of hub genes (152) and the “small world” phenomenon, in which most genes can be connected to each other with small numbers of steps (118). One prediction of the model is that differential network topologies and can also occur due to the formation or dissolution of covariation between genes, leading to changes in node connectivity (153). In disease, changes in gene regulations can rewire networks so that genes normally associated with one subnetwork now associate with another (154).
Acknowledgments
We thank Jared Churko, Mark Chandy, June-Wha Rhee and Blake Wu for a critical reading of the manuscript. This work was supported in part by American Heart Association 17MERIT336100009, Burroughs Wellcome Fund Innovation in Regulatory Science Award 1015009, and National Institutes of Health (NIH) R01 HL113006, R01 HL128170, R24 HL117756 (JCW), F32 HL139045 (EL), and T32 EB009035 (DTP).
Glossary in margin
- Aptamer
Oligonucleotide sequences that show binding affinity to specific shapes.
- ATAC-Seq
Epigenomics method that probes open chromatins by virtue of their accessibility for Tn5 transposase to insert adapters for sequencing.
- Co-expression network
An interconnected set of genes that are implied to be functionally related because they co-vary in their expression patterns across cells, individuals, or species
- Differential expression analysis
Comparison of gene, protein or metabolite molecules to identify species with statistically significant difference in abundance between two conditions
- Expression quantitative trait locus (eQTL)
A QTL that modulates the expression level of a gene as the quantitative trait
- Gene regulatory network
An interconnected set of signaling genes and transcription factors and their target genes that function as a unit to modulate gene expression
- Genome-wide association studies (GWAS)
large-scale association studies to discover correlation between genetic variants with observable phenotype in a population
- Chromatin conformation capture (3C)
Method to capture long-range interactions between two specific genomic loci by crosslinking ligation reactions.
- Induced pluripotent stem cells (iPSCs)
Cells reprogrammed from adult differentiated cells into a naive state, subsequently capable of infinite renewal in culture and differentiation into multiple cellular lineages.
- iPSC panels
Collection of multiple iPSC lines from different donors as a surrogate population
- Quantitative trait locus (QTL)
A variant or region in the genome that is correlated to the variance of a measurable quantitative trait such as body mass index across individuals
- Single cell RNA sequencing (scRNA-seq)
Next generation sequencing technique that profiles the sequence and abundance of transcripts in individual single cells to measure expression heterogeneity
- Tandem mass spectrometry (MS/MS)
Analysis of proteins or metabolites by measuring the the accurate mass of a molecule (MS1) followed by isolation, fragmentation, and measuring the masses of its fragments
Footnotes
Disclosure Statement
The authors are not aware of any affiliations, memberships, funding, or financial holdings that might be perceived as affecting the objectivity of this review.
Literature Cited
- 1.Shi Y, Inoue H, Wu JC, Yamanaka S. 2017. Induced pluripotent stem cell technology: a decade of progress. Nat. Rev. Drug Discov 16(2):115–30 [DOI] [PMC free article] [PubMed] [Google Scholar]
- 2.Choi J, Lee S, Mallard W, Clement K, Tagliazucchi GM, et al. 2015. A comparison of genetically matched cell lines reveals the equivalence of human ipscs and escs. Nat. Biotechnol 33(11):1173–81 [DOI] [PMC free article] [PubMed] [Google Scholar]
- 3.Wen W, Zhang J-P, Xu J, Su RJ, Neises A, et al. 2016. Enhanced generation of integration-free ipscs from human adult peripheral blood mononuclear cells with an optimal combination of episomal vectors. Stem Cell Reports 6(6):873–84 [DOI] [PMC free article] [PubMed] [Google Scholar]
- 4.Karumbayaram S, Novitch BG, Patterson M, Umbach JA, Richter L, et al. 2009. Directed differentiation of human-induced pluripotent stem cells generates active motor neurons. Stem Cells 27(4):806–11 [DOI] [PMC free article] [PubMed] [Google Scholar]
- 5.Burridge PW, Matsa E, Shukla P, Lin ZC, Churko JM, et al. 2014. Chemically defined generation of human cardiomyocytes. Nat. Methods 11(8):855–60 [DOI] [PMC free article] [PubMed] [Google Scholar]
- 6.Lian X, Hsiao C, Wilson G, Zhu K, Hazeltine LB, et al. 2012. Robust cardiomyocyte differentiation from human pluripotent stem cells via temporal modulation of canonical wnt signaling. Proc Natl Acad Sci USA 109(27):E1848–57 [DOI] [PMC free article] [PubMed] [Google Scholar]
- 7.Warren CR, O’Sullivan JF, Friesen M, Becker CE, Zhang X, et al. 2017. Induced pluripotent stem cell differentiation enables functional validation of gwas variants in metabolic disease. Cell Stem Cell 20(4):547–557.e7 [DOI] [PubMed] [Google Scholar]
- 8.Marchand M, Anderson EK, Phadnis SM, Longaker MT, Cooke JP, et al. 2014. Concurrent generation of functional smooth muscle and endothelial cells via a vascular progenitor. Stem Cells Transl. Med 3(1):91–97 [DOI] [PMC free article] [PubMed] [Google Scholar]
- 9.Patsch C, Challet-Meylan L, Thoma EC, Urich E, Heckel T, et al. 2015. Generation of vascular endothelial and smooth muscle cells from human pluripotent stem cells. Nat. Cell Biol 17(8):994–1003 [DOI] [PMC free article] [PubMed] [Google Scholar]
- 10.Chambers SM, Qi Y, Mica Y, Lee G, Zhang X-J, et al. 2012. Combined small-molecule inhibition accelerates developmental timing and converts human pluripotent stem cells into nociceptors. Nat. Biotechnol 30(7):715–20 [DOI] [PMC free article] [PubMed] [Google Scholar]
- 11.Protze SI, Liu J, Nussinovitch U, Ohana L, Backx PH, et al. 2017. Sinoatrial node cardiomyocytes derived from human pluripotent cells function as a biological pacemaker. Nat. Biotechnol 35(1):56–68 [DOI] [PubMed] [Google Scholar]
- 12.Lee JH, Protze SI, Laksman Z, Backx PH, Keller GM. 2017. Human pluripotent stem cell-derived atrial and ventricular cardiomyocytes develop from distinct mesoderm populations. Cell Stem Cell 21(2):179–194.e4 [DOI] [PubMed] [Google Scholar]
- 13.Birket MJ, Ribeiro MC, Verkerk AO, Ward D, Leitoguinho AR, et al. 2015. Expansion and patterning of cardiovascular progenitors derived from human pluripotent stem cells. Nat. Biotechnol 33(9):970–79 [DOI] [PubMed] [Google Scholar]
- 14.Neofytou E, O’Brien CG, Couture LA, Wu JC. 2015. Hurdles to clinical translation of human induced pluripotent stem cells. J. Clin. Invest 125(7):2551–57 [DOI] [PMC free article] [PubMed] [Google Scholar]
- 15.Mandai M, Watanabe A, Kurimoto Y, Hirami Y, Morinaga C, et al. 2017. Autologous induced stem-cell-derived retinal cells for macular degeneration. N. Engl. J. Med 376(11):1038–46 [DOI] [PubMed] [Google Scholar]
- 16.Vazão H, Rosa S, Barata T, Costa R, Pitrez PR, et al. 2017. High-throughput identification of small molecules that affect human embryonic vascular development. Proc Natl Acad Sci USA 114(15):E3022–31 [DOI] [PMC free article] [PubMed] [Google Scholar]
- 17.Liang P, Lan F, Lee AS, Gong T, Sanchez-Freire V, et al. 2013. Drug screening using a library of human induced pluripotent stem cell-derived cardiomyocytes reveals disease-specific patterns of cardiotoxicity. Circulation 127(16):1677–91 [DOI] [PMC free article] [PubMed] [Google Scholar]
- 18.Sharma A, Burridge PW, McKeithan WL, Serrano R, Shukla P, et al. 2017. High-throughput screening of tyrosine kinase inhibitor cardiotoxicity with human induced pluripotent stem cells. Sci. Transl. Med 9(377): [DOI] [PMC free article] [PubMed] [Google Scholar]
- 19.Burridge PW, Li YF, Matsa E, Wu H, Ong S-G, et al. 2016. Human induced pluripotent stem cell-derived cardiomyocytes recapitulate the predilection of breast cancer patients to doxorubicin-induced cardiotoxicity. Nat. Med 22(5):547–56 [DOI] [PMC free article] [PubMed] [Google Scholar]
- 20.Chal J, Oginuma M, Al Tanoury Z, Gobert B, Sumara O, et al. 2015. Differentiation of pluripotent stem cells to muscle fiber to model duchenne muscular dystrophy. Nat. Biotechnol 33(9):962–69 [DOI] [PubMed] [Google Scholar]
- 21.Birket MJ, Ribeiro MC, Kosmidis G, Ward D, Leitoguinho AR, et al. 2015. Contractile defect caused by mutation in mybpc3 revealed under conditions optimized for human psc-cardiomyocyte function. Cell Rep 13(4):733–45 [DOI] [PMC free article] [PubMed] [Google Scholar]
- 22.Li S, Pan H, Tan C, Sun Y, Song Y, et al. 2018. Mitochondrial dysfunctions contribute to hypertrophic cardiomyopathy in patient ipsc-derived cardiomyocytes with mt-rnr2 mutation. Stem Cell Reports [DOI] [PMC free article] [PubMed]
- 23.Kodo K, Ong S-G, Jahanbani F, Termglinchan V, Hirono K, et al. 2016. IPSC-derived cardiomyocytes reveal abnormal tgf-β signalling in left ventricular non-compaction cardiomyopathy. Nat. Cell Biol 18(10):1031–42 [DOI] [PMC free article] [PubMed] [Google Scholar]
- 24.Wu H, Lee J, Vincent LG, Wang Q, Gu M, et al. 2015. Epigenetic regulation of phosphodiesterases 2a and 3a underlies compromised β-adrenergic signaling in an ipsc model of dilated cardiomyopathy. Cell Stem Cell 17(1):89–100 [DOI] [PMC free article] [PubMed] [Google Scholar]
- 25.Wang Y, Liang P, Lan F, Wu H, Lisowski L, et al. 2014. Genome editing of isogenic human induced pluripotent stem cells recapitulates long qt phenotype for drug testing. J. Am. Coll. Cardiol 64(5):451–59 [DOI] [PMC free article] [PubMed] [Google Scholar]
- 26.Bellin M, Casini S, Davis RP, D’Aniello C, Haas J, et al. 2013. Isogenic human pluripotent stem cell pairs reveal the role of a kcnh2 mutation in long-qt syndrome. EMBO J 32(24):3161–75 [DOI] [PMC free article] [PubMed] [Google Scholar]
- 27.Liang P, Sallam K, Wu H, Li Y, Itzhaki I, et al. 2016. Patient-specific and genome-edited induced pluripotent stem cell-derived cardiomyocytes elucidate single-cell phenotype of brugada syndrome. J. Am. Coll. Cardiol 68(19):2086–96 [DOI] [PMC free article] [PubMed] [Google Scholar]
- 28.Gu M, Shao N-Y, Sa S, Li D, Termglinchan V, et al. 2017. Patient-specific ipsc-derived endothelial cells uncover pathways that protect against pulmonary hypertension in bmpr2 mutation carriers. Cell Stem Cell 20(4):490–504.e5 [DOI] [PMC free article] [PubMed] [Google Scholar]
- 29.Haidet-Phillips AM, Hester ME, Miranda CJ, Meyer K, Braun L, et al. 2011. Astrocytes from familial and sporadic als patients are toxic to motor neurons. Nat. Biotechnol 29(9):824–28 [DOI] [PMC free article] [PubMed] [Google Scholar]
- 30.Torrent R, De Angelis Rigotti F, Dell’Era P, Memo M, Raya A, Consiglio A. 2015. Using ips cells toward the understanding of parkinson’s disease. J. Clin. Med 4(4):548–66 [DOI] [PMC free article] [PubMed] [Google Scholar]
- 31.Conesa A, Madrigal P, Tarazona S, Gomez-Cabrero D, Cervera A, et al. 2016. A survey of best practices for rna-seq data analysis. Genome Biol 17(1):13. [DOI] [PMC free article] [PubMed] [Google Scholar]
- 32.GTEx Consortium, Laboratory, Data Analysis &Coordinating Center (LDACC)—Analysis Working Group, Statistical Methods groups—Analysis Working Group, Enhancing GTEx (eGTEx) groups, NIH Common Fund, et al. 2017. Genetic effects on gene expression across human tissues. Nature 550(7675):204–13 [DOI] [PMC free article] [PubMed] [Google Scholar]
- 33.Tilgner H, Jahanbani F, Blauwkamp T, Moshrefi A, Jaeger E, et al. 2015. Comprehensive transcriptome analysis using synthetic long-read sequencing reveals molecular co-association of distant splicing events. Nat. Biotechnol 33(7):736–42 [DOI] [PMC free article] [PubMed] [Google Scholar]
- 34.Gawad C, Koh W, Quake SR. 2016. Single-cell genome sequencing: current state of the science. Nat. Rev. Genet 17(3):175–88 [DOI] [PubMed] [Google Scholar]
- 35.DeLaughter DM, Bick AG, Wakimoto H, McKean D, Gorham JM, et al. 2016. Single-cell resolution of temporal gene expression during heart development. Dev. Cell 39(4):480–90 [DOI] [PMC free article] [PubMed] [Google Scholar]
- 36.Bekker-Jensen DB, Kelstrup CD, Batth TS, Larsen SC, Haldrup C, et al. 2017. An optimized shotgun strategy for the rapid generation of comprehensive human proteomes. Cell Syst 4(6):587–599.e4 [DOI] [PMC free article] [PubMed] [Google Scholar]
- 37.Doll S, Dreßen M, Geyer PE, Itzhak DN, Braun C, et al. 2017. Region and cell-type resolved quantitative proteomic map of the human heart. Nat. Commun 8(1):1469. [DOI] [PMC free article] [PubMed] [Google Scholar]
- 38.Riley NM, Coon JJ. 2016. Phosphoproteomics in the age of rapid and deep proteome profiling. Anal. Chem 88(1):74–94 [DOI] [PMC free article] [PubMed] [Google Scholar]
- 39.Olsen JV, Mann M. 2013. Status of large-scale analysis of post-translational modifications by mass spectrometry. Mol. Cell. Proteomics 12(12):3444–52 [DOI] [PMC free article] [PubMed] [Google Scholar]
- 40.Patti GJ, Yanes O, Siuzdak G. 2012. Innovation: metabolomics: the apogee of the omics trilogy. Nat. Rev. Mol. Cell Biol 13(4):263–69 [DOI] [PMC free article] [PubMed] [Google Scholar]
- 41.eGTEx Project. 2017. Enhancing gtex by bridging the gaps between genotype, gene expression, and disease. Nat. Genet 49(12):1664–70 [DOI] [PMC free article] [PubMed] [Google Scholar]
- 42.Parikshak NN, Gandal MJ, Geschwind DH. 2015. Systems biology and gene networks in neurodevelopmental and neurodegenerative disorders. Nat. Rev. Genet 16(8):441–58 [DOI] [PMC free article] [PubMed] [Google Scholar]
- 43.Civelek M, Lusis AJ. 2014. Systems genetics approaches to understand complex traits. Nat. Rev. Genet 15(1):34–48 [DOI] [PMC free article] [PubMed] [Google Scholar]
- 44.Price ND, Magis AT, Earls JC, Glusman G, Levy R, et al. 2017. A wellness study of 108 individuals using personal, dense, dynamic data clouds. Nat. Biotechnol 35(8):747–56 [DOI] [PMC free article] [PubMed] [Google Scholar]
- 45.Matsa E, Ahrens JH, Wu JC. 2016. Human induced pluripotent stem cells as a platform for personalized and precision cardiovascular medicine. Physiol. Rev 96(3):1093–1126 [DOI] [PMC free article] [PubMed] [Google Scholar]
- 46.Hockemeyer D, Jaenisch R. 2016. Induced pluripotent stem cells meet genome editing. Cell Stem Cell 18(5):573–86 [DOI] [PMC free article] [PubMed] [Google Scholar]
- 47.Hotta A, Yamanaka S. 2015. From genomics to gene therapy: induced pluripotent stem cells meet genome editing. Annu. Rev. Genet 49:47–70 [DOI] [PubMed] [Google Scholar]
- 48.Rao SSP, Huntley MH, Durand NC, Stamenova EK, Bochkov ID, et al. 2014. A 3d map of the human genome at kilobase resolution reveals principles of chromatin looping. Cell 159(7):1665–80 [DOI] [PMC free article] [PubMed] [Google Scholar]
- 49.Corces MR, Trevino AE, Hamilton EG, Greenside PG, Sinnott-Armstrong NA, et al. 2017. An improved atac-seq protocol reduces background and enables interrogation of frozen tissues. Nat. Methods 14(10):959–62 [DOI] [PMC free article] [PubMed] [Google Scholar]
- 50.Mumbach MR, Rubin AJ, Flynn RA, Dai C, Khavari PA, et al. 2016. HiChIP: efficient and sensitive analysis of protein-directed genome architecture. Nat. Methods 13(11):919–22 [DOI] [PMC free article] [PubMed] [Google Scholar]
- 51.Liu Q, Jiang C, Xu J, Zhao M-T, Van Bortle K, et al. 2017. Genome-wide temporal profiling of transcriptome and open chromatin of early cardiomyocyte differentiation derived from hipscs and hescs. Circ. Res 121(4):376–91 [DOI] [PMC free article] [PubMed] [Google Scholar]
- 52.Lee J, Shao N-Y, Paik DT, Wu H, Guo H, et al. 2018. SETD7 drives cardiac lineage commitment through stage-specific transcriptional activation. Cell Stem Cell 22(3):428–444.e5 [DOI] [PMC free article] [PubMed] [Google Scholar]
- 53.Forrest MP, Zhang H, Moy W, McGowan H, Leites C, et al. 2017. Open chromatin profiling in hipsc-derived neurons prioritizes functional noncoding psychiatric risk variants and highlights neurodevelopmental loci. Cell Stem Cell 21(3):305–318.e8 [DOI] [PMC free article] [PubMed] [Google Scholar]
- 54.Li YI, van de Geijn B, Raj A, Knowles DA, Petti AA, et al. 2016. RNA splicing is a primary link between genetic variation and disease. Science 352(6285):600–604 [DOI] [PMC free article] [PubMed] [Google Scholar]
- 55.Picelli S, Björklund ÅK, Faridani OR, Sagasser S, Winberg G, Sandberg R. 2013. Smart-seq2 for sensitive full-length transcriptome profiling in single cells. Nat. Methods 10(11):1096–98 [DOI] [PubMed] [Google Scholar]
- 56.Hashimshony T, Senderovich N, Avital G, Klochendler A, de Leeuw Y, et al. 2016. CEL-seq2: sensitive highly-multiplexed single-cell rna-seq. Genome Biol 17:77. [DOI] [PMC free article] [PubMed] [Google Scholar]
- 57.Jaitin DA, Kenigsberg E, Keren-Shaul H, Elefant N, Paul F, et al. 2014. Massively parallel single-cell rna-seq for marker-free decomposition of tissues into cell types. Science 343(6172):776–79 [DOI] [PMC free article] [PubMed] [Google Scholar]
- 58.Zheng GXY, Terry JM, Belgrader P, Ryvkin P, Bent ZW, et al. 2017. Massively parallel digital transcriptional profiling of single cells. Nat. Commun 8:14049. [DOI] [PMC free article] [PubMed] [Google Scholar]
- 59.Papalexi E, Satija R. 2018. Single-cell rna sequencing to explore immune cell heterogeneity. Nat. Rev. Immunol 18(1):35–45 [DOI] [PubMed] [Google Scholar]
- 60.Buettner F, Natarajan KN, Casale FP, Proserpio V, Scialdone A, et al. 2015. Computational analysis of cell-to-cell heterogeneity in single-cell rna-sequencing data reveals hidden subpopulations of cells. Nat. Biotechnol 33(2):155–60 [DOI] [PubMed] [Google Scholar]
- 61.Cao J, Packer JS, Ramani V, Cusanovich DA, Huynh C, et al. 2017. Comprehensive single-cell transcriptional profiling of a multicellular organism. Science 357(6352):661–67 [DOI] [PMC free article] [PubMed] [Google Scholar]
- 62.Karaiskos N, Wahle P, Alles J, Boltengagen A, Ayoub S, et al. 2017. The drosophila embryo at single-cell transcriptome resolution. Science 358(6360):194–99 [DOI] [PubMed] [Google Scholar]
- 63.Moignard V, Woodhouse S, Haghverdi L, Lilly AJ, Tanaka Y, et al. 2015. Decoding the regulatory network of early blood development from single-cell gene expression measurements. Nat. Biotechnol 33(3):269–76 [DOI] [PMC free article] [PubMed] [Google Scholar]
- 64.Hough SR, Thornton M, Mason E, Mar JC, Wells CA, Pera MF. 2014. Single-cell gene expression profiles define self-renewing, pluripotent, and lineage primed states of human pluripotent stem cells. Stem Cell Reports 2(6):881–95 [DOI] [PMC free article] [PubMed] [Google Scholar]
- 65.Liu Z, Wang L, Welch JD, Ma H, Zhou Y, et al. 2017. Single-cell transcriptomics reconstructs fate conversion from fibroblast to cardiomyocyte. Nature 551(7678):100–104 [DOI] [PMC free article] [PubMed] [Google Scholar]
- 66.Bardy C, van den Hurk M, Kakaradov B, Erwin JA, Jaeger BN, et al. 2016. Predicting the functional states of human ipsc-derived neurons with single-cell rna-seq and electrophysiology. Mol. Psychiatry 21(11):1573–88 [DOI] [PMC free article] [PubMed] [Google Scholar]
- 67.Liu Y, Beyer A, Aebersold R. 2016. On the dependency of cellular protein levels on mrna abundance. Cell 165(3):535–50 [DOI] [PubMed] [Google Scholar]
- 68.Cheng Z, Teo G, Krueger S, Rock TM, Koh HWL, et al. 2016. Differential dynamics of the mammalian mrna and protein expression response to misfolding stress. Mol. Syst. Biol 12(1):855. [DOI] [PMC free article] [PubMed] [Google Scholar]
- 69.Liu Y, Borel C, Li L, Müller T, Williams EG, et al. 2017. Systematic proteome and proteostasis profiling in human trisomy 21 fibroblast cells. Nat. Commun 8(1):1212. [DOI] [PMC free article] [PubMed] [Google Scholar]
- 70.Battle A, Khan Z, Wang SH, Mitrano A, Ford MJ, et al. 2015. Genomic variation. impact of regulatory variation from rna to protein. Science 347(6222):664–67 [DOI] [PMC free article] [PubMed] [Google Scholar]
- 71.Chick JM, Munger SC, Simecek P, Huttlin EL, Choi K, et al. 2016. Defining the consequences of genetic variation on a proteome-wide scale. Nature 534(7608):500–505 [DOI] [PMC free article] [PubMed] [Google Scholar]
- 72.Lau E, Cao Q, Lam MPY, Wang J, Ng DCM, et al. 2018. Integrated omics dissection of proteome dynamics during cardiac remodeling. Nat. Commun 9(1):120. [DOI] [PMC free article] [PubMed] [Google Scholar]
- 73.Aebersold R, Mann M. 2016. Mass-spectrometric exploration of proteome structure and function. Nature 537(7620):347–55 [DOI] [PubMed] [Google Scholar]
- 74.Aebersold R, Agar JN, Amster IJ, Baker MS, Bertozzi CR, et al. 2018. How many human proteoforms are there? Nat. Chem. Biol 14(3):206–14 [DOI] [PMC free article] [PubMed] [Google Scholar]
- 75.Schwenk JM, Omenn GS, Sun Z, Campbell DS, Baker MS, et al. 2017. The human plasma proteome draft of 2017: building on the human plasma peptideatlas from mass spectrometry and complementary assays. J. Proteome Res 16(12):4299–4310 [DOI] [PMC free article] [PubMed] [Google Scholar]
- 76.Han G, Chen S-Y, Gonzalez VD, Zunder ER, Fantl WJ, Nolan GP. 2017. Atomic mass tag of bismuth-209 for increasing the immunoassay multiplexing capacity of mass cytometry. Cytometry A 91(12):1150–63 [DOI] [PMC free article] [PubMed] [Google Scholar]
- 77.Leipold MD, Obermoser G, Fenwick C, Kleinstuber K, Rashidi N, et al. 2018. Comparison of cytof assays across sites: results of a six-center pilot study. J. Immunol. Methods 453:37–43 [DOI] [PMC free article] [PubMed] [Google Scholar]
- 78.Gawande BN, Rohloff JC, Carter JD, von Carlowitz I, Zhang C, et al. 2017. Selection of dna aptamers with two modified bases. Proc Natl Acad Sci USA 114(11):2898–2903 [DOI] [PMC free article] [PubMed] [Google Scholar]
- 79.Jacob J, Ngo D, Finkel N, Pitts R, Gleim S, et al. 2017. Application of large scale aptamer-based proteomic profiling to “planned” myocardial infarctions. Circulation 137(12):1270–77 [DOI] [PMC free article] [PubMed] [Google Scholar]
- 80.Williams SA, Murthy AC, DeLisle RK, Hyde C, Malarstig A, et al. 2017. Improving assessment of drug safety through proteomics: early detection and mechanistic characterization of the unforeseen harmful effects of torcetrapib. Circulation 137(10):999–1010 [DOI] [PMC free article] [PubMed] [Google Scholar]
- 81.Ganz P, Heidecker B, Hveem K, Jonasson C, Kato S, et al. 2016. Development and validation of a protein-based risk score for cardiovascular outcomes among patients with stable coronary heart disease. JAMA 315(23):2532–41 [DOI] [PubMed] [Google Scholar]
- 82.Ngo D, Sinha S, Shen D, Kuhn EW, Keyes MJ, et al. 2016. Aptamer-based proteomic profiling reveals novel candidate biomarkers and pathways in cardiovascular disease. Circulation 134(4):270–85 [DOI] [PMC free article] [PubMed] [Google Scholar]
- 83.Kelstrup CD, Bekker-Jensen DB, Arrey TN, Hogrebe A, Harder A, Olsen JV. 2018. Performance evaluation of the q exactive hf-x for shotgun proteomics. J. Proteome Res 17(1):727–38 [DOI] [PubMed] [Google Scholar]
- 84.Garabedian A, Benigni P, Ramirez CE, Baker ES, Liu T, et al. 2017. Towards discovery and targeted peptide biomarker detection using nanoesi-tims-tof ms. J. Am. Soc. Mass Spectrom [DOI] [PMC free article] [PubMed]
- 85.Rosenberger G, Liu Y, Röst HL, Ludwig C, Buil A, et al. 2017. Inference and quantification of peptidoforms in large sample cohorts by swath-ms. Nat. Biotechnol 35(8):781–88 [DOI] [PMC free article] [PubMed] [Google Scholar]
- 86.Fu Q, Kowalski MP, Mastali M, Parker SJ, Sobhani K, et al. 2018. Highly reproducible automated proteomics sample preparation workflow for quantitative mass spectrometry. J. Proteome Res 17(1):420–28 [DOI] [PMC free article] [PubMed] [Google Scholar]
- 87.Collins BC, Hunter CL, Liu Y, Schilling B, Rosenberger G, et al. 2017. Multi-laboratory assessment of reproducibility, qualitative and quantitative performance of swath-mass spectrometry. Nat. Commun 8(1):291. [DOI] [PMC free article] [PubMed] [Google Scholar]
- 88.Chavez JD, Lee CF, Caudal A, Keller A, Tian R, Bruce JE. 2018. Chemical crosslinking mass spectrometry analysis of protein conformations and supercomplexes in heart tissue. Cell Syst 6(1):136–141.e5 [DOI] [PMC free article] [PubMed] [Google Scholar]
- 89.Liu Y, Gonzàlez-Porta M, Santos S, Brazma A, Marioni JC, et al. 2017. Impact of alternative splicing on the human proteome. Cell Rep 20(5):1229–41 [DOI] [PMC free article] [PubMed] [Google Scholar]
- 90.Lujan E, Zunder ER, Ng YH, Goronzy IN, Nolan GP, Wernig M. 2015. Early reprogramming regulators identified by prospective isolation and mass cytometry. Nature 521(7552):352–56 [DOI] [PMC free article] [PubMed] [Google Scholar]
- 91.Zunder ER, Lujan E, Goltsev Y, Wernig M, Nolan GP. 2015. A continuous molecular roadmap to ipsc reprogramming through progression analysis of single-cell mass cytometry. Cell Stem Cell 16(3):323–37 [DOI] [PMC free article] [PubMed] [Google Scholar]
- 92.Mallanna SK, Cayo MA, Twaroski K, Gundry RL, Duncan SA. 2016. Mapping the cell-surface n-glycoproteome of human hepatocytes reveals markers for selecting a homogeneous population of ipsc-derived hepatocytes. Stem Cell Reports 7(3):543–56 [DOI] [PMC free article] [PubMed] [Google Scholar]
- 93.Kilpinen H, Goncalves A, Leha A, Afzal V, Alasoo K, et al. 2017. Common genetic variation drives molecular heterogeneity in human ipscs. Nature 546(7658):370–75 [DOI] [PMC free article] [PubMed] [Google Scholar]
- 94.Wishart DS, Feunang YD, Marcu A, Guo AC, Liang K, et al. 2018. HMDB 4.0: the human metabolome database for 2018. Nucleic Acids Res 46(D1):D608–17 [DOI] [PMC free article] [PubMed] [Google Scholar]
- 95.Wang Z, Klipfell E, Bennett BJ, Koeth R, Levison BS, et al. 2011. Gut flora metabolism of phosphatidylcholine promotes cardiovascular disease. Nature 472(7341):57–63 [DOI] [PMC free article] [PubMed] [Google Scholar]
- 96.Sato Y, Kobayashi H, Higuchi T, Shimada Y, Ida H, Ohashi T. 2017. Metabolomic profiling of pompe disease-induced pluripotent stem cell-derived cardiomyocytes reveals that oxidative stress is associated with cardiac and skeletal muscle pathology. Stem Cells Transl. Med 6(1):31–39 [DOI] [PMC free article] [PubMed] [Google Scholar]
- 97.Zhao X, Chen H, Xiao D, Yang H, Itzhaki I, et al. 2018. Comparison of non-human primate versus human induced pluripotent stem cell-derived cardiomyocytes for treatment of myocardial infarction. Stem Cell Reports 10(2):422–35 [DOI] [PMC free article] [PubMed] [Google Scholar]
- 98.Gilchrist KH, Lewis GF, Gay EA, Sellgren KL, Grego S. 2015. High-throughput cardiac safety evaluation and multi-parameter arrhythmia profiling of cardiomyocytes using microelectrode arrays. Toxicol. Appl. Pharmacol 288(2):249–57 [DOI] [PubMed] [Google Scholar]
- 99.Hochbaum DR, Zhao Y, Farhi SL, Klapoetke N, Werley CA, et al. 2014. All-optical electrophysiology in mammalian neurons using engineered microbial rhodopsins. Nat. Methods 11(8):825–33 [DOI] [PMC free article] [PubMed] [Google Scholar]
- 100.Rajamohan D, Kalra S, Duc Hoang M, George V, Staniforth A, et al. 2016. Automated electrophysiological and pharmacological evaluation of human pluripotent stem cell-derived cardiomyocytes. Stem Cells Dev 25(6):439–52 [DOI] [PMC free article] [PubMed] [Google Scholar]
- 101.Deshpande A, Yadav S, Dao DQ, Wu Z-Y, Hokanson KC, et al. 2017. Cellular phenotypes in human ipsc-derived neurons from a genetic model of autism spectrum disorder. Cell Rep 21(10):2678–87 [DOI] [PMC free article] [PubMed] [Google Scholar]
- 102.Hwang HS, Kryshtal DO, Feaster TK, Sánchez-Freire V, Zhang J, et al. 2015. Comparable calcium handling of human ipsc-derived cardiomyocytes generated by multiple laboratories. J. Mol. Cell. Cardiol 85:79–88 [DOI] [PMC free article] [PubMed] [Google Scholar]
- 103.Paşca SP, Portmann T, Voineagu I, Yazawa M, Shcheglovitov A, et al. 2011. Using ipsc-derived neurons to uncover cellular phenotypes associated with timothy syndrome. Nat. Med 17(12):1657–62 [DOI] [PMC free article] [PubMed] [Google Scholar]
- 104.Lan F, Lee AS, Liang P, Sanchez-Freire V, Nguyen PK, et al. 2013. Abnormal calcium handling properties underlie familial hypertrophic cardiomyopathy pathology in patient-specific induced pluripotent stem cells. Cell Stem Cell 12(1):101–13 [DOI] [PMC free article] [PubMed] [Google Scholar]
- 105.Wyles SP, Li X, Hrstka SC, Reyes S, Oommen S, et al. 2016. Modeling structural and functional deficiencies of rbm20 familial dilated cardiomyopathy using human induced pluripotent stem cells. Hum. Mol. Genet 25(2):254–65 [DOI] [PMC free article] [PubMed] [Google Scholar]
- 106.Ribeiro AJS, Schwab O, Mandegar MA, Ang Y-S, Conklin BR, et al. 2017. Multi-imaging method to assay the contractile mechanical output of micropatterned human ipsc-derived cardiac myocytes. Circ. Res 120(10):1572–83 [DOI] [PMC free article] [PubMed] [Google Scholar]
- 107.Hayakawa T, Kunihiro T, Ando T, Kobayashi S, Matsui E, et al. 2014. Image-based evaluation of contraction-relaxation kinetics of human-induced pluripotent stem cell-derived cardiomyocytes: correlation and complementarity with extracellular electrophysiology. J. Mol. Cell. Cardiol 77:178–91 [DOI] [PubMed] [Google Scholar]
- 108.Scott CW, Zhang X, Abi-Gerges N, Lamore SD, Abassi YA, Peters MF. 2014. An impedance-based cellular assay using human ipsc-derived cardiomyocytes to quantify modulators of cardiac contractility. Toxicol. Sci 142(2):331–38 [DOI] [PubMed] [Google Scholar]
- 109.Sun N, Yazawa M, Liu J, Han L, Sanchez-Freire V, et al. 2012. Patient-specific induced pluripotent stem cells as a model for familial dilated cardiomyopathy. Sci. Transl. Med 4(130):130ra47 [DOI] [PMC free article] [PubMed] [Google Scholar]
- 110.Rodriguez ML, Graham BT, Pabon LM, Han SJ, Murry CE, Sniadecki NJ. 2014. Measuring the contractile forces of human induced pluripotent stem cell-derived cardiomyocytes with arrays of microposts. J. Biomech. Eng 136(5):051005. [DOI] [PMC free article] [PubMed] [Google Scholar]
- 111.Ribeiro MC, Tertoolen LG, Guadix JA, Bellin M, Kosmidis G, et al. 2015. Functional maturation of human pluripotent stem cell derived cardiomyocytes in vitro--correlation between contraction force and electrophysiology. Biomaterials 51:138–50 [DOI] [PubMed] [Google Scholar]
- 112.Streckfuss-Bömeke K, Tiburcy M, Fomin A, Luo X, Li W, et al. 2017. Severe dcm phenotype of patient harboring rbm20 mutation s635a can be modeled by patient-specific induced pluripotent stem cell-derived cardiomyocytes. J. Mol. Cell. Cardiol 113:9–21 [DOI] [PubMed] [Google Scholar]
- 113.Carcamo-Orive I, Huang NF, Quertermous T, Knowles JW. 2017. Induced pluripotent stem cell-derived endothelial cells in insulin resistance and metabolic syndrome. Arterioscler. Thromb. Vasc. Biol 37(11):2038–42 [DOI] [PMC free article] [PubMed] [Google Scholar]
- 114.Wang G, McCain ML, Yang L, He A, Pasqualini FS, et al. 2014. Modeling the mitochondrial cardiomyopathy of barth syndrome with induced pluripotent stem cell and heart-on-chip technologies. Nat. Med 20(6):616–23 [DOI] [PMC free article] [PubMed] [Google Scholar]
- 115.Ebert AD, Kodo K, Liang P, Wu H, Huber BC, et al. 2014. Characterization of the molecular mechanisms underlying increased ischemic damage in the aldehyde dehydrogenase 2 genetic polymorphism using a human induced pluripotent stem cell model system. Sci. Transl. Med 6(255):255ra130 [DOI] [PMC free article] [PubMed] [Google Scholar]
- 116.Keenan AB, Jenkins SL, Jagodnik KM, Koplev S, He E, et al. 2018. The library of integrated network-based cellular signatures nih program: system-level cataloging of human cells response to perturbations. Cell Syst 6(1):13–24 [DOI] [PMC free article] [PubMed] [Google Scholar]
- 117.Boyle EA, Li YI, Pritchard JK. 2017. An expanded view of complex traits: from polygenic to omnigenic. Cell 169(7):1177–86 [DOI] [PMC free article] [PubMed] [Google Scholar]
- 118.Barabási A-L, Gulbahce N, Loscalzo J. 2011. Network medicine: a network-based approach to human disease. Nat. Rev. Genet 12(1):56–68 [DOI] [PMC free article] [PubMed] [Google Scholar]
- 119.Li M, Belmonte JCI. 2017. Ground rules of the pluripotency gene regulatory network. Nat. Rev. Genet 18(3):180–91 [DOI] [PubMed] [Google Scholar]
- 120.Kolodziejczyk AA, Kim JK, Tsang JCH, Ilicic T, Henriksson J, et al. 2015. Single cell rna-sequencing of pluripotent states unlocks modular transcriptional variation. Cell Stem Cell 17(4):471–85 [DOI] [PMC free article] [PubMed] [Google Scholar]
- 121.Rolland T, Taşan M, Charloteaux B, Pevzner SJ, Zhong Q, et al. 2014. A proteome-scale map of the human interactome network. Cell 159(5):1212–26 [DOI] [PMC free article] [PubMed] [Google Scholar]
- 122.Huttlin EL, Bruckner RJ, Paulo JA, Cannon JR, Ting L, et al. 2017. Architecture of the human interactome defines protein communities and disease networks. Nature 545(7655):505–9 [DOI] [PMC free article] [PubMed] [Google Scholar]
- 123.Yan G, Vértes PE, Towlson EK, Chew YL, Walker DS, et al. 2017. Network control principles predict neuron function in the caenorhabditis elegans connectome. Nature 550(7677):519–23 [DOI] [PMC free article] [PubMed] [Google Scholar]
- 124.Albert FW, Kruglyak L. 2015. The role of regulatory variation in complex traits and disease. Nat. Rev. Genet 16(4):197–212 [DOI] [PubMed] [Google Scholar]
- 125.GTEx Consortium. 2015. Human genomics. the genotype-tissue expression (gtex) pilot analysis: multitissue gene regulation in humans. Science 348(6235):648–60 [DOI] [PMC free article] [PubMed] [Google Scholar]
- 126.Li X, Kim Y, Tsang EK, Davis JR, Damani FN, et al. 2017. The impact of rare variation on gene expression across tissues. Nature 550(7675):239–43 [DOI] [PMC free article] [PubMed] [Google Scholar]
- 127.Matsa E, Burridge PW, Yu K-H, Ahrens JH, Termglinchan V, et al. 2016. Transcriptome profiling of patient-specific human ipsc-cardiomyocytes predicts individual drug safety and efficacy responses in vitro. Cell Stem Cell 19(3):311–25 [DOI] [PMC free article] [PubMed] [Google Scholar]
- 128.Burrows CK, Banovich NE, Pavlovic BJ, Patterson K, Gallego Romero I, et al. 2016. Genetic variation, not cell type of origin, underlies the majority of identifiable regulatory differences in ipscs. PLoS Genet 12(1):e1005793. [DOI] [PMC free article] [PubMed] [Google Scholar]
- 129.Rouhani F, Kumasaka N, de Brito MC, Bradley A, Vallier L, Gaffney D. 2014. Genetic background drives transcriptional variation in human induced pluripotent stem cells. PLoS Genet 10(6):e1004432. [DOI] [PMC free article] [PubMed] [Google Scholar]
- 130.Cahan P, Daley GQ. 2013. Origins and implications of pluripotent stem cell variability and heterogeneity. Nat. Rev. Mol. Cell Biol 14(6):357–68 [DOI] [PMC free article] [PubMed] [Google Scholar]
- 131.Panopoulos AD, Smith EN, Arias AD, Shepard PJ, Hishida Y, et al. 2017. Aberrant dna methylation in human ipscs associates with myc-binding motifs in a clone-specific manner independent of genetics. Cell Stem Cell 20(4):505–517.e6 [DOI] [PMC free article] [PubMed] [Google Scholar]
- 132.Schwartzentruber J, Foskolou S, Kilpinen H, Rodrigues J, Alasoo K, et al. 2018. Molecular and functional variation in ipsc-derived sensory neurons. Nat. Genet 50(1):54–61 [DOI] [PMC free article] [PubMed] [Google Scholar]
- 133.Churko JM, Lee J, Ameen M, Gu M, Venkatasubramanian M, et al. 2017. Transcriptomic and epigenomic differences in human induced pluripotent stem cells generated from six reprogramming methods. Nat. Biomed. Eng 1:826–837 [DOI] [PMC free article] [PubMed] [Google Scholar]
- 134.Chen G, Gulbranson DR, Hou Z, Bolin JM, Ruotti V, et al. 2011. Chemically defined conditions for human ipsc derivation and culture. Nat. Methods 8(5):424–29 [DOI] [PMC free article] [PubMed] [Google Scholar]
- 135.Churko JM, Burridge PW, Wu JC. 2013. Generation of human ipscs from human peripheral blood mononuclear cells using non-integrative sendai virus in chemically defined conditions. Methods Mol. Biol 1036:81–88 [DOI] [PMC free article] [PubMed] [Google Scholar]
- 136.D’Antonio M, Woodruff G, Nathanson JL, D’Antonio-Chronowska A, Arias A, et al. 2017. High-throughput and cost-effective characterization of induced pluripotent stem cells. Stem Cell Reports 8(4):1101–11 [DOI] [PMC free article] [PubMed] [Google Scholar]
- 137.Tsankov AM, Akopian V, Pop R, Chetty S, Gifford CA, et al. 2015. A qpcr scorecard quantifies the differentiation potential of human pluripotent stem cells. Nat. Biotechnol 33(11):1182–92 [DOI] [PMC free article] [PubMed] [Google Scholar]
- 138.Danecek P, McCarthy SA, HipSci Consortium, Durbin R. 2016. A method for checking genomic integrity in cultured cell lines from snp genotyping data. PLoS ONE 11(5):e0155014. [DOI] [PMC free article] [PubMed] [Google Scholar]
- 139.Paull D, Sevilla A, Zhou H, Hahn AK, Kim H, et al. 2015. Automated, high-throughput derivation, characterization and differentiation of induced pluripotent stem cells. Nat. Methods 12(9):885–92 [DOI] [PMC free article] [PubMed] [Google Scholar]
- 140.Soares FAC, Sheldon M, Rao M, Mummery C, Vallier L. 2014. International coordination of large-scale human induced pluripotent stem cell initiatives: wellcome trust and isscr workshops white paper. Stem Cell Reports 3(6):931–39 [DOI] [PMC free article] [PubMed] [Google Scholar]
- 141.Warren CR, Jaquish CE, Cowan CA. 2017. The nextgen genetic association studies consortium: a foray into in vitro population genetics. Cell Stem Cell 20(4):431–33 [DOI] [PubMed] [Google Scholar]
- 142.Padovan-Merhar O, Nair GP, Biaesch AG, Mayer A, Scarfone S, et al. 2015. Single mammalian cells compensate for differences in cellular volume and dna copy number through independent global transcriptional mechanisms. Mol. Cell 58(2):339–52 [DOI] [PMC free article] [PubMed] [Google Scholar]
- 143.Carcamo-Orive I, Hoffman GE, Cundiff P, Beckmann ND, D’Souza SL, et al. 2017. Analysis of transcriptional variability in a large human ipsc library reveals genetic and non-genetic determinants of heterogeneity. Cell Stem Cell 20(4):518–532.e9 [DOI] [PMC free article] [PubMed] [Google Scholar]
- 144.Marx V. 2015. Stem cells: disease models that show and tell. Nat. Methods 12(2):111–14 [DOI] [PubMed] [Google Scholar]
- 145.Pashos EE, Park Y, Wang X, Raghavan A, Yang W, et al. 2017. Large, diverse population cohorts of hipscs and derived hepatocyte-like cells reveal functional genetic variation at blood lipid-associated loci. Cell Stem Cell 20(4):558–570.e10 [DOI] [PMC free article] [PubMed] [Google Scholar]
- 146.Sanchez-Freire V, Lee AS, Hu S, Abilez OJ, Liang P, et al. 2014. Effect of human donor cell source on differentiation and function of cardiac induced pluripotent stem cells. J. Am. Coll. Cardiol 64(5):436–48 [DOI] [PMC free article] [PubMed] [Google Scholar]
- 147.DeBoever C, Li H, Jakubosky D, Benaglio P, Reyna J, et al. 2017. Large-scale profiling reveals the influence of genetic variation on gene expression in human induced pluripotent stem cells. Cell Stem Cell 20(4):533–546.e7 [DOI] [PMC free article] [PubMed] [Google Scholar]
- 148.Panopoulos AD, D’Antonio M, Benaglio P, Williams R, Hashem SI, et al. 2017. IPSCORE: a resource of 222 ipsc lines enabling functional characterization of genetic variation across a variety of cell types. Stem Cell Reports 8(4):1086–1100 [DOI] [PMC free article] [PubMed] [Google Scholar]
- 149.Barabasi AL, Albert R. 1999. Emergence of scaling in random networks. Science 286(5439):509–12 [DOI] [PubMed] [Google Scholar]
- 150.Clune J, Mouret J-B, Lipson H. 2013. The evolutionary origins of modularity. Proc. Biol. Sci 280(1755):20122863. [DOI] [PMC free article] [PubMed] [Google Scholar]
- 151.Albert R, Jeong H, Barabasi AL. 2000. Error and attack tolerance of complex networks. Nature 406(6794):378–82 [DOI] [PubMed] [Google Scholar]
- 152.Jeong H, Tombor B, Albert R, Oltvai ZN, Barabási AL. 2000. The large-scale organization of metabolic networks. Nature 407(6804):651–54 [DOI] [PubMed] [Google Scholar]
- 153.Ideker T, Krogan NJ. 2012. Differential network biology. Mol. Syst. Biol 8:565. [DOI] [PMC free article] [PubMed] [Google Scholar]
- 154.Hu JX, Thomas CE, Brunak S. 2016. Network biology concepts in complex disease comorbidities. Nat. Rev. Genet 17(10):615–29 [DOI] [PubMed] [Google Scholar]
- 155.Langfelder P, Horvath S. 2008. WGCNA: an r package for weighted correlation network analysis. BMC Bioinformatics 9:559. [DOI] [PMC free article] [PubMed] [Google Scholar]
- 156.Rau CD, Wisniewski N, Orozco LD, Bennett B, Weiss J, Lusis AJ. 2013. Maximal information component analysis: a novel non-linear network analysis method. Front. Genet 4:28. [DOI] [PMC free article] [PubMed] [Google Scholar]
- 157.Cahan P, Li H, Morris SA, Lummertz da Rocha E, Daley GQ, Collins JJ. 2014. CellNet: network biology applied to stem cell engineering. Cell 158(4):903–15 [DOI] [PMC free article] [PubMed] [Google Scholar]
- 158.Fiers MWEJ, Minnoye L, Aibar S, Bravo González-Blas C, Kalender Atak Z, Aerts S. 2018. Mapping gene regulatory networks from single-cell omics data. Brief. Funct. Genomics [DOI] [PMC free article] [PubMed]
- 159.Chan TE, Stumpf MPH, Babtie AC. 2017. Gene regulatory network inference from single-cell data using multivariate information measures. Cell Syst 5(3):251–267.e3 [DOI] [PMC free article] [PubMed] [Google Scholar]
- 160.Dixit A, Parnas O, Li B, Chen J, Fulco CP, et al. 2016. Perturb-seq: dissecting molecular circuits with scalable single-cell rna profiling of pooled genetic screens. Cell 167(7):1853–1866.e17 [DOI] [PMC free article] [PubMed] [Google Scholar]
- 161.Jaitin DA, Weiner A, Yofe I, Lara-Astiaso D, Keren-Shaul H, et al. 2016. Dissecting immune circuits by linking crispr-pooled screens with single-cell rna-seq. Cell 167(7):1883–1896.e15 [DOI] [PubMed] [Google Scholar]
- 162.Warren CR, Cowan CA. 2018. Humanity in a dish: population genetics with ipscs. Trends Cell Biol 28(1):46–57 [DOI] [PMC free article] [PubMed] [Google Scholar]
- 163.Uosaki H, Cahan P, Lee DI, Wang S, Miyamoto M, et al. 2015. Transcriptional landscape of cardiomyocyte maturation. Cell Rep 13(8):1705–16 [DOI] [PMC free article] [PubMed] [Google Scholar]
- 164.Lusis AJ, Seldin MM, Allayee H, Bennett BJ, Civelek M, et al. 2016. The hybrid mouse diversity panel: a resource for systems genetics analyses of metabolic and cardiovascular traits. J. Lipid Res 57(6):925–42 [DOI] [PMC free article] [PubMed] [Google Scholar]
- 165.Flint J, Eskin E. 2012. Genome-wide association studies in mice. Nat. Rev. Genet 13(11):807–17 [DOI] [PMC free article] [PubMed] [Google Scholar]
- 166.Sayed N, Liu C, Wu JC. 2016. Translation of human-induced pluripotent stem cells: from clinical trial in a dish to precision medicine. J. Am. Coll. Cardiol 67(18):2161–76 [DOI] [PMC free article] [PubMed] [Google Scholar]
- 167.van den Berg CW, Okawa S, Chuva de Sousa Lopes SM, van Iperen L, Passier R, et al. 2015. Transcriptome of human foetal heart compared with cardiomyocytes from pluripotent stem cells. Development 142(18):3231–38 [DOI] [PubMed] [Google Scholar]
- 168.Zhang Z-N, Freitas BC, Qian H, Lux J, Acab A, et al. 2016. Layered hydrogels accelerate ipsc-derived neuronal maturation and reveal migration defects caused by mecp2 dysfunction. Proc Natl Acad Sci USA 113(12):3185–90 [DOI] [PMC free article] [PubMed] [Google Scholar]
- 169.Parikh SS, Blackwell DJ, Gomez-Hurtado N, Frisk M, Wang L, et al. 2017. Thyroid and glucocorticoid hormones promote functional t-tubule development in human-induced pluripotent stem cell-derived cardiomyocytes. Circ. Res 121(12):1323–30 [DOI] [PMC free article] [PubMed] [Google Scholar]
- 170.Ribeiro AJS, Ang Y-S, Fu J-D, Rivas RN, Mohamed TMA, et al. 2015. Contractility of single cardiomyocytes differentiated from pluripotent stem cells depends on physiological shape and substrate stiffness. Proc Natl Acad Sci USA 112(41):12705–10 [DOI] [PMC free article] [PubMed] [Google Scholar]
- 171.Yang X, Rodriguez M, Pabon L, Fischer KA, Reinecke H, et al. 2014. Tri-iodo-l-thyronine promotes the maturation of human cardiomyocytes-derived from induced pluripotent stem cells. J. Mol. Cell. Cardiol 72:296–304 [DOI] [PMC free article] [PubMed] [Google Scholar]
- 172.Horvath P, Aulner N, Bickle M, Davies AM, Nery ED, et al. 2016. Screening out irrelevant cell-based models of disease. Nat. Rev. Drug Discov 15(11):751–69 [DOI] [PubMed] [Google Scholar]
- 173.Tzatzalos E, Abilez OJ, Shukla P, Wu JC. 2016. Engineered heart tissues and induced pluripotent stem cells: macro- and microstructures for disease modeling, drug screening, and translational studies. Adv. Drug Deliv. Rev 96:234–44 [DOI] [PMC free article] [PubMed] [Google Scholar]
- 174.Abilez OJ, Tzatzalos E, Yang H, Zhao M- T, Jung G, et al. 2018. Passive stretch induces structural and functional maturation of engineered heart muscle as predicted by computational modeling. Stem Cells 36(2):265–77 [DOI] [PMC free article] [PubMed] [Google Scholar]
- 175.Giacomelli E, Bellin M, Sala L, van Meer BJ, Tertoolen LGJ, et al. 2017. Three-dimensional cardiac microtissues composed of cardiomyocytes and endothelial cells co-differentiated from human pluripotent stem cells. Development 144(6):1008–17 [DOI] [PMC free article] [PubMed] [Google Scholar]
- 176.Kuijlaars J, Oyelami T, Diels A, Rohrbacher J, Versweyveld S, et al. 2016. Sustained synchronized neuronal network activity in a human astrocyte co-culture system. Sci. Rep 6:36529. [DOI] [PMC free article] [PubMed] [Google Scholar]
- 177.Dutta D, Heo I, Clevers H. 2017. Disease modeling in stem cell-derived 3d organoid systems. Trends Mol. Med 23(5):393–410 [DOI] [PubMed] [Google Scholar]
- 178.Liu C, Oikonomopoulos A, Sayed N, Wu JC. 2018. Modeling human diseases with induced pluripotent stem cells: from 2d to 3d and beyond. Development 145(5): dev156166 [DOI] [PMC free article] [PubMed] [Google Scholar]
- 179.Lo Sardo V, Ferguson W, Erikson GA, Topol EJ, Baldwin KK, Torkamani A. 2017. Influence of donor age on induced pluripotent stem cells. Nat. Biotechnol 35(1):69–74 [DOI] [PMC free article] [PubMed] [Google Scholar]
- 180.Sharma A, Diecke S, Zhang WY, Lan F, He C, et al. 2013. The role of sirt6 protein in aging and reprogramming of human induced pluripotent stem cells. J. Biol. Chem 288(25):18439–47 [DOI] [PMC free article] [PubMed] [Google Scholar]