Abstract
The ability of cytoskeletal motors to move unidirectionally along filamentous tracks is central to their role in cargo transport, motility and cell division. While kinesin and myosin motor families have members that move in opposite directions1, 2, all dyneins studied to date exclusively move towards the microtubule (MT) minus-end3. In order to understand the mechanism of dynein’s directionality, we sought to engineer a plus-end-directed dynein guided by cryo-electron microscopy and molecular dynamics simulations. As shown by single-molecule assays, elongation or shortening of the coiled-coil stalk that connects the motor to the MT controls helical directionality of S. cerevisiae dynein around MTs. By changing the length and angle of the stalk, we successfully reversed the motility towards the MT plus-end. These modifications act by altering the direction dynein’s linker swings relative to the MT, not by reversing the asymmetric unbinding of the motor from MT. Because the length and angle of dynein’s stalk are fully conserved among species, our findings provide an explanation for why all dyneins move towards the MT minus-end.
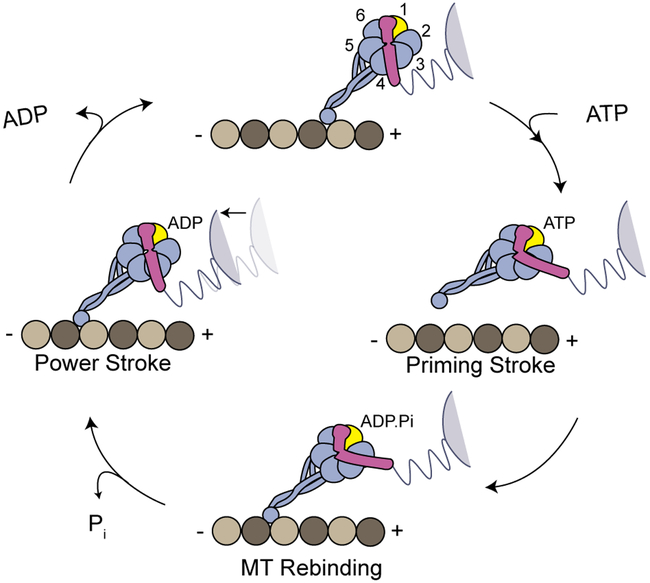
Dyneins are a family of AAA+ motors responsible for nearly all minus-end directed motility and force generation functions along MTs 3–5. Due to roles in intracellular transport, cell division and axonemal beating, defects in dynein motility are linked to many developmental and neurodegenerative disorders6. The dynein motor domain contains a catalytic ring of six AAA+ modules (AAA1–6) connected to a MT binding domain (MTBD) by an antiparallel coiled-coil stalk (Fig. 1a)7. Motility is powered by conformational changes of a linker that resides on the face of the ring. ATP binding to AAA1 triggers MT release and moves the linker into a bent conformation, referred to as the priming stroke3. After ATP hydrolysis, dynein rebinds to the MT and the linker returns to its straight conformation8–11, which serves as the force-generating powerstroke of dynein’s mechanochemical cycle11 (Extended Data Fig. 1).
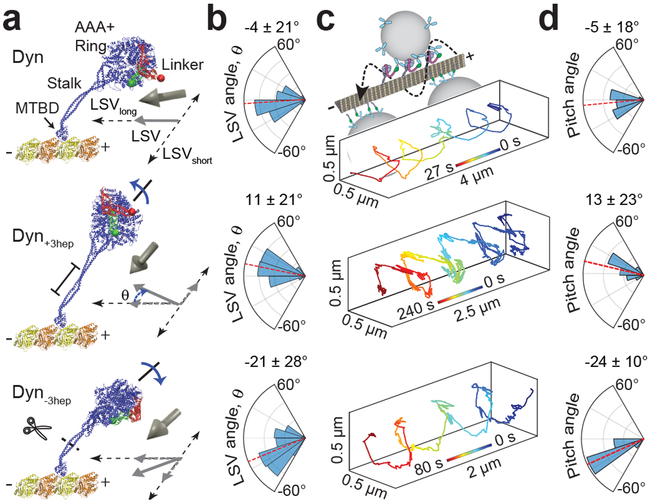
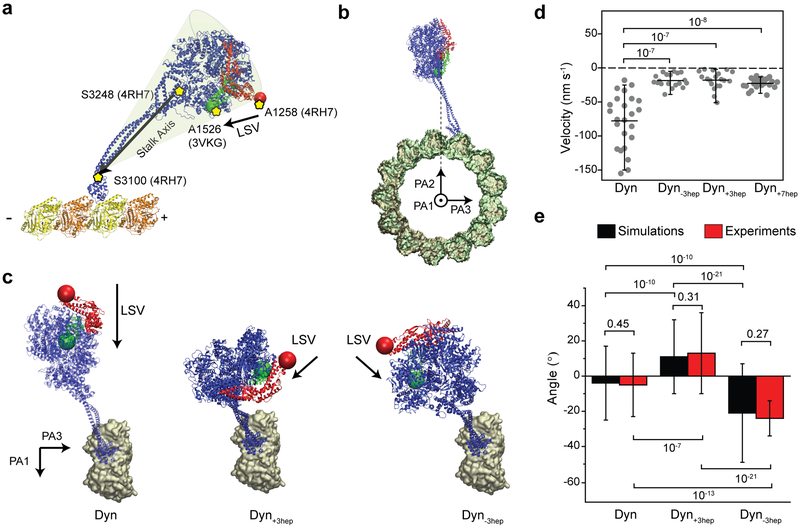
Figure 1 ∣. The stalk length is critical to align dynein motility along the MT long-axis.
a, A dynein head is superimposed onto an MT and the linker is highlighted in its pre- (red) and post-powerstroke (green) conformation (Protein Data Bank (PDB) accession numbers 3VKG, 4RH7, 3J1T). The LSV (grey arrow) is defined as the displacement of the linker from the pre- (red bead) to post-powerstroke (green bead) conformation. The projection of LSV to MT long axis is pointed towards the minus-end for Dyn (see Methods). Dyn+3hep and Dyn−3hep were modeled by +3hep insertion and −3hep deletion of the stalk and re-alignment of the stalk coiled-coils in Dyn conformations obtained from MD simulations. Changing the stalk length is expected to rotate the ring and project LSV sideways (θ). b, Calculated LSV angles from MD simulations (mean ± s.d., n = 1,680 conformations from 3 different simulations). c, (Top) A schematic represents helical motility of 0.5 µm diameter cargo beads driven by monomeric dyneins around a MT bridge. (Bottom) Example trajectories of beads driven by Dyn, Dyn+3hep and Dyn−3hep. Cargo beads carried by Dyn+3hep and Dyn−3hep rotate clockwise and counterclockwise around a MT, respectively. d, The histogram of the pitch angles (mean ± s.d.; from top to bottom, nbeads = 24, 20, 19 and nrotations = 99, 59, 72 from two independent experiments).
There are two current models for the mechanism underlying dynein directionality. The linker swing vector (LSV) model suggests that the motor domain pivots around the linker and its stepping follows the direction the linker swings relative to the MT8, 12, 13 (Extended Data Fig. 1). Because dynein has multiple flexible elements in its structure14, 15, it remains unclear whether the LSV mechanism is capable of providing a net bias towards the minus-end during stepping. Alternatively, the asymmetric release model proposes that faster release of dynein when pulled towards the minus-end5, 16, 17 creates a net bias in minus-end directionality. Consistent with this model, an engineering study18 that replaced dynein’s MTBD with actin binding proteins suggested that unidirectional motility can be facilitated by asymmetric release from the cytoskeletal track, regardless of which direction LSV is pointed.
We tested the LSV model by altering the direction in which the linker swings and determining how this affects dynein motility. According to this model, pointing LSV sideways relative to the MT would create a net bias on helical directionality of dynein around the circumference of MTs. All-atom molecular dynamics (MD) simulations predicted that elongation or shortening of the stalk coiled-coils by 3 heptads (Dyn±3hep) rotates the AAA+ ring around the stalk axis and shifts the LSV rightward and leftward, respectively, along the MT short-axis (LSVshort, Fig. 1a-b, Extended Data Figs. 2 and 3). We determined the helical directionality of dynein-driven beads on MT bridges19. As previously observed20, 21, the beads driven by tail-truncated monomeric dynein (Dyn) moved in both clockwise and counterclockwise helical trajectories without a significant sideways bias (p = 0.05, Student’s t-test, Fig. 1c-d). In contrast, beads driven by Dyn+3hep rotated mostly clockwise, while Dyn-3hep rotated the beads counterclockwise around MTs (Fig. 1c-d, Supplementary Video 1), consistent with the predicted directions of their LSVshort (Fig. 1a-b, Extended Data Fig 3). We concluded that the stalk length of native dynein is critical for restricting sideways movement and directing motility primarily along the MT long-axis.
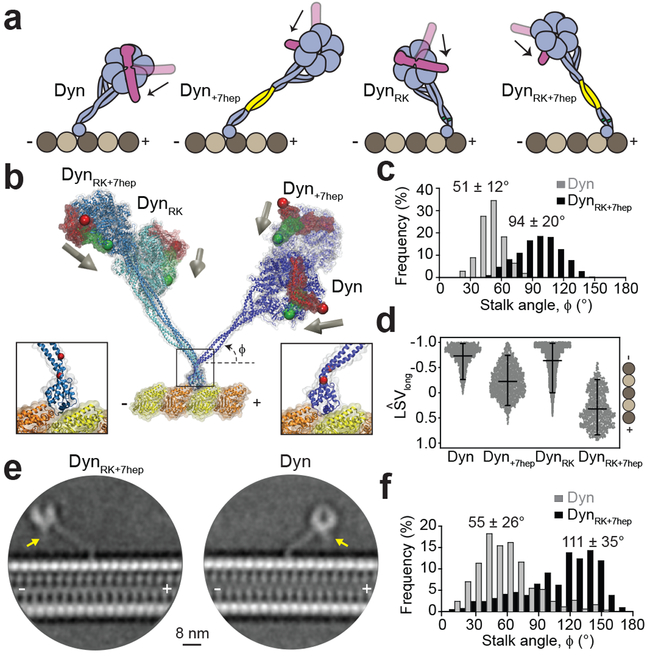
Altering the stalk length, which rotates the AAA+ ring relative to the stalk axis, did not affect the minus-end directionality of dynein motility12 (Extended Data Fig. 3d). This could be because dynein’s stalk is tilted ~45° towards the plus-end (Fig. 2a), which points the LSV long-axis component (LSVlong) to the minus-end Imai, 2015 #3872;Carter, 2008 #2822;Redwine, 2012 #3620} (Fig. 2d). To change the stalk angle, we shifted the positions of two fully-conserved proline residues at the base of MTBD along the stalk coiled-coils (Extended Data Figs. 2, 4 and 5). MD simulations indicated that a dynein mutant with a two-residue shift of both prolines (“reverse kink”, DynRK, Extended Data Fig 2) can fold properly into a well-ordered structure in which the stalk is tilted in the reverse direction (Fig. 2b-c, Extended Data Fig. 6, Supplementary Video 2). Simulations also predicted that pointing LSVlong towards the plus-end requires not only tilting of the stalk towards the minus-end, but also reversal of the ring relative to the stalk axis with +7hep insertion (DynRK+7hep, Fig. 2b-d, Extended Data Fig. 2).
Figure 2 ∣. The stalk angle is reversed by shifting the position of two conserved prolines.
a, Expected LSVlong orientation (black arrow) in Dyn, Dyn+7hep, DynRK and DynRK+7hep. Altering both the angle and length of the stalk in DynRK+7hep is expected to direct LSVlong towards the MT plus-end. b, Example snapshots from all-atom MD simulations for an N-terminal truncated dynein monomer in the pre-powerstroke conformation docked onto MT. Post-powerstroke conformation of the linker was superimposed to calculate the LSV orientation (grey arrows). (Right insert) Simulations confirmed plus-end directed tilt of Dyn’s stalk due to two conserved proline residues (red) at its base. (Left insert) DynRK and DynRK+7hep can fold into a reverse kink structure by shifting the positions of the proline residues two positions away from MTBD. c, Stalk angle (ϕ) distributions from Dyn and DynRK+7hep simulations (n =1,680 and 2,270 conformations for Dyn and DynRK+7hep, respectively; mean ± s.d., p = 10−59). d, The length of the LSV unit vector projected onto the MT long axis measured by MD simulations (mean ± s.d.). −1 corresponds to LSV pointed towards the minus-end. The center line and edges represent mean and 5-95%, respectively (n = 1,680, 1,680, 11,637, 2,270 from left to right; p = 10−59, 10−55 and 10−59 for Dyn versus Dyn+7hep, DynRK or DynRK+7hep, respectively). e, CryoEM 2D class averages of Dyn and DynRK+7hep monomers bound to a MT show different orientations of their stalk. Arrows point to the N-terminus of the linker. f, The histogram of the stalk angles for Dyn (n = 392) and DynRK+7hep (n = 421) relative to the MT long-axis (mean ± s.d., p = 10−15). 180° represents tilting of the stalk towards the MT minus-end. p-values are calculated from a two-sided t-test.
To test the structural predictions of the MD simulations, we imaged monomeric Dyn and DynRK+7hep bound to MTs using cryo-electron microscopy (cryoEM, Extended Data Fig. 7). Two-dimensional classification of DynRK+7hep showed that the stalk length was extended to 18.5 ± 1.9 nm, compared to 12.7 ± 1.2 nm for Dyn (Fig. 2e, mean ± s.d.), compatible with the predicted ~7 nm elongation of the stalk due to +7hep insertion (Extended Data Fig. 6). Centered on a pivot at the base of the stalk, a broad range of stalk angles was observed for both Dyn and DynRK+7hep (Supplementary Video 3, Fig. 2f). The average Dyn stalk angle was measured as 55 ± 26° (Fig. 2f) 12, 14, 22. DynRK+7hep had a wider distribution of stalk angles and the majority of the molecules had their stalk tilted towards the opposite direction to Dyn (111 ± 35°, mean ± s.d.). Density for the linker remains below the ring for DynRK+7hep (Fig. 2e), showing that the ring is rotated relative to its stalk axis. These results confirm our prediction that RK+7hep modifications reverse the stalk angle and rotate the ring relative to the stalk axis.
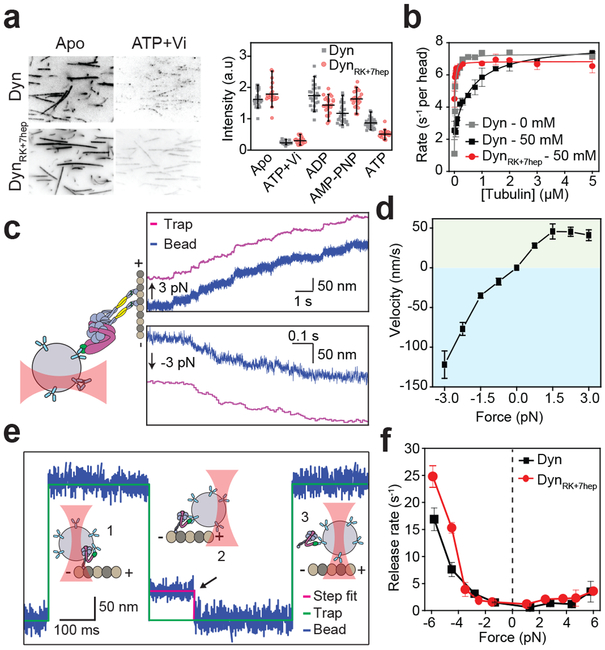
We next tested whether mutations to the DynRK+7hep stalk disrupt the mechanical properties crucial for robust dynein motility23, 24. MT affinity of monomeric DynRK+7hep was similar to Dyn under different nucleotide conditions (Fig. 3a). DynRK+7hep showed robust MT-stimulated ATPase activity, albeit with an elevated basal ATPase and slightly lower catalytic rate compared to Dyn (Fig. 3b, Extended Data Table 1a). We also determined how external load affects the velocity and MT release of DynRK+7hep using an optical trap. Similar to Dyn25, a full-length DynRK+7hep moved processively towards the direction of applied load in the absence of nucleotide. Velocity increased continuously when the motor was pulled towards the minus-end, whereas the motility was slow when pulled towards the plus-end (Fig. 3c-d). A DynRK+7hep monomer has similar force-induced MT release rates to Dyn, rapidly releasing from MTs when pulled towards the minus-end and resisting a plus-end directed pull of the optical trap (Fig. 3e-f, Extended Data Fig. 8). Therefore, the mutations we introduced in DynRK+7hep do not disrupt nucleotide-dependent communication between the ring and MTBD or the asymmetric release from MT.
Figure 3 ∣. Reversal of the stalk angle does not disrupt nucleotide- and force-induced release of dynein from MT.
a, (Left) Representative images and (Right) the intensity of 100 nM GFP-tagged Dyn and DynRK+7hep monomers on sea urchin axonemes under given nucleotide conditions. Similar to Dyn, DynRK+7hep released from MTs in the ADP-Pi state, mimicked by ATP and vanadate (Vi, n = 40 axonemes from three independent measurements, mean ± 95% confidence intervals). b, MT-stimulated ATPase activity of dynein in 2 mM ATP (mean ± s.d. from three independent measurements) under different salt concentrations. Solid curves represent fit to the Michaelis-Menten kinetics. c, (Left) Full-length DynRK+7hep was attached to a polystyrene bead and pulled by constant load using optical trap (not to scale). (Right) Representative trajectories of single DynRK+7hep when pulled by 3 pN towards the plus- (positive forces, n = 20 beads) and minus-end (negative forces, n = 20 beads) of a MT. d, Force-velocity relationship of DynRK+7hep in the apo condition (mean ± s.e.m., n = 20, 21, 19, 16, 15, 23, 15, 15, 20 beads from left to right). e, Dynein monomers were attached to a polystyrene bead through their linker and oscillated ±150 nm along the MT long-axis by optical trap (1). When a molecule binds to the MT (2), the movement of the bead to the next trap position is restricted and the trap exerts a constant force until the motor releases from the MT (the black arrow, 3). f, Similar to Dyn, DynRK+7hep favors faster release from a MT when pulled towards the minus-end. Rates are calculated from an exponential decay fit to the dwell time histograms (n = 120 dwells for each force range from two biological replicates, mean ± s.d.).
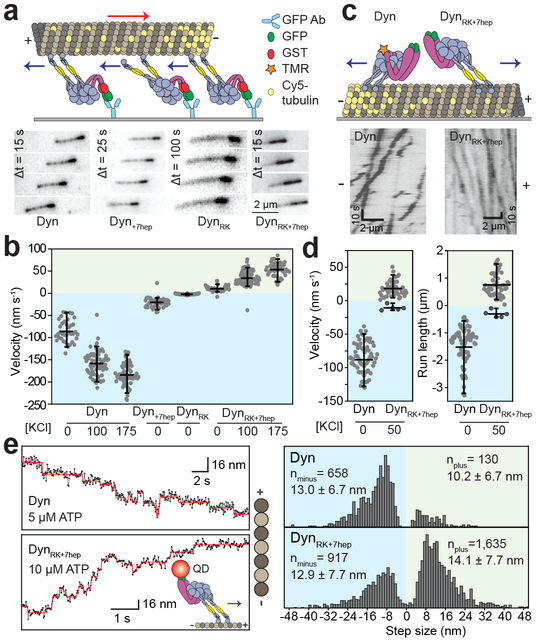
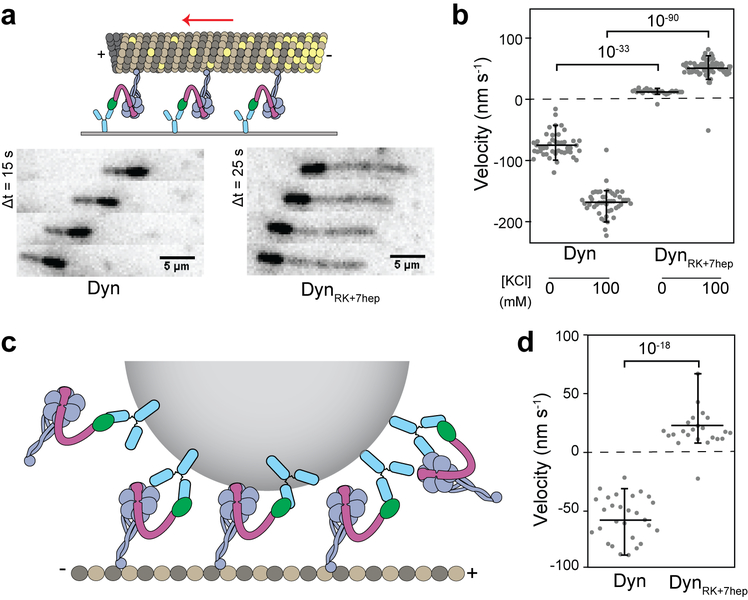
We inserted these mutations into tail-truncated, GST-dimerized dynein4 and tested the directionality of their motility in MT gliding assays (Fig. 4a). DynRK motors exhibited very slow motility towards the minus-end (Fig. 4b, Supplementary Video 4) consistent with the predicted direction of its LSV (Fig. 2d). In contrast, DynRK+7hep glided all MTs towards the plus-end (Fig. 4b), demonstrating that modifications in this construct successfully reverse dynein direction. Increasing the ionic strength resulted in faster gliding velocity of both Dyn and DynRK+7hep without affecting their directionality (Fig. 4b, Supplementary Video 5). We also observed robust plus-end directionality of multiple monomeric DynRK+7hep in MT gliding and bead motility assays (Extended Data Fig. 9, Supplementary Video 7).
Figure 4 ∣. Dynein’s directionality is reversed by altering the length and the angle of its stalk.
a, (Top) The schematic represents the MT gliding activity of surface-immobilized dyneins. (Bottom) Time-lapse recordings show that Dyn, Dyn+7hep and DynRK glide MTs with the plus-end in the lead, whereas DynRK+7hep glides MTs towards the opposite direction. b, MT gliding velocity and directionality of dynein mutants at given salt concentrations. Negative velocities correspond to minus-ended directed motility. n = 38, 69, 60, 49, 59, 49, 83 and 53 MTs from left to right (p = 10−46 and 10−43 for Dyn versus DynRK or DynRK+7hep, respectively). c, (Top) Schematic representing single molecule motility assays. (Bottom) Example kymographs show processive motility of Dyn and DynRK+7hep dimers. d, Velocity and run length of Dyn and DynRK+7hep dimers. n = 67 and 52 motors from left to right (p = 10−45). e, (Left) Example trajectories QD-labeled Dyn and DynRK+7hep stepping along MTs at 20 ms temporal resolution. The QD position (solid dots) was fit by a step-finding algorithm (red lines). (Right) Histogram of step size distribution (mean ± s.d.). In b, d and e, yellow and cyan shaded regions represent plus- and minus-end directed motility, respectively. In b and d, the center line and edges represent mean and 5-95%, respectively. In d and e, mean values for plus- and minus-end directed runs and steps are calculated separately. p-values are calculated from a two-sided t-test.
In single molecule motility assays (Fig. 4c), 90% of full-length DynRK+7hep dimers walked processively towards the plus-end (Fig. 4d, Extended Data Table 1a, Supplementary Video 6) by taking nanometer-sized steps (Fig. 4e). The average step size of DynRK+7hep in the plus-end direction was slightly higher (14.1 ± 7.7 nm) than the Dyn step size towards the minus-end (13.0 ± 6.7 nm, p = 0.026, t-test), suggesting that lengthening the stalk causes a modest increase in step size. When we compared backward stepping, DynRK+7hep took minus-end directed steps more frequently than Dyn took plus-end directed steps (35% vs 16%, chi-square test, p =10−24, Fig. 4e). This might result from tension-induced stepping, which favors minus-end directed stepping of both Dyn16, 17, 20, 21 and DynRK+7hep (Fig. 3c-f). Collectively, these results provide direct evidence that dynein’s direction is reversed when the LSV is pointed towards the plus-end. Because DynRK+7hep and Dyn share the same response to applied tension but move in opposite directions, our results are inconsistent with tension-induced release as the primary mechanism of dynein directionality.
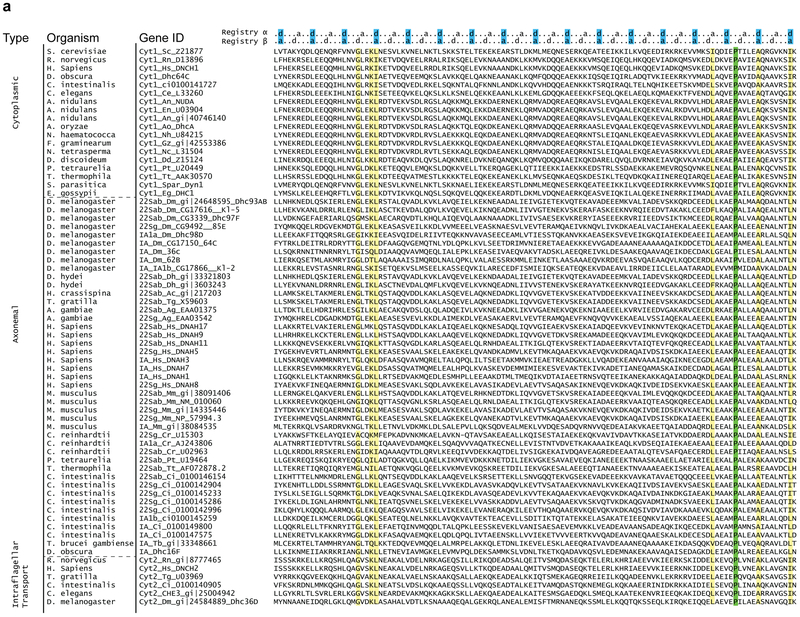
In this study, we successfully directed dynein motility leftward, rightward and backward by altering the direction of LSV. Two critical features of dynein’s stalk, the length of its antiparallel coiled-coils and the sharp angle it makes relative to the MT, direct LSV in a plane parallel to the MT towards the minus-end. Both of these features are fully conserved in cytoplasmic and ciliary dyneins across species26 (Extended Data Fig. 4-5), suggesting that all dyneins are minus-end directed motors. Inner-arm dyneins typically have additional proline residues in their stalk, which may alter the LSV for generating the ciliary waveforms.
Which step of the mechanochemical cycle provides a net bias for unidirectional motility? Because dynein heads step independent of each other20, 21, a single head of a dynein dimer must be able to release from MT, move forward and rebind MT without a need for pulling or pushing of its partner head16, 20. We propose that, as the stepping head releases from MT, the priming stroke of its linker biases the stepping direction towards the minus-end. After the head rebinds to MT, the powerstroke of its linker pulls the cargo towards the minus-end8, 13 (Extended Data Fig. 1). This tethered excursion mechanism is fundamentally distinct from the directionality of kinesin-1 and myosin V, in which the powerstroke of the head in the leading position pulls the lagging head forward1, 2.
Methods
Construct Design, Protein Expression and Labeling
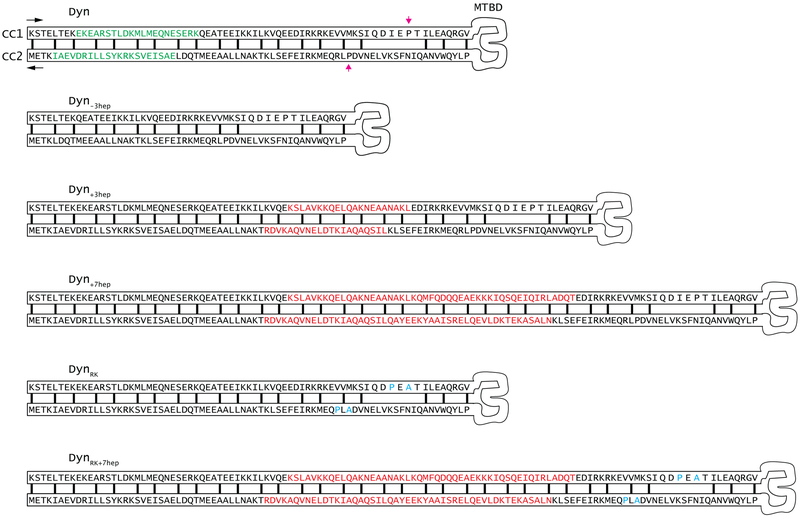
An N-terminal truncated S. cerevisiae cytoplasmic dynein gene (DYN1) encoding amino acids 1219–4093 (predicted molecular weight 331 kD, referred to as Dyn) was used as a template for mutagenesis. Constructs were prepared by gene synthesis of the stalk region. DNA fragments were inserted into the genome of haploid yeast cells by homologous recombination to replace a URA3 cassette (Extended Data Fig. 2). A ZZ affinity tag and a TEV protease cleavage site was inserted to the N-terminus for purification and a DHA tag was inserted at the N- or C-termini for labeling (Extended Data Table 1b)4. The constructs were purified by binding the cell lysate to IgG beads and cleaving the protein from the beads with Tev protease4. Motors were labeled with 10 µM fluorescent dyes functionalized with alkyl chloride when bound to IgG beads and the excess dye was removed before Tev cleavage.
EM Sample Preparation
Lyophilized porcine brain tubulin (Cytoskeleton) was resuspended to 10 mg ml−1 in MES-MT buffer (30 mM MES pH 6.5, 70 mM NaCl, 1 mM MgCl2, 1 mM DTT) and aliquoted. For polymerization, aliquots were diluted 2-fold in MES-MT buffer supplemented with 6 mM GTP (Sigma), followed by incubation at 37 °C for 90 min. A further 2-fold dilution in MES-MT buffer supplemented with 20 µM taxol was made, and the MTs were left at room temperature overnight. Monomeric Dyn or DynRK+7hep was diluted 5-fold into cold BRB10 (10 mM PIPES pH7.0, 1 mM EGTA, 1 mM MgCl2, 1 mM DTT, 0.1% Tween-20), and concentrated to the original volume in an Amicon 100 MWCO 0.5 ml centrifugal concentrator. Complete buffer exchange was achieved through two further cycles of dilution and concentration, resulting in a total dilution factor of 125. MTs were pelleted at 20,000 rcf for 10 min and resuspended in room temperature BRB10. 3 min prior to grid freezing, a mixture containing 1 µM MT and 150 nM dynein was made up in room temperature BRB10. 4 µL of this sample was applied to Quantifoil Au300 R1.2/1.3 grids held in a FEI Vitrobot III chamber set to 100% humidity, 22°C. Following 4–4.5 s blotting, the grid was plunged into liquid ethane and stored in liquid nitrogen until imaging.
EM Imaging and Data Analysis
Grids were loaded into a Gatan 626 cryo-holder and imaged in an FEI F20 TEM operating at 200 kV, equipped with a Falcon II detector reading out a single integrated average. Images were semi-automatically acquired with EPU, at a defocus of −4 µm, a flux of 50 e Å−2 s−1, an exposure of 1.5 s and a pixel size of 2.06 Å2. Analysis of dynein on MTs was performed as described previously14. Contrast transfer function was determined using GCTF, and micrographs were phase-flipped accordingly in Relion. MT polarity was determined in FIJI (Extended Fig. 5c-g27), and the MTs were boxed out into new images such that their plus-end point towards the right of the image. The MT was duplicated and reflected through the long axis to ensure all unique particles were on the top edge. Monomeric dyneins were picked manually in Relion, centered at the point the stalk reaches the top edge of the MT. Particles were disregarded if the kink at the base of the stalk was not observed, or if any neighboring particles overlapped. 2D classification into a single class each for Dyn and DynRK+7hep aligned the particles to each other. The angle of the stalk relative to the MT long-axis and stalk length was measured for each particle in FIJI.
To simulate projections of the motor on a MT the following PDB entries were used: 3VKG10 (for the stalk) and 4AI611 (for the ADP-bound state of the ring and linker). The coordinates were converted into a simulated electron density volume with the EMAN program “pdb2mrc”. The volume was bandpass filtered between 30 Å and 500 Å using “bfilter” and projected in different orientations in Relion.
Fluorescence Microscopy
Assays were performed on a custom-built objective-type total internal reflection fluorescence (TIRF) microscope, equipped with Nikon Ti-Eclipse inverted microscope body, the perfect focusing system, and a 1.49 NA 100X oil immersion objective (Nikon). The fluorophores were excited with 488 nm (for GFP and QDs) and 561 nm (for TMR and Cy3) and 633 nm (for Cy5) lasers and the fluorescent signal was detected by the EM-CCD camera (Ixon, Andor) with an effective pixel size of 106 nm. The videos were recorded at 1 Hz. For dual color imaging, fluorescence emission was separated into two channels on a CCD camera using Optosplit II (Cairn) image splitter.
MT-Bridge Assays
Bead motility assays on MT bridges were performed as previously described19. Briefly, 2 µm diameter polystyrene beads were coated with an anti-GFP antibody (Covance) using EDC-NHS crosslinking. The beads were incubated with 0.5 µM SRS85:82-GFP23 and excess protein was removed by pelleting the beads. The beads were non-specifically adsorbed to the surface of the flow chamber and the surface was pre-blocked with 30 µL DLBC (DLB buffer (30 mM HEPES pH 7.4, 1 mM EGTA, 2 mM MgCl2, and 10% glycerol) supplemented with 1 mg ml−1 casein). 15 µg ml−1 Cy3-labeled MTs were flown into the chamber. After 10 min, unbound MTs were removed by a 30 µL DLBC wash. 0.5 µm diameter anti-GFP antibody coated beads were incubated on ice with 5–10 nM GFP-dynein for 10 min and flown into the chamber in the imaging buffer. The sample was placed on a brightfield microscope equipped with Nikon Ti-E Eclipse microscope body, a Nikon 100× 1.49 NA oil immersion objective, Nikon 1.4 NA oil condenser and LED white-light illuminator (Sutter). The sample was scanned for a MT bridge that is longer than 10 µm and oscillates less than 2 pixels. Spontaneous attachment of freely diffusing dynein-coated beads and their processive motility along the MT bridges were captured with the CMOS camera (Hamamatsu) at 10 Hz with an effective pixel size of 57 nm. Cargo beads were tracked using a Gaussian fitting algorithm in MATLAB. The helical pitch (λ) was calculated from the periodicity of the x-y projection of the traces between peak to peak positions19. Distance between the center of the MT cylinder and pivoting point of dynein’s at their linker domain (r) was estimated to be 27 nm. The pitch angle was defined as tan−1(2πr/ λ). The z position of a bead was calibrated by measuring the intensity of surface immobilized 0.5 µm beads while the microscope objective was moved ±250 nm in the z-direction with 25 nm increments using a piezoelectric objective scanner (Physik Instrumente).
Gliding Assays
In order to polarity-mark the MTs, N-ethylmaleimide (NEM) modified tubulin was prepared by mixing 10 mg ml−1 unlabeled tubulin (purified from porcine brain28) in BRB80 [80 mM PIPES pH 6.8, 1 mM EGTA, 2 mM MgCl2] with 1 mM NEM and 0.5 mM GTP for 10 min on ice. The reaction is quenched with 8 mM β-mercaptoethanol (βME) for 30 min on ice. Brightly labeled MT seeds were polymerized by incubating 0.4 mg ml−1 Cy3-labeled tubulin, 0.5 mg ml−1 unlabeled tubulin, 1 mM GMP-CPP (Jena BioSciences) and 1 mM DTT in BRB80 for 15 min at 37 ℃. 1.5 µl seed was added to a mixture containing 0.1 mg ml−1 Cy3-tubulin, 1 mg ml−1 unlabeled tubulin, 1 mg ml−1 NEM-modified tubulin, 1 mM GTP and 1 mM DTT in BRB80 and incubated at 37 ℃. Immediately after mixing, 2 µL of 2 µM, 20 µM, and 200 µM taxol was added with 10 min breaks. After additional 15 min incubation at 37°C, MTs were pelleted over 300 µL 30% glycerol cushion at 65,000 g for 10 min. The pellet was resuspended in BRB80 with 20 µM taxol and 1 mM DTT and stored in dark at room temperature. Polarity-marked MTs were prepared fresh daily for the gliding assays.
For MT gliding assays4, rabbit monoclonal anti-GFP antibody (~0.4 mg ml−1, Covance) was flown to an assay chamber and incubated for 5 min. The chamber was washed with 60 µl of buffer DLBCT (DLBC supplemented with 20 µM taxol). 10 µl of 20 nM GFP-tagged motor in DLBCT was added to the chamber. After 3 min incubation, unbound motor was removed by 30 µl DLBCT wash. 10 µL 200 nM freshly polymerized polarity-marked MTs were flown to the chamber and allowed to bind dynein for 2 min. The chamber was washed with 100 µl of DLBCT. 30 µl of imaging buffer (DLBCT supplemented with 2.5 mM PCA (protocatechuic acid), 50 nM PCD (protocatechuate-3,4-dioxygenase) and 1 mM ATP) containing the desired KCl concentration was flown to the chamber.
Single-Molecule Motility Assays
Sea urchin axonemes were immobilized on a glass coverslip in a flow chamber. The chamber was washed with 50 µl DLBC. 200 pM GFP-tagged mutant dynein and TMR-tagged wild-type dynein were added into the chamber in DLBC and allowed to bind MTs for 3 min. The chamber was then washed with 100 µl DLBC and 20 µl imaging buffer. Two fluorescent channels were overlaid, and the velocity and directionality of the constructs was determined with kymograph analysis using ImageJ.
For high resolution tracking assays, 655 nm amine-labeled quantum dots (QDs, Invitrogen) were coated with anti-GFP antibody by using sulfo-SMCC (sulfosuccinimidyl 4-(N-maleimidomethyl) cyclohexane-1-carboxylate) as a cross-linking reagent. 100 nM QD was mixed with 25 µM sulfo-SMCC (~250-fold molar excess) and incubated for 1 h. Excess sulfo-SMCC was removed by using 30k MWCO spin-concentrator with 3 consecutive dilutions into DLB. 0.4 mg ml−1 anti-GFP antibodies were reduced with 4 mM TCEP (tris (2-carboxyethyl) phosphine) for 30 min and mixed with QDs. After 1 h, excess antibody was removed by using spin filter for 3 consecutive dilutions into 25 mM sodium borate buffer pH 8.0 and concentrated to 5 µM for storage. All reactions were performed in room temperature.
5 µM anti-GFP antibody labeled QDs was mixed with 100 nM GFP-tagged dynein with 1:1 ratio and incubated 15 min on ice. Polarity-marked and biotinylated MTs were immobilized on the coverslips using biotinylated-BSA and streptavidin. Dynein-QD mixture was diluted 100-fold and were flown into the chamber. After 3 min incubation, the chamber was washed with 100 µl DLBC and 20 µl imaging buffer containing 5–10 µM ATP. Two fluorescent channels of Cy3-labeled MTs and QDs were overlaid to determine the directionality of the motility at 20 ms temporal resolution. Comparison of the number of GFP versus QD spots that moved along MTs suggested that ~10% of dyneins were labeled with a QD under these conditions.
The QD position was tracked by Fluorescence Imaging with One Nanometer Accuracy (FIONA)29 using a two-dimensional Gaussian fitting algorithm in ImageJ. Obtained traces were fit using a custom written step finding algorithm with a least-squares minimization25. All of the traces were visually checked for the goodness of the fit and manual adjustments were implemented in less than 5% of the analyzed steps.
Optical Trapping Assay
Sea urchin axonemes were immobilized on a glass coverslip in a flow chamber. The chamber was washed with 50 µl DLBC. MT polarity of surface-immobilized axonemes was determined by adding ~2 nM TMR-labeled dynein into the chamber in DLBC with 10 µM ATP, waiting for 4 min to allow accumulation of TMR-dynein at the MT minus end and washing the chamber with 150 µL DLBC supplemented with 0.5 U ml−1 apyrase to consume the left-over ATP in the assay chamber16. TMR signal on axonemes were visualized with an CMOS camera (Hamamatsu) under 532 nm TIRF excitation. N-terminal GFP tagged motors were mixed with GFP-antibody coated polystyrene beads (0.86 µm diameter, Invitrogen)19. The motor-bead mixture was diluted 10-fold in DLBC supplemented with the PCA/PCD oxygen scavenging system and 0.5 U ml−1 apyrase and flown into the chamber. The motor:bead ratio was adjusted to a level in which 5–15% of the trapped beads that are brought near an axoneme bind to a MT within 1 min. >90% of the MT binding events were terminated with a single release step, indicative of binding of a single dynein monomer to a MT.
A force-feedback controlled optical trap was custom built using a 2 W 1064 nm continuous wave laser (Coherent), a Nikon Ti-Eclipse microscope body and a Nikon 100× 1.49 NA oil immersion objective. Typically, 0.86 µm diameter beads were trapped by a ~50 mW laser beam to obtain a spring constant of ~0.05 pN nm-1. The trapping beam was steered by a two-axis acousto-optical deflector (AOD, AA Electronics) to trap freely diffusing monodisperse beads, lower them over surface-immobilized sea urchin axonemes and oscillate the bead ±150 nm along the MT long-axis at 1 Hz. Trap stiffness was calibrated for each sample by trapping a bead 3 µm above the surface of the coverslip and fitting the power spectrum of a bead to a Lorentzian curve30. The bead displacement was detected by a position sensitive detector (PSD, First Sensor) located at a plane conjugate to the back focal plane of the objective. The PSD data was recorded at 20 kHz for calibration and 5 kHz for data acquisition. The PSD response was calibrated by AOD raster scanning of the laser beam across a trapped bead in both x and y directions and a cubic polynomial fitting of the resulting curve. This calibration was repeated at the surface to avoid systematic errors in stiffness calibration. The data acquisition software monitored bead-trap separation in real time to prevent back-and-forth oscillations of the trap during a binding event. MT release events were determined with a step-finding algorithm31. Dwell times were binned by applied force and cumulative distribution function of each bin was fitted into a two-exponential decay function.
For force-feedback assays, beads were sparsely coated with full-length GFP-DynRK+7hep and brought to the proximity of the axonemes. Trap was moved ±500 nm along length of axonemes. When the bead-trap separation reaches 100 nm after dynein binds to a MT, force-feedback control was activated and trap position was updated at 100 Hz to keep the applied force constant. Trap stiffness was adjusted to exert constant forces between 0.75 and 3 pN. The velocity of the movement was calculated by the slope of the bead trajectories. Runs shorter than 0.6 s were excluded from data analysis.
ATPase Assays
The MT-stimulated ATPase assays were performed using an EnzCheck Phosphate Assay Kit (Life Technologies) and a 96-well plate reader (μQuant, BioTek Instruments). A typical reaction has 2 nM dynein, 200 nM methylthioguanosine, 1 U ml−1 purine nucleoside phosphorylase, 2 mM 200BDTT, 1 mM 200BATP, 0 or 50 mM 200BKCl and varying concentration of 200Btaxol-stabilized MTs in DLB. Absorbances at 360 nm were measured with 60 s intervals for 30 min, blanked with buffer only solution and calibrated against a Pi absorbance calibration curve. kbasal and kcat were determined by fitting the data to the Michaelis-Menten equation in Origin.
Statistical Analysis
Chi-square test was used to determine the p-values for comparing the backward stepping probability in stepping analysis. Two-sided t-test was used to determine the p-value for the rest of the comparisons. All were calculated in Mathworks MATLAB.
Atomic Model Building
The pre-powerstroke conformation of human dynein-2 in the presence of Mg.ADP.Vi (pdb# 4RH711) was selected for the starting point of the Dyn MD simulations. Mutations in the crystal structure were reversed (R1413K, Q2871R and V3680A) with the mutator plugin in VMD. An additional valine residue at the C-terminus was removed. Missing residues (2584A-2586A, 2827T-2846S, 3596V-3611R, and 3954D-3963S) were constructed using VMD’s Molefacture Plugin and geometrically optimized via MD simulations to fit the missing regions to obtain structurally complete Dyn. Briefly, these residue stretches were modelled as unstructured conformations and flanked with the secondary structures of their neighboring residues from the crystal structure. Each peptide was minimized for 10,000 steps, followed by 1 ns of equilibration simulations in a water box containing 150 mM KCl. After equilibration, 10 ns long targeted MD simulations32 were performed for each peptide to position neighboring residues towards their crystal coordinates. Subsequently, a final set of MD simulations was performed by keeping the alpha carbon atoms of neighboring residues constrained at their crystal coordinates for 10 ns. Among those MD trajectories, conformers that do not show a spatial overlap with the crystal structure were incorporated into the crystal structure. DynRK was constructed upon insertions of V2981P, P2983A, P3108A, and E3110P mutations to the Dyn structure. DynRK+7hep was modeled by extending residues V2964-V2965 on coiled-coil 1 (CC1) and K3122-T3123 on CC2 using the conformation of residues R2916-V2964 on CC1 and T3123-A3171 on CC2.
Molecular Dynamics Simulations
Each dynein structure was solvated in a water box (using TIP3P water model) having a padding of at least 15Å of water in each direction. Systems were ionized to 1 mM MgCl2 and 150 mM KCl. Dyn, DynRK and DynRK+7hep systems were composed of 781,332, 781,319 and 946,159 atoms, respectively. MD simulations were run in NAMD 2.1133 using the CHARMM36 all-atom additive protein force field34 with a time step of 2 fs. For van der Waals interactions, 12 Å cutoff distance was used. The particle-mesh Ewald method was used to calculate long-range electrostatic interactions. The temperature was kept constant at 310 K using a damping coefficient of 1 ps−1 for Langevin dynamics. The pressure was maintained at 1 atm using the Langevin Nosé-Hoover method with an oscillation period of 100 fs and damping time scale of 50 fs. The protein was fixed for 10,000 steps of minimization followed by 2 ns of equilibration. Subsequently, constraints on the protein were released and the system was minimized for an additional 10,000 steps, followed by 6 ns of equilibration. Harmonic potential with a spring constant of 2 kcal mol−1 Å−2 were applied to the backbone atoms during the first 2 ns of equilibration simulations.
All MD simulations were performed in our workstations at Istanbul Technical University (ITU) using NAMD with NVIDIA CUDA acceleration. Three separate simulations were performed for Dyn and DynRK and one simulation was performed for DynRK+7hep. Total simulation time was 1.7 µs. Starting conformations for DynRK_1–3 were constructed based on the final conformations of Dyn1–3 simulations. Similarly, DynRK+7hep was modelled based on the final conformations obtained in Dyn1 simulation. The conformations of Dyn+3hep were estimated by elongating each MD conformation of Dyn with the conformation of residues R2916-V2964 between V2964-V2965 on CC1 and with residues T3123-A3171 between K3122-T3123 on CC2. Dyn-3hep conformations were estimated by shortening R2916-V2964 on CC1 and T3123-A3171 on CC2.
Stalk Angle Calculations
The dynein crystal structure (pdb# 4RH711) and each of the Dyn, DynRK and DynRK+7hep conformations sampled during MD simulations were docked onto tubulin by aligning with the alpha carbon atoms of the MT-MTBD contact residues in the high affinity M. musculus dynein MTBD - tubulin complex (pdb# 3J1T22); corresponding to residues L3300-D3307, A3313-I3325, E3333-R3341 and P3377-A3383 in 3J1T and E2998-S3005, D3011-L3023, W3031-A3039, P3076-A3082 in 4RH7. Principal axes (PA) of MT was obtained via the orient tool in VMD. PA1 (longitudinal axis) corresponds to the longitudinal axis of tubulin. PA2 (radial axis) passes through the center of mass of the Q2982 and Q3098 alpha carbons at the stalk-MTBD intersection of 4RH7 (Extended Data Fig. 3a). PA3 (tangential axis) is perpendicular to PA1 and PA2. The stalk vector (pointing from S3248 alpha carbon to S3100 alpha carbon) was projected on the plane constructed by PA1 and PA2. The angle between the projected vector and PA2 was defined as stalk angle.
LSV Angle Calculations
The post-powerstroke conformation of the linker of Dictyostelium discoideum cytoplasmic dynein (pdb# 3VKG10) was superimposed onto MD conformers by aligning CC2 between the residues V3174-L3214 on both conformations. LSV was defined as the displacement vector between the alpha carbon atoms of the N-terminus residue V1258 of the pre-powerstroke conformer and A1526 of the post-powerstroke conformation. Dynein-tubulin complexes were superimposed onto the MT structure (pdb# 5SYF35) by aligning alpha carbon atoms of the tubulin α−1B chain. PA1 (longitudinal axis) of LSV corresponds to the longitudinal axis of the MT. PA2 (radial axis) is perpendicular to PA1 and passes through the alpha carbon of V1258 of pdb# 4RH7. PA3 (tangential axis) is perpendicular to both PA1 and PA2. LSV was projected onto the plane defined by PA1 and PA3, and the angle that the projected vector makes with PA1 was defined as the LSV angle.
Data Availability
The generated yeast strains and the data that support the findings of this study are available from the corresponding author upon request.
Code Availability
The custom analysis software for 3D tracking on this study is available online at https://github.com/YildizLab/RotationalAnalysisCode.git.
Extended Data
Extended Data Figure 1 ∣. Dynein’s mechanochemical cycle.
a, The AAA+ ring of a dynein monomer lies parallel to the MT and the stalk is tilted towards the plus-end at its base. In the absence of a nucleotide (apo) at AAA1, dynein is tightly bound to MTs and the linker has a straight post-powerstroke conformation, exiting the ring at AAA4. ATP binding to AAA1 (yellow) triggers MT release through a shift in the registry of a coiled-coil stalk and the linker undergoes the priming stroke. At this pre-powerstroke conformation, the linker is bent by a flexible hinge towards the middle of the ring and exits the ring at AAA2. LSV is aligned with the MT long-axis and moves the MTBD towards the minus-end. After ATP hydrolysis, the dynein head re-binds to MT, and releases the inorganic phosphate (Pi). In the ADP bound state, the linker undergoes a force generating powerstroke by moving back to its straight conformation. This pulls the cargo towards the minus end (black arrow). After ADP release, dynein returns back to the apo state for the next cycle.
Extended Data Figure 2 ∣. Engineering the directionality of dynein motility.
Schematic diagram of the helices (CC1 and CC2) at the stalk of yeast cytoplasmic dynein shows the heptad repeat hydrophobic contacts (black lines) in the core of the coiled-coil when dynein is at low MT affinity (β) state. Conserved proline residues at the base of Dyn’s stalk are highlighted with magenta arrows. 3 heptads deleted from the stalk of Dyn−3hep are highlighted with green in Dyn. 3 and 7 heptad repeats inserted to Dyn+3hep, Dyn+7hep and DynRK+7hep are highlighted in red. The inserted sequences were taken from the Drosophila melanogaster cytoplasmic dynein12. Point mutations inserted to DynRK and DynRK+7hep are highlighted in cyan.
Extended Data Figure 3 ∣. Estimated orientation of LSV relative to a MT as a function of stalk length.
a, A tail truncated yeast cytoplasmic dynein monomer (Dyn) was manually docked onto a tubulin dimer (pdb# 3VKG10, 4RH711, 3J6G36 and 5SYF35). LSV was defined as the displacement vector of the N-terminus of the linker from pre- (V1258 of pdb# 4RH7, red bead) to post-powerstroke (A1526 of pdb# 3VKG, green bead) conformation. The stalk axis was defined as the vector that connects S3100 to S3248 (pdb# 4RH7), which lies in the same plane with LSV of Dyn. b, Definition of the principle axes (PAs). Dyn was manually docked onto a MT. The longitudinal axis (PA1) is directed towards the minus end of the MT long axis. The radial axis (PA2) is directed from the MT center of mass towards the pre-powerstroke conformation of the linker (V1258 of pdb# 4RH7, red bead). The tangential axis (PA3) is perpendicular to PA1 and PA2, as shown. c, LSV (black arrow) of Dyn is aligned with the MT axis and parallel to PA1. Expected orientations of Dyn+3hep and Dyn−3hep were modeled by alignment of the coiled coils after insertions and deletions to the stalk. Insertion of 3 heptads to the stalk (Dyn+3hep) is expected to reorient the ring and rotate LSVshort clockwise with respect to MT minus-end. Shortening the stalk by 3 heptads (Dyn−3hep) is expected to rotate LSVshort counterclockwise. d, Velocity analysis of dynein driven beads around MT bridges. All of the beads moved towards the MT minus-end. n = 24, 20, 19 and 22 beads from left to right. Center line and error bars represents the mean and 5-95% confidence intervals. e, The comparison of the average LSV angles from MD simulations (n = 1680 conformations from 3 different simulations) and the average pitch angles from helical rotation of dynein-driven beads (nbeads =24, 20, 19 and nrotations = 99, 59, 72 for Dyn, Dyn+3hep, and Dyn−3hep, respectively) reveals that LSVshort determines the helical directionality of dynein. Error bars represent s.d. In d and e, p-values are calculated from a two-sided t-test.
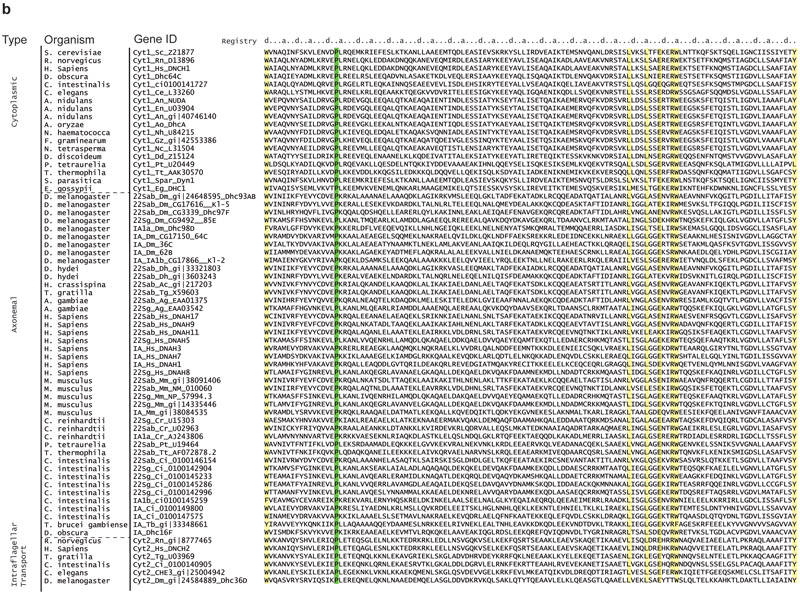
Extended Data Figure 4 ∣. Alignment of the coiled-coil 1 of the stalk region in 67 dynein heavy chains.
The sequences are oriented from N-terminus to C terminus in these alignments. Isoforms of dynein used in the alignment were grouped based on the type and the organism (cytoplasmic (cyt1), axonemal outer arm (22Sab, 22Sg), axonemal inner arm (IA) and intra-flagellar transport (cyt2) dyneins). α and β registry of the stalk coiled coils are shown on top. Stalk length is conserved among dyneins. Fully conserved proline residues at the base of MTBD that cause tilting of the stalk coiled-coils towards the MT plus-end are highlighted in green. Other residues that are conserved over 90% are highlighted in yellow.
Extended Data Figure 5 ∣. Alignment of the coiled-coil 2 of the stalk region in 67 dynein heavy chains.
The sequences are oriented from N-terminus to C terminus in these alignments. Isoforms of dynein used in the alignment were grouped based on the type and the organism (cytoplasmic (cyt1), axonemal outer arm (22Sab, 22Sg), axonemal inner arm (IA) and intra-flagellar transport (cyt2) dyneins). α and β registry of the stalk coiled coils are shown on top. Stalk length is conserved among dyneins. Fully conserved proline residues at the base of MTBD that cause tilting of the stalk coiled-coils towards the MT plus-end are highlighted in green. Other residues that are conserved over 90% are highlighted in yellow.
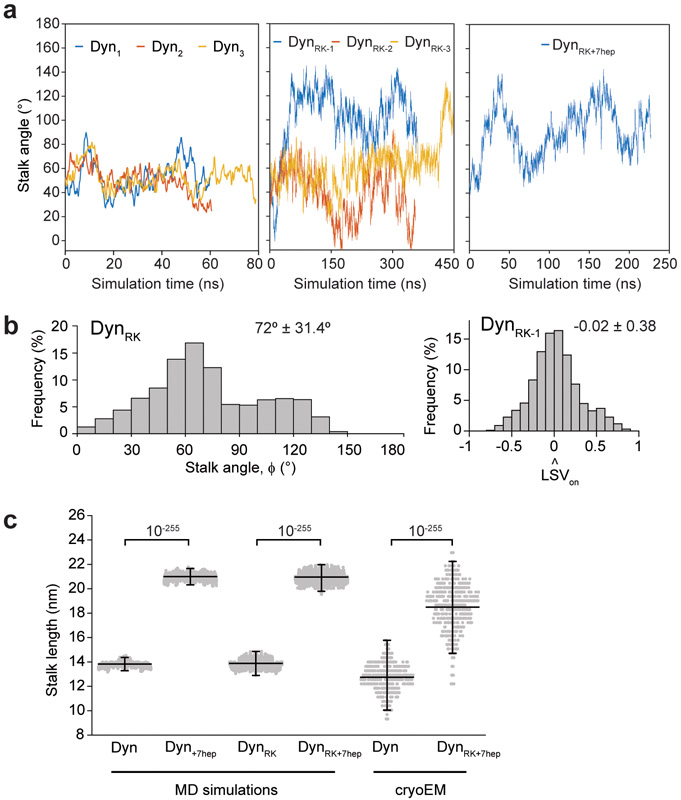
Extended Data Figure 6 ∣. Calculation of stalk and LSV angles by MD simulations.
a, Changes of the stalk angle in three independent MD simulations of Dyn, and DynRK and one simulation of DynRK+7hep. In DynRK-1 and DynRK-3 simulations, the stalk angle sharply increases around 50 ns and 400 ns, respectively and remains pointed towards the minus-end after its reversal. 180° represents tilting of the stalk towards the minus end. b, (Left) Stalk angle distribution for the DynRK simulations. 180° represents tilting of the stalk towards the MT minus end. (Right) The length of the LSV unit vector projected onto the MT long axis after the reversal of the stalk in DynRK-1. −1 corresponds to LSV pointed towards the minus-end. c, Stalk length distributions from MD simulations and cryo-EM experiments (mean ± s.d., n = 2400, 2400, 7263, 7263, 392, 421 conformations from left to right). Center line and error bars represents the mean and 5-95% confidence intervals. p-values are calculated from a two-sided t-test.
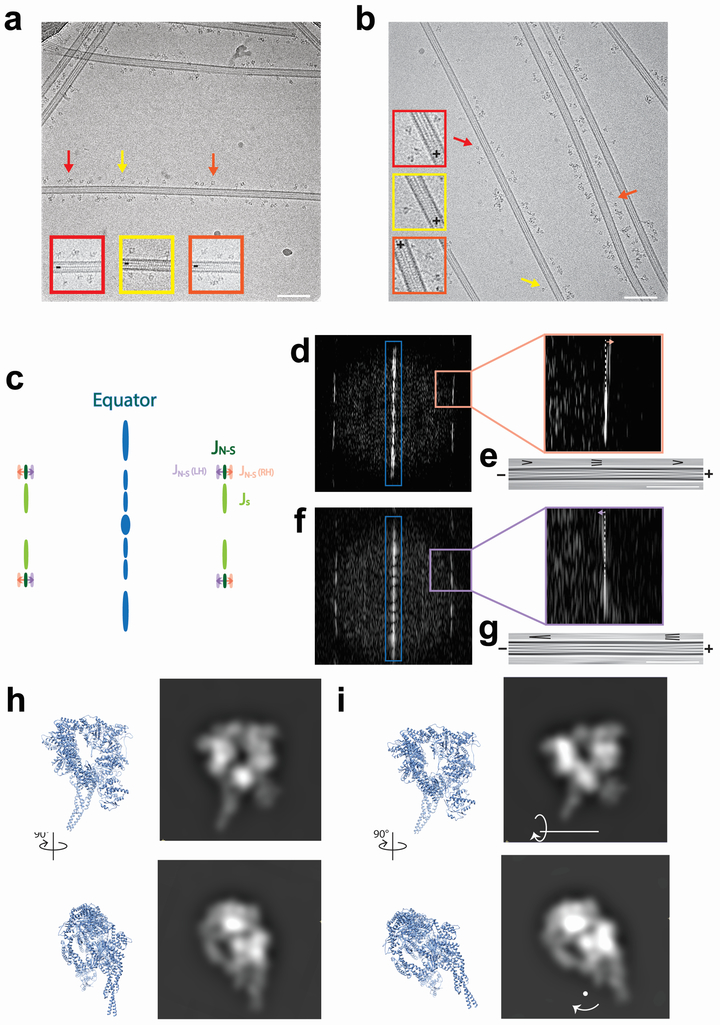
Extended Data Figure 7 ∣. CryoEM image analysis of dynein monomers on MTs.
a, A representative cryoelectron micrograph of Dyn monomers bound to MTs with single monomers indicated with arrows and enlarged inset (Scale bar = 100 nm). n = 98 micrographs from 1 grid for Dyn, and 235 micrographs from 2 grids for DynRK+7hep. b, A representative cryoelectron micrograph of DynRK+7hep monomers bound to MTs with single monomers indicated with arrows and enlarged inset (Scale bar = 100 nm). c, A simplified depiction of the power spectrum of a MT as a method to determine MT polarity. MTs with different numbers of protofilaments have different degrees of protofilament skew around the long-axis. This causes differences in the Moiré patterns produced in cryoEM images. These visual changes result in changes to the position of certain reflections in the MT power spectrum. As a result, right- and left-handed helix architectures can be differentiated by the relative positions of the JS (light green) and JN-S (dark green) reflections. For right-handed helices, the JN-S (RH, pink) reflection is further from the equator (blue) than the JS reflection, whereas for left-handed helices the JN-S (LH, purple) reflection is closer to the equator than the JS reflection. When the MT is Fourier-filtered to only include information from the equator (blue), a characteristic arrowhead pattern is formed from the Moiré patterns. For right-handed helix architectures, this points towards the plus-end, and for left-handed helix architectures this points towards the minus-end. d, An example power spectrum of an MT determined to be a right handed-helix. Enlargement on the right shows that the JS reflection is closer to the equator than the JN-S reflection. e, A Fourier-filtered image produced from the equatorial reflections from the power spectrum in d (blue box). For right-handed helix architectures, the arrowheads point towards the plus end (Scale bar = 100 nm). f, An example power spectrum of an MT determined to be a left handed-helix. Enlargement on the right shows that the JS reflection is further from the equator than the JN-S reflection. g, A Fourier-filtered image produced from the equatorial reflections from the power spectrum in f (blue box). For left-handed helix architectures, the arrowheads point towards the minus end (Scale bar = 100 nm). h, Orthogonal views of an atomic model of a dynein motor in an arrangement corresponding to the “wild-type view”, and synthetic projections produced from them. In this arrangement, the motor appears as an even ring. i, As in h, but with the model tilted 30° around the indicated axis. In this arrangement, the projection creates a crescent shape similar to that seen in the DynRK+7hep class (Figure 2e), albeit with the ring and stalk unflipped, suggesting that the ring of DynRK+7hep is slightly tilted in relation to the MT.
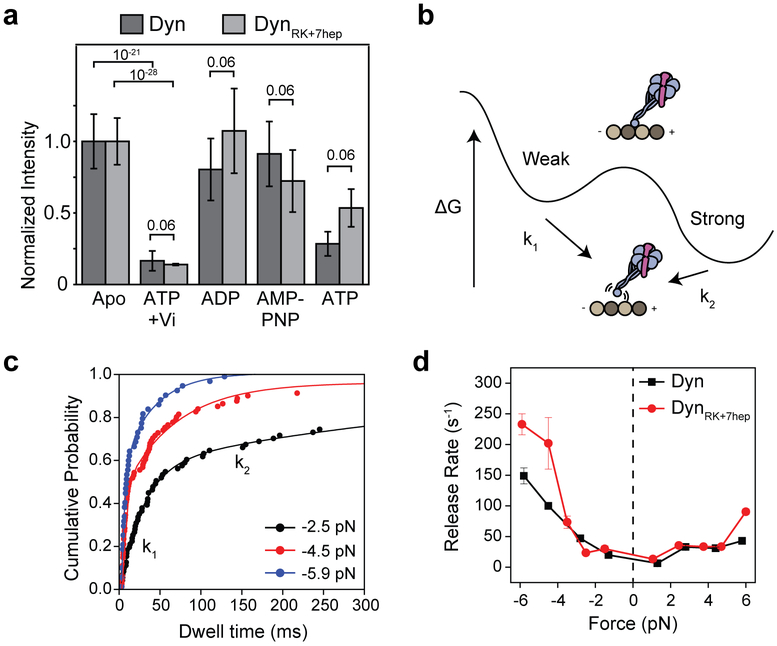
Extended Data Figure 8 ∣. Nucleotide and force-induced release of Dyn and DynRK+7hep monomers from MTs.
a, The normalized intensity of 100 nM GFP-tagged Dyn and DynRK+7hep monomers on sea urchin axonemes under given nucleotide conditions. Similar to Dyn, DynRK+7hep released from MTs in the ADP-Pi state, mimicked by ATP and vanadate (Vi, n = 40 axonemes from three independent measurements, mean ± s.d.). p-values are calculated from a two-sided t-test. b, A model of the dynein-MT interaction shows two distinct binding modes in the apo state, with k1 and k2 representing force-induced release rates from the weak and strong states, respectively. The slow rate (k2) represents strong binding of the motor to its tubulin binding site, whereas the fast rate (k1) represents transient or nonspecific interactions of the motor with the MT. c, Cumulative probability distributions (solid circles) of the MT-bound time of Dyn monomers at given force ranges. The release rates (k1 and k2) were calculated by a two-exponential-decay fit (solid curves). d, Calculated k1 values from the exponential fit (±95% confidence intervals) to the DynRK+7hep dwell time has similar force-dependence to Dyn. Each bin contains 120 dwells from two independent measurements.
Extended Data Figure 9 ∣. DynRK+7hep monomers exhibit robust plus-end directionality in MT gliding and bead motility assays.
a, (Top) The schematic represents the MT gliding assay with monomeric dynein. (Bottom) Images from time-lapse recordings show gliding of polarity marked MTs by Dyn and DynRK+7hep monomers. While Dyn glides MTs with their plus-end in the lead, DynRK+7hep glides MTs towards the opposite direction. n = 3 biological replicates. b, MT gliding velocity and directionality of Dyn and DynRK+7hep in the presence and absence of 100 mM KCl. Negative velocities correspond to minus-end directionality. n = 45, 47, 27 and 70 from left to right from two independent measurements. c, The schematic of the bead motility assay with monomeric dynein (not to scale). N-terminal GFP-tagged monomers are attached to 860-nm diameter GFP-antibody coated beads from their tail. d, Velocities of the beads driven by Dyn and DynRK+7hep monomers. n = 29 and 24 from left to right from three independent experiments. In b and d, the center line and edges represent mean and 5%-95%, respectively. p-values are calculated from a two-sided t-test.
Extended Data Table 1 ∣. Engineering and testing of dynein mutants.
a, MT stimulated ATPase activity and velocity analysis of Dyn and DynRK+7hep under different salt conditions. An increase in salt concentration reduces the MT affinity (KM-MT) of Dyn and DynRK+7hep, but it does not alter their directionality. KM-MT of Dyn without added salt is similar to that of DynRK+7hep under 50 mM KAc (Two-sided t-test, p = 0.055). ATPase data was collected from three independent experiments (mean ± s.d.). n = 67, 55, 52, 58 from left to right. b, The list of yeast strains used in this study. These strains were produced by homologous recombination using the template strain (MATa his3-11,5 ura3-1 leu2-3, 112 ade2-1 trp-1 pep4::HIS3 prb1Δ) expressing the tail-truncated yeast cytoplasmic dynein (331Dyn1) under the galactose promoter (pGal) or full-length dynein (471DYN1) under the native promoter. A ZZ-Tev tag was inserted at the N-termini of these constructs for affinity purification. The DHA tag was used to label the motor with fluorescent dyes functionalized with alkyl chloride (F: Figure, EDF: Extended Data Figure, EDT: Extended Data Table).
| a | ||||
|---|---|---|---|---|
| Dyn - 0 mM KAc | Dyn - 50 mM KAc | DynRK+7hep-50 mM KAC | DynRK+7hep-150 mM KAC | |
| kcat (s−1 per head) | 7.3 ± 0.1 | 7.9 ± 0.1 | 6.8 ± 0.2 | 8.5 ± 0.2 |
| kbasai(s−1 per head) | 1.1 ± 0.1 | 2.4 ± 0.1 | 4.6 ± 0.6 | 6.6 ± 0.3 |
| KM (nM) | 19 ± 3.4 | 630 ± 65 | 19 ± 5.1 | 75 ± 4.3 |
| + Runs (nm s−1) | N.A. | N.A. | 18.2 ± 10.9 | 23.9 ± 13.8 |
| − Runs (nm s−1) | 88.2 ± 30.2 | 95.5 ± 51.5 | 10.6 ± 3.6 | 33.3 ± 11.1 |
| + Runs (%) | 0 | 0 | 81 | 83 |
| − Runs (%) | 100 | 100 | 8 | 6 |
| Diffusive (%) | 0 | 0 | 10 | 11 |
| b | ||||
| Strain ID | Construct Name | Description | Source | Dataset |
| VY208 | GFP-GST-Dyn-DHA | GFP-3xHA-GST-331DYN1-gs-DHA | ref. 4 | F1c,d, F4c,d, EDF3d |
| VY268 | DHA-GST-Dyn | DHA-GST-331DYN1 | ref. 4 | F3c F4c,e, EDT1a |
| VY209 | FRB-Dyn-DHA | 3xHA-FRB-331DYN1-gs-DHA | ref. 4 | F2e,f, EDF6c, EDF7 |
| Y144 | GFP-Dyn-FKBP-DHA | GFP-3xHA-331DYN1-gsgsgsgs-FKBP12 URA3 | ref. 16 | F3a,b,e, EDF9 |
| Y124 | GFP-Dyn−3hep-DHA | GFP-3xHA-331DYN1-(−3hep3036/3292)-331DYN1-gs-DHA | This study | F1c,d, EDF3d |
| Y200 | GFP-GST-Dyn+3hep-DHA | GFP-3xHA-GST-331DYN1-(+3hep3085/3159)-331DYN1-gs-DHA | This study | F1c,d, EDF3d |
| Y123 | GFP-Dyn+7hep-DHA | GFP-3xHA-331DYN1-(+7hep3085/3159)-331DYN1-gs-DHA | ref. 12 | F4b, EDF3d |
| Y197 | GFP-GST-DynRK-DHA | GFP-3XHA-GST-331DYN1I3101P/P3103A.P3229A/R3231P | This study | F4b |
| Y187 | GFP-GST-DynRK+7+hep-DHA | GFP-3xHA-GST-331DYN1I3101P/P3103A-(+7hep3085/3159)-331DYN1P3229A/R3231P-gs-DHA | This study | F3c, F4a,b,c,e |
| Y198 | GFP-DynRK+7hep-DHA | GFP-HA-331DYN1I3101P/P3103A-(+7hep3085/3159)-331DYN1P3229A/R3231P-gs-DHA | This study | F3a,b,e, EDF8, EDF9 |
| Y201 | FRB-DynRK+7hep-DHA | 3xHA-FRB-331DYN1I3101P/P3103A-(+7hep3085/3159)-331DYN1P3229A/R3231P-gs-DHA | This study | F2e,f, EDF6c, EDF7 |
| Y202 | GFP-471DynRK+7hep-DHA | GFP-3xHA-471DYN1I3101P/P3103A-(+7hep3085/3159)-331DYN1P3229A/R3231P-gs-DHA | This study | F4d, EDT1a |
Supplementary Material
Acknowledgements
We thank F.B. Cleary, H. Schmidt, C. Cypranowska, V. Belyy and L. Ferro for initiation of this project, and S. Chen, C. Savva, G. Cannone, J. Grimmett, T. Darling and L. Kellogg for technical assistance in cryoEM, M. Mofrad and M. Mehrbod for coarse-grained simulations, and the Savio Cluster for MD simulations. This work was funded by grants from the NIH (GM094522), and NSF (MCB-1055017, MCB-1617028) to A.Y., the Wellcome Trust (WT100387) and the Medical Research Council, UK (MC_UP_A025_1011) to A.P.C., and TUBITAK (215Z398) and ITU BAP (38777) to M.G.
References
- 1.Bryant Z, Altman D & Spudich JA The power stroke of myosin VI and the basis of reverse directionality. Proceedings of the National Academy of Sciences of the United States of America 104, 772–777 (2007). [DOI] [PMC free article] [PubMed] [Google Scholar]
- 2.Sablin EP et al. Direction determination in the minus-end-directed kinesin motor ncd. Nature 395, 813–816 (1998). [DOI] [PubMed] [Google Scholar]
- 3.Roberts AJ, Kon T, Knight PJ, Sutoh K & Burgess SA Functions and mechanics of dynein motor proteins. Nature reviews. Molecular cell biology 14, 713–726 (2013). [DOI] [PMC free article] [PubMed] [Google Scholar]
- 4.Reck-Peterson SL et al. Single-molecule analysis of dynein processivity and stepping behavior. Cell 126, 335–348 (2006). [DOI] [PMC free article] [PubMed] [Google Scholar]
- 5.Gennerich A, Carter AP, Reck-Peterson SL & Vale RD Force-induced bidirectional stepping of cytoplasmic dynein. Cell 131, 952–965 (2007). [DOI] [PMC free article] [PubMed] [Google Scholar]
- 6.Dyneins, Dynein Mechanics, Dysfunction, and Disease, Vol. 2, Edn. 2 (ed. King SM) 215–474 (Academic Press, 2017). [Google Scholar]
- 7.Gee MA, Heuser JE & Vallee RB An extended microtubule-binding structure within the dynein motor domain. Nature 390, 636–639 (1997). [DOI] [PubMed] [Google Scholar]
- 8.Roberts AJ et al. AAA+ Ring and linker swing mechanism in the dynein motor. Cell 136, 485–495 (2009). [DOI] [PMC free article] [PubMed] [Google Scholar]
- 9.Schmidt H, Gleave ES & Carter AP Insights into dynein motor domain function from a 3.3-A crystal structure. Nature structural & molecular biology 19, 492–497, S491 (2012). [DOI] [PMC free article] [PubMed] [Google Scholar]
- 10.Kon T et al. The 2.8 A crystal structure of the dynein motor domain. Nature 484, 345–350 (2012). [DOI] [PubMed] [Google Scholar]
- 11.Schmidt H, Zalyte R, Urnavicius L & Carter AP Structure of human cytoplasmic dynein-2 primed for its power stroke. Nature 518, 435–438 (2015). [DOI] [PMC free article] [PubMed] [Google Scholar]
- 12.Carter AP et al. Structure and functional role of dynein’s microtubule-binding domain. Science 322, 1691–1695 (2008). [DOI] [PMC free article] [PubMed] [Google Scholar]
- 13.Lin J, Okada K, Raytchev M, Smith MC & Nicastro D Structural mechanism of the dynein power stroke. Nature cell biology 16, 479–485 (2014). [DOI] [PMC free article] [PubMed] [Google Scholar]
- 14.Imai H et al. Direct observation shows superposition and large scale flexibility within cytoplasmic dynein motors moving along microtubules. Nature communications 6, 8179 (2015). [DOI] [PMC free article] [PubMed] [Google Scholar]
- 15.Lippert LG et al. Angular measurements of the dynein ring reveal a stepping mechanism dependent on a flexible stalk. Proc Natl Acad Sci U S A 114, E4564–E4573 (2017). [DOI] [PMC free article] [PubMed] [Google Scholar]
- 16.Cleary FB et al. Tension on the linker gates the ATP-dependent release of dynein from microtubules. Nature communications 5, 4587 (2014). [DOI] [PMC free article] [PubMed] [Google Scholar]
- 17.Nicholas MP et al. Cytoplasmic dynein regulates its attachment to microtubules via nucleotide state-switched mechanosensing at multiple AAA domains. Proceedings of the National Academy of Sciences of the United States of America 112, 6371–6376 (2015). [DOI] [PMC free article] [PubMed] [Google Scholar]
- 18.Furuta A et al. Creating biomolecular motors based on dynein and actin-binding proteins. Nat Nanotechnol 12, 233–237 (2017). [DOI] [PubMed] [Google Scholar]
- 19.Can S, Dewitt MA & Yildiz A Bidirectional helical motility of cytoplasmic dynein around microtubules. eLife 3, e03205 (2014). [DOI] [PMC free article] [PubMed] [Google Scholar]
- 20.DeWitt MA, Chang AY, Combs PA & Yildiz A Cytoplasmic dynein moves through uncoordinated stepping of the AAA+ ring domains. Science 335, 221–225 (2012). [DOI] [PMC free article] [PubMed] [Google Scholar]
- 21.Qiu W et al. Dynein achieves processive motion using both stochastic and coordinated stepping. Nature structural & molecular biology 19, 193–200 (2012). [DOI] [PMC free article] [PubMed] [Google Scholar]
- 22.Redwine WB et al. Structural basis for microtubule binding and release by dynein. Science 337, 1532–1536 (2012). [DOI] [PMC free article] [PubMed] [Google Scholar]
- 23.Gibbons IR et al. The affinity of the dynein microtubule-binding domain is modulated by the conformation of its coiled-coil stalk. The Journal of biological chemistry 280, 23960–23965 (2005). [DOI] [PMC free article] [PubMed] [Google Scholar]
- 24.Kon T et al. Helix sliding in the stalk coiled coil of dynein couples ATPase and microtubule binding. Nature structural & molecular biology 16, 325–333 (2009). [DOI] [PMC free article] [PubMed] [Google Scholar]
- 25.Belyy V, Hendel NL, Chien A & Yildiz A Cytoplasmic dynein transports cargos via load-sharing between the heads. Nature communications 5, 5544 (2014). [DOI] [PMC free article] [PubMed] [Google Scholar]
- 26.Niekamp S, Coudray N, Zhang N, Vale RD & Bhabha G Stalk-mediated communication in the dynein motor domain. bioRxiv (2018). [Google Scholar]
- 27.Chretien D, Kenney JM, Fuller SD & Wade RH Determination of microtubule polarity by cryo-electron microscopy. Structure 4, 1031–1040 (1996). [DOI] [PubMed] [Google Scholar]
- 28.Gell C et al. Purification of tubulin from porcine brain. Methods Mol Biol 777, 15–28 (2011). [DOI] [PubMed] [Google Scholar]
- 29.Yildiz A et al. Myosin V walks hand-over-hand: single fluorophore imaging with 1.5-nm localization. Science 300, 2061–2065 (2003). [DOI] [PubMed] [Google Scholar]
- 30.Neuman KC & Block SM Optical trapping. Rev Sci Instrum 75, 2787–2809 (2004). [DOI] [PMC free article] [PubMed] [Google Scholar]
- 31.Dogan MY, Can S, Cleary FB, Purde V & Yildiz A Kinesin’s front head is gated by the backward orientation of its neck linker. Cell reports 10, 1967–1973 (2015). [DOI] [PMC free article] [PubMed] [Google Scholar]
- 32.Schlitter J, Engels M & Kruger P Targeted molecular dynamics: a new approach for searching pathways of conformational transitions. J Mol Graph 12, 84–89 (1994). [DOI] [PubMed] [Google Scholar]
- 33.Phillips JC et al. Scalable molecular dynamics with NAMD. Journal of computational chemistry 26, 1781–1802 (2005). [DOI] [PMC free article] [PubMed] [Google Scholar]
- 34.Best RB et al. Optimization of the additive CHARMM all-atom protein force field targeting improved sampling of the backbone ϕ, ψ and side-chain χ1 and χ2 dihedral angles. Journal of chemical theory and computation 8, 3257–3273 (2012). [DOI] [PMC free article] [PubMed] [Google Scholar]
- 35.Kellogg EH et al. Insights into the Distinct Mechanisms of Action of Taxane and Non-Taxane Microtubule Stabilizers from Cryo-EM Structures. J Mol Biol 429, 633–646 (2017). [DOI] [PMC free article] [PubMed] [Google Scholar]
- 36.Alushin GM et al. High-resolution microtubule structures reveal the structural transitions in alphabeta-tubulin upon GTP hydrolysis. Cell 157, 1117–1129 (2014). [DOI] [PMC free article] [PubMed] [Google Scholar]
Associated Data
This section collects any data citations, data availability statements, or supplementary materials included in this article.
Supplementary Materials
Data Availability Statement
The generated yeast strains and the data that support the findings of this study are available from the corresponding author upon request.


