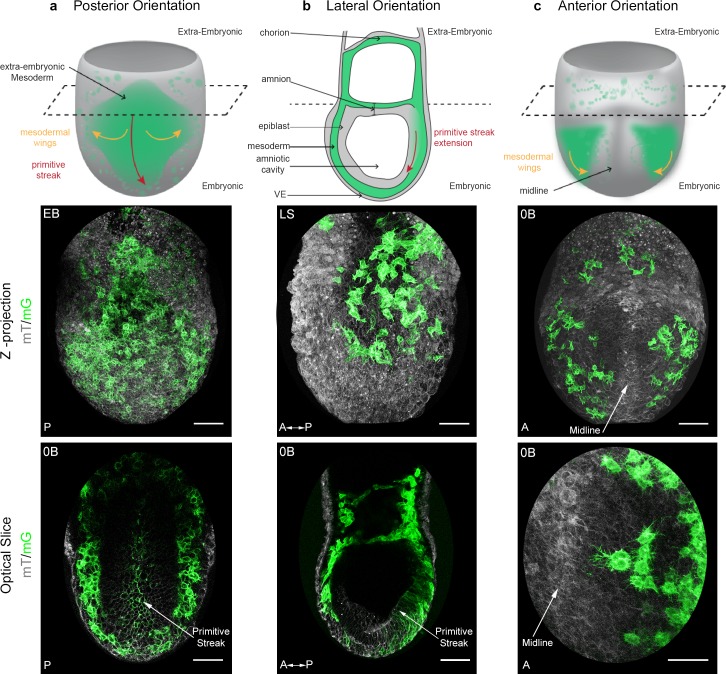
Figure 1. Mosaic membrane GFP labeling of nascent mesoderm allows following individual cell migration through embryo live imaging.
(a) Posterior view. Top: 3D scheme with mesoderm layer in green and the rest of the embryo in grey. The dashed line separates embryonic and extra-embryonic regions. Middle: Z-projection of two-photon stack. Bottom: optical slice highlighting the primitive streak. (b) Lateral view, anterior to the left. Top: 2D scheme. Middle: Z-projection of two-photon stack showing cells progression from posterior to anterior. Bottom: sagittal optical slice. (c) Anterior view. Top: 3D scheme. Middle: Z-projection of two-photon stack with most anterior cells reaching the midline. Bottom: optical slice zoomed on filopodia extending towards the midline. All embryos were dissected at E7.25 and are at Late Streak/Early Bud stage. VE: Visceral Endoderm; mG: membrane GFP, in green; mT: membrane dtTomato, in grey; EB: Early Bud; LS: Late Streak; 0B: Zero Bud. (Scale bars: 50 μm).


