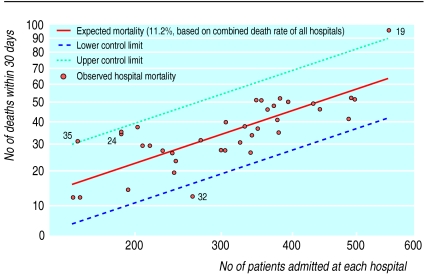
Figure 3.
Control chart for number of deaths in hospital within 30 days of admission for patients admitted with myocardial infarction (patients aged 35-74 years admitted to the 37 very large acute hospitals in England during 1998-9). (Both axes show square root of values, according to method by Tukey21)

