

Summary
Cells require a constant supply of fatty acids to survive and proliferate. Fatty acids incorporate into membrane and storage glycerolipids through a series of endoplasmic reticulum (ER) enzymes, but how these enzymes are regulated is not well understood. Here, using a combination of CRISPR-based genetic screens and unbiased lipidomics, we identified calcineurin B homologous protein 1 (CHP1) as a major regulator of ER glycerolipid synthesis. Loss of CHP1 severely reduces fatty acid incorporation and storage in mammalian cells and invertebrates. Mechanistically, CHP1 binds and activates GPAT4, which catalyzes the initial rate-limiting step in glycerolipid synthesis. GPAT4 activity requires CHP1 to be N-myristoylated, forming a key molecular interface between the two proteins. Interestingly, upon CHP1 loss, the peroxisomal enzyme, GNPAT, partially compensates for the loss of ER lipid synthesis, enabling cell proliferation. Thus, our work identified a conserved regulator of glycerolipid metabolism and revealed plasticity in lipid synthesis of proliferating cells.
eTOC Blurb
Cells require glycerolipid synthesis to generate membranes and store energy. Zhu et al. identified CHP1 as an essential protein for ER glycerolipid synthesis and storage in mammals and invertebrates. CHP1 activates the rate-limiting enzyme of lipid synthesis, GPAT4. Targeting CHP1-GPAT4 association may be a therapeutic target for metabolic disorders with dysfunctional lipid accumulation.
Graphical Abstract
Introduction
Cells require a constant supply of fatty acids to support membrane synthesis, energy production and cellular signaling (Henne et al., 2018). Fatty acids are taken up from the extracellular environment or synthesized de novo from other nutrients and incorporated into glycerolipids as major constituents of membrane phospholipids and triacylglycerols (Bell and Coleman, 1980). Consistent with their essential role, decreases in fatty acid levels impair cell proliferation and survival (Alwarawrah et al., 2016; Hardwicke et al., 2014). Similarly, excess fatty acids are toxic to most cell types, in particular those that are not dedicated to store lipids (Kusminski et al., 2009). This suggests that cellular fatty acid availability and glycerolipid synthesis must be tightly controlled by regulatory mechanisms. Indeed, diseases associated with dysfunctional lipid accumulation include diverse pathologies such as insulin resistance (Samuel et al., 2010), heart failure (Goldberg et al., 2012) and hepatic steatosis (Liu et al., 2010).
Glycerolipid synthesis from fatty acids occurs largely in the endoplasmic reticulum (ER) and starts with the activities of ER acyltransferases (GPATs and AGPATs). The resulting intermediates (e.g. phosphatidic acid) then become common substrates for membrane and triacylglycerol synthesis (Coleman and Lee, 2004). These lipids are particularly important in proliferating cells, as there is a constant need to generate new cellular membranes. However, apart from a few transcriptional and posttranscriptional mechanisms (Ericsson et al., 1997; Haas et al., 2012; Peterson et al., 2011; Shan et al., 2010), regulators of glycerolipid synthesis from fatty acids have not been thoroughly defined.
Here, we devised a CRISPR-based genetic screening strategy utilizing a toxic saturated fatty acid, palmitate, which impairs cellular viability at high doses through incorporation into ER membrane glycerolipids. Using this approach, we systematically defined key metabolic enzymes and regulators of the glycerolipid synthesis pathway. Of particular interest, we discovered calcineurin B homologous protein 1 (CHP1) as an essential regulatory protein of glycerolipid synthesis and storage. CHP1 binds to and, through a myristoyl modification, activates an ER GPAT (GPAT4), the first committed enzyme for the de novo synthesis of triacylglycerols and membrane lipids. Interestingly, upon CHP1 loss, cells compensate for the loss of ER glycerolipid synthesis through a peroxisomal acyltransferase. Thus, we identified a key regulatory protein of ER glycerolipid synthesis and discovered an unappreciated plasticity of the initial steps of lipid synthesis in proliferating cells.
Results
A CRISPR-based genetic screen identifies metabolic genes involved in the utilization of fatty acids
Human cells in culture arrest and die when treated with high levels of palmitate (Listenberger et al., 2003). This toxicity arises from an impairment of ER membrane fluidity as palmitate incorporates into ER glycerolipids and disrupts the membrane saturation balance (Shen et al., 2017), ultimately leading to cell death (Figure 1A). Indeed, excess palmitate accumulates within sheet-like structures, representing solid phase membranes of the ER (Figure S1A). Building upon this observation, we reasoned that perturbing genes involved in the synthesis of ER glycerolipids should alter the cellular sensitivity to palmitate toxicity and that a genetic screening strategy may identify potential regulators of this pathway.
Figure 1: A CRISPR genetic screen identifies metabolic regulators of glycerolipid synthesis.

(A) Approach to identify regulators of glycerolipid metabolism. Saturated fatty acids incorporate into ER phospholipids through glycerolipid synthesis pathway and ultimately result in cell death due to ER membrane solidification.
(B) Dose-dependent effects of palmitate on Jurkat cell proliferation (mean ± SD, n=3). ***p < 0.001 versus BSA control (top). Representative bright-field micrographs of Jurkat cells after a 6-day treatment with the indicated palmitate concentrations. Scale bar, 100 μm (bottom).
(C) Schematic depicting the negative and positive CRISPR based screens with palmitate.
(D) Gene scores in untreated versus palmitate-treated (50 uM) Jurkat cells (left). Top 10 genes scoring as differentially required upon palmitate treatment. Genes linked to lipid metabolism are indicated in red, heme synthesis and desaturation in green, and ROS stress in yellow (right).
(E) Gene scores in untreated versus palmitate-treated (200 uM) Jurkat cells. Top 5 genes scoring as differentially required upon palmitate treatment. Genes linked to lipid metabolism are indicated in red. The second gene in the list, CHP1 (blue), does not have metabolism related annotations (right).
(F) Immunoblot analysis of wild type, ACSL4_KO, and rescued KO cells. β-actin was used as a loading control (left). Fold change in cell number (log2) of wild type (black), ACSL4_KO (blue), and rescued ACSL4_KO (gray) cells after a 4-day treatment with the indicated palmitate concentrations (mean ± SD, n=3). ***p < 0.001 versus wild type (right).
(G) Immunoblot analysis of wild type, ACSL3_KO, and rescued KO cells. β-actin was used as a loading control (left). Fold change in cell number (log2) of wild type (black), ACSL3_KO (blue), and rescued ACSL3_KO (gray) cells after a 4-day treatment with the indicated palmitate concentrations (mean ± SD, n=3). ***p < 0.001 versus wild type (right).
(H) Immunoblot analysis of wild type, CHP1_KO, and rescued KO cells. β-actin was used as a loading control (left). Fold change in cell number (log2) of wild type (black), CHP1_KO (blue), and rescued CHP1_KO (gray) cells after a 4-day treatment with the indicated palmitate concentrations (mean ± SD, n=3). ***p < 0.001 versus wild type (right).
(I) Palmitate sensitivity of HeLa cells upon loss of indicated genes. Immunoblot analysis of wild type, ACSL4_KO, ACSL3_KO and CHP1_KO HeLa cells. β-actin was used as a loading control (left). Fold change in cell number (log2) of wild type (black), ACSL4_KO (blue), ACSL3_KO and CHP1_KO (gray) cells after a 4-day treatment with the indicated palmitate concentrations (mean ± SD, n=3). ***p < 0.001 versus wild type (right).
See also Figure S1.
To begin to understand how cellular metabolism responds to different levels of palmitate, we first examined its effects on the metabolism of the human Jurkat leukemia cell line. Culturing these cells in the presence of high concentrations of palmitate caused cell death (Figures 1B & S1B) and profound metabolic changes: acylcarnitines, which are intermediates of beta oxidation, and triacylgycerols increased, as did levels of intermediates of lipid synthesis pathway such as ceramides, suggesting the utilization of exogenous fatty acids for beta oxidation and glycerolipid synthesis, respectively (Figure S1C). We next performed a set of CRISPR-based negative and positive selection screens for genes whose loss potentiates or protects against the toxicity of palmitate. These genes would be expected to be involved in processes that regulate the utilization of fatty acids and thus their identification will pinpoint key metabolic regulators of glycerolipid metabolism in proliferating cells. For negative and positive selection screens, we used a metabolism focused (Birsoy et al., 2015) and genome-wide CRISPR library (Wang et al., 2017), respectively (Figure 1C). We transduced Jurkat cells with these sgRNA libraries, and passaged the pool of knockout cells for 14 population doublings in the presence or absence of 50–200 μM palmitate (Figure 1C). At the end of the screens, for each gene, we calculated its score as the median log2 fold change in the abundance of all sgRNAs targeting the gene. Validating the robustness of the screens, most genes, as well as the control sgRNAs, scored similarly in the presence or absence of palmitate (Figures 1D).
Among the genes selectively essential in the presence of palmitate (Figure 1D), many encode lipid metabolism enzymes involved in the incorporation of unsaturated lipids which maintain the balance of cellular lipid saturation. These genes include the major acyl-CoA synthetase for polyunsaturated fatty acids, ACSL4 (Klett et al., 2017) (Figure S1D), as well as SCAP, HSD17B12, AGPAT1 and CEPT1, genes known to contribute to unsaturated lipid synthesis (Agarwal et al., 2011; Henneberry and McMaster, 1999; Kemiläinen et al., 2016; Williams et al., 2013). Additionally, mammalian cells use fatty acid desaturases, which require the transfer of electrons via the heme-containing cytochrome b5 to introduce double bonds into acyl chains (Mitchell and Martin, 1995). Interestingly, both cytochrome b5 (CYB5B) and members of the heme synthesis pathway such as HMBS, UROD and ALAS1, scored as essential under palmitate treatment. These results are consistent with previous findings that a balance between saturated and unsaturated membrane lipids are essential for cell viability (Listenberger et al., 2003). Similarly, the top scoring gene in the positive selection screen was ACSL3 (Figures 1E & S1E), a member of the acyl-CoA synthetase family that preferentially uses saturated fatty acids as major substrates (Van Horn et al., 2005). Other scoring genes include CHP1 (Figure S1E), a poorly characterized gene with no known metabolic function, as well as GPAT4 and ACACA, enzymes of the glycerolipid synthesis pathway (Wendel et al., 2009).
To confirm our screening results, we used the CRISPR-Cas9 system and, for each top scoring gene, generated two clonal Jurkat cell lines, in which ACSL4 (Figure S1F), ACSL3 (Figure S1G) and CHP1 (Figure S1H) proteins were undetectable. All knockout cell lines were viable and proliferated at similar rates to wild type cells (Figures S1F-S1H). Consistent with the screening results, ACSL4 knockout cells arrested and died at low doses of palmitate, while the wild type counterparts did not (Figure 1F). In contrast, ACSL3 (Figure 1G) and CHP1 (Figure 1H) knockout cells were almost completely resistant to doses of palmitate that induced cell death in wild type cells. Notably, re-expression of sgRNA resistant cDNAs in the corresponding cell lines largely restored the wild type response to palmitate toxicity (Figures 1F–1H). To address whether loss of these genes confers a similar response to palmitate in other cell types, we knocked out ACSL4, ACSL3 and CHP1 in human HeLa (Figure 1I) and HepG2 cells (Figure S1I) and observed similar responses to palmitate treatment, indicating a generalizable role for these genes in cellular fatty acid utilization. Overall our findings suggest that ACSL3, ACSL4 and CHP1 are major regulators of glycerolipid metabolism. Given its uncharacterized role in lipid metabolism, we next focused our attention on CHP1.
CHP1 is essential for glycerolipid synthesis and lipid storage in metazoa
CHP1 belongs to the Ca+2-binding protein subfamily and has previously been implicated in the regulation of the plasma membrane Na+/H+ exchanger protein SLC9A1 function (Lin and Barber, 1996), but neither SLC9A1 nor other CHP family members scored in our genetic screens. We therefore sought to determine a direct role for CHP1 in lipid metabolism by performing lipidomic analysis. As the cellular imbalance of lipid saturation may impair cell proliferation, we first reasoned that CHP1 might influence cellular lipid saturation. Indeed, the two top scoring genes in our screens, ACSL3 and ACSL4, are members of the acyl-CoA synthetase family with preferences for saturated (e.g. palmitate) and polyunsaturated (e.g. arachidonate) fatty acids respectively (Klett et al., 2017; Van Horn et al., 2005). Consistent with their substrate choice, loss of ACSL3 or ACSL4 had opposing effects on cellular lipid saturation of triacylglycerols, the major storage glycerolipid species in mammalian cells. While ACSL3 loss decreased incorporation of saturated fatty acids into triacylglycerols, ACSL4 loss reduced mostly polyunsaturated fatty acids. However, loss of CHP1 decreased incorporation of both saturated and unsaturated fatty acids into triacylglycerols (Figure S2A).
Similar to palmitate, excess polyunsaturated fatty acids, such as arachidonate, are also toxic to mammalian cells (Pompeia et al., 2002), a phenotype rescued by supplementation of palmitate (Figure S2B). To test whether CHP1 is also involved in protecting against the toxicity of unsaturated fatty acid species in an unbiased way, we repeated our genetic screen with arachidonate (Figure 2A). ACSL3 and ACSL4 scored in an opposite fashion to their scores in the genetic screens using palmitate (Figures 2B & S2C). While loss of ACSL3 sensitized cells to arachidonate, ACSL4 and CHP1 loss protected them against its toxicity (Figures 2C & S2C). This raises the possibility that, unlike ACSL3 and ACSL4, CHP1 may be involved in the utilization of both saturated and unsaturated fatty acids. To further test this possibility, we visualized the incorporation of palmitate and arachidonate in wild type and CHP1 knockout cells using stimulated Raman scattering microscopy (Shen et al., 2014) with deuterium labeled palmitate (d31-palmitate) and arachidonate (d11-arachidonate). Upon treatment of deuterium labeled fatty acids, wild type cells displayed lamellar and punctate structures, which represent incorporated fatty acid metabolites in ER membranes and lipid droplets, respectively (Shen et al., 2017). However, unlike wild type cells, CHP1 knockouts failed to incorporate both fatty acids into membranes or lipid droplets (Figures 2D & S2D). Similarly, loss of CHP1 prevented lipid droplet formation in HeLa cells (Figure 2E) and differentiated mouse 3T3-F442A adipocytes (Figures 2F & S2E-S2G). These results suggest that CHP1 is essential for incorporating fatty acids to triacylglycerols and membrane lipids of mammalian cells.
Figure 2. CHP1 is essential for glycerolipid synthesis and lipid storage in metazoa.

(A) Schematic depicting the negative CRISPR based screen with arachidonate.
(B) Ranked differential gene scores of arachidonate-treated (50 uM) Jurkat cells relative to untreated controls. Gene scores for ACSL4, CHP1 and ACSL3 are indicated in red.
(C) Fold change in cell number (log2) of Jurkat wild type (black), ACSL4_KO (blue), ACSL3_KO and CHP1_KO (gray) cells after a 4-day treatment under the indicated arachidonate concentrations (mean ± SD, n=3). **p < 0.01, ***p < 0.001 versus wild type.
(D) Representative Stimulated Raman scattering imaging of deuterium-labeled palmitate (top) and arachidonate (bottom) treated HeLa wild type and CHP1_KO cells. Intensity indicates the relative concentrations of labeled fatty acid metabolites. Scale bar, 80 μm.
(E) Representative fluorescence images of lipid droplet content in HeLa wild type, ACSL3_KO and CHP1_KO cells treated with 1mM oleate. Stains for neutral lipid (red), nucleus (blue) and cytoskeleton (green) were used. Scale bar, 30 μm.
(F) Oil red O staining of mouse 3T3-F442A adipocytes. Pre-adipocytes were infected with a control or CHP1 sgRNA plasmids. Cells were then differentiated with a standard hormone cocktail and stained with oil red O. Images of wells (top) and representative micrographs (bottom) were shown. Scale bar, 150 μm.
(G) Protein sequence comparison of human CHP1 to its closest orthologue or paralogue in mouse, fruit fly and nematode.
(H) C. elegans were fed with bacteria containing a control or knockdown plasmid of the CHP1 paralogue pbo-1. Worms were fixed in isopropanol and stained with Nile red. Nile red fluorescence signals (red) were merged with brightfield micrographs (n=5). Scale bar, 200 μm.
(I) Representative images of Nile red fluorescence (green) in the anterior midguts of indicated flies were shown (n=3). CHP1 orthologue Drosophila elm was knocked-down by UAS-elm RNAi under Actin5C Gal4 driver. White RNAi served as control. Scale bar, 200 μm.
See also Figure S2.
As orthologues of CHP1 proteins are conserved in vertebrates and invertebrates including Drosophila melanogaster and Caenorhabditis elegans (Figures 2G & S2H), we next asked whether CHP1 is also essential for lipid storage in lower metazoa. RNAi-mediated knockdown of CHP1 orthologue pbo-1 suppressed lipid accumulation in the intestines of C. elegans as determined by Nile red staining (Figures 2H & S2I). To investigate the potential function of CHP1 in regulating Drosophila lipid storage, we ubiquitously knocked down CHP1 orthologue elm by using an Actin5C Gal4 driver (Figure S2J). Reduction of elm expression also led to a decrease in lipid content of the two specialized fat storing organs; midgut (Figure 2I & S2K) and fat body (Figure S2L). Altogether, this indicates a conserved role for CHP1 in metazoan lipid storage.
CHP1 regulates glycerolipid synthesis downstream of ACSLs
ACSLs catalyze the formation of fatty acyl-CoA esters, which in turn act as substrates for the synthesis of glycerolipids, cholesteryl esters and acyl-carnitines for β-oxidation. Given that ACSLs were the top-scoring genes in our screens, we reasoned that CHP1 loss may influence the function of ACSLs or other downstream enzymes. To address this, we measured steady state levels of different lipid species in CHP1 and ACSL3 knockout cells as well as wild type counterparts upon palmitate treatment using unbiased lipid profiling. Consistent with an upstream role in lipid metabolism, loss of ACSL3 resulted in a decrease in triacylglycerols, cholesteryl esters and acylcarnitines, all of which are derived from palmitoyl-CoA. CHP1 loss led to a similar decrease in triacylglycerols but, unlike ACSL3 loss, resulted in accumulation of cholesteryl esters and acylcarnitines, particularly in response to palmitate supplementation (Figure 3A). This phenotype was rescued by reintroduction of sgRNA resistant CHP1 cDNA (Figure S3A) but did not affect the cellular rate of fatty acid oxidation (Figure S3B). Additionally, CHP1 loss resulted in an increase in cellular palmitoyl-CoA levels (Figure S3C). This observation indicates a role for CHP1 downstream of ACSLs. To test this further, we performed a metabolite tracing experiment and measured the metabolic fate of uniformly 13C labeled palmitate. Compared to wild type cells, CHP1 knockout cells displayed significantly reduced incorporation of single (M+16) and double (M+32) palmitoyl labeled triacylglycerols and phosphatidylcholines, but increased incorporation of M+16 labeled acylcarnitines (Figure 3B). These experiments suggest that CHP1 acts downstream of ACSLs to regulate glycerolipid synthesis (Figure 3C), a phenotype also seen in C.elegans and D. melanogaster (Figures S3D-S3E).
Figure 3. CHP1 regulates glycerolipid synthesis downstream of ACSLs.

(A) Heatmap (left) and bar graphs (right) indicating the relative change in abundance (log2) of individual lipid species of Jurkat wild type, ACSL3_KO and CHP1_KO cells to untreated wild type controls. Cells were treated with control BSA or 50μM palmitate for 24 hrs prior to lipid extraction. (mean ± SD, n=3). **p < 0.01, ***p < 0.001.
(B) Schematic depicting metabolic tracing of [U-13C]-palmitate incorporation (left). Relative abundance of the labeled lipid species of the indicated Jurkat cell lines. Values were normalized to the average of the untreated controls (mean ± SD, n=3) (right).
(C) CHP1 functions downstream of ACSLs, as its loss causes an increase in cholesteryl esters and acylcarnitines, but a decrease in glycerolipids.
See also Figure S3.
CHP1 interacts with ER GPATs to enable glycerolipid synthesis
We next sought to understand the precise mechanism by which CHP1 regulates glycerolipid synthesis. Amino acid sequence analysis of CHP1 protein did not reveal any obvious catalytic domain (Figure S4A). We therefore hypothesized that CHP1 might interact with other glycerolipid metabolism enzymes and regulate them. To identify such enzymes, we performed a mass spectrometric analysis of anti-FLAG immunoprecipitates from human Hela cells stably expressing FLAG-CHP1. This analysis consistently revealed the presence of proteins encoded by the two ER GPATs, GPAT3 and GPAT4, a top scoring gene in our genetic screen (Figures 4A & 1E). Further supporting this interaction, we detected CHP1 proteins in immunoprecipitates of HA-GPAT4 in a reciprocal mass spectrometric analysis (Figure 4A). To confirm the identification of CHP1 as a GPAT interacting protein, we overexpressed FLAG-CHP1 and found that CHP1, but not control GFP protein, co-immunoprecipitated ER GPATs (Figure 4B). This interaction is specific to ER GPATs as we did not observe any interaction between CHP1 and mitochondrial GPATs (GPAT1) in our mass spectrometry analysis and co-immunoprecipitation experiments. Interaction with CHP1 was also confirmed by co-immunoprecipitation using an antibody against endogenous GPAT4 (Figure S4B).
Figure 4. CHP1 interacts with ER GPATs and its interaction is essential for GPAT4 function.

(A) Mass spectrometric analyses identified GPAT4 and GPAT3-derived peptides in immunoprecipitates prepared from HeLa cells expressing FLAG-tagged CHP1 (top). A reciprocal co-immunoprecipitation with HA-GPAT4 identified CHP1-derived peptides (bottom). Top 5 proteins in each experiment were shown. Peptide spectrum mass (PSM) indicates the total number of identified peptide spectra matched for the protein.
(B) Recombinant FLAG-tagged CHP1 immunoprecipitates endogenous ER GPATs, GPAT4 and GPAT3. Anti-FLAG immunoprecipitates were prepared from HeLa cells expressing FLAG-CHP1 or FLAG-GFP. Cell lysates and immunoprecipiates were analyzed by immunoblotting for the indicated proteins. β-actin was used as a loading control.
(C) Schematic depicting co-essentiality analysis using CRISPR screens in Meyers et al. (2017) (top). Correlations of gene essentialities of CHP1 with other genes were calculated and ranked. GPAT4 is indicated in red and other GPATs (GPAT1, GPAT2 and GPAT3) in blue (bottom).
(D) Correlation of total lipid profiles of Jurkat wild type, CHP1_KO, GPAT4_KO and GPAT3_KO cells treated with control BSA or 50μM palmitate for 24 hrs prior to lipid extraction. Pearson correlation coefficients of the relative abundance of all lipid species among each cell line were compared. Changes in lipid profiles are shown in Figure S4D.
(E) Fold change in cell number (log2) of Jurkat wild type (black), GPAT4_KO (blue) and GPAT3_KO (gray) cells after a 4-day treatment with the indicated palmitate concentrations (mean ± SD, n=3). **p < 0.01, ***p < 0.001 versus wild type.
(F) Interaction of CHP1 with HA-tagged GPAT4 lacking regions between amino acids 84–156. Indicated deletions and full length HA-tagged GPAT4 cDNA were expressed in HeLa cells. Anti-HA immunoprecipitates were prepared from cell lysates and analyzed by immunoblotting for levels of indicated proteins.
(G) Fold change (log2) in the abundance of triacylglycerols of HeLa GPAT4_KO cells expressing vector, HA-GPAT4 and HA-GPAT4-113-119del cDNA treated with 50μM palmitate for 24 hrs prior to lipid extraction. Values were normalized to the average of the untreated GPAT4_KO cells expressing HA-GPAT4 (mean ± SD, n=3). *p < 0.05, **p < 0.01.
(I) Fold change in cell number (log2) of HeLa wild type (black), GPAT4_KO (blue), GPAT4_KO expressing HA-GPAT4 (gray) and HA-GPAT4-113-119del (blue) cells after a 4-day treatment with the indicated palmitate concentrations (mean ± SD, n=3). **p < 0.01 versus wild type.
See also Figures S4 & S5.
To study this relationship further, we determined biologically relevant gene associations with CHP1 using a publicly available CRISPR-Cas9 genetic screening data of 347 human cancer cell lines (Meyers et al., 2017). It has previously been shown that covariability in gene essentiality provides an efficient means of defining genes with similar biological functions (Wang et al., 2017). Analysis of coessential gene scores revealed that the essentiality of CHP1 correlated highly significantly with that of GPAT4 but not other GPAT family members (Figure 4C). These results were further confirmed with an independent CRISPR screen dataset (Wang et al., 2017) (Figure S4C). Consistent with a functional relationship between CHP1 and GPAT4, lipid profiles of CHP1 knockout cells correlate more significantly with those of GPAT4 knockout cells than GPAT3 knockout or wild type counterparts (Figures 4D & S4D). Additionally, GPAT4, but not GPAT3 knockout cells were resistant to palmitate toxicity in our genetic screens and cell viability experiments (Figures 4E, S4E & 1E), suggesting that GPAT4 is the major ER GPAT for glycerolipid synthesis.
We next asked whether CHP1-GPAT4 interaction itself is required for glycerolipid synthesis. CHP1 and GPAT4 are more stable when they interact with each other, as loss of either protein reduces the levels of the interacting partner even though mRNA levels remain relatively unchanged (Figures S4F-S4H). To address this further, we performed a deletion analysis of GPAT4 protein and looked for GPAT4 mutants that no longer bind CHP1. Large terminal deletions of GPAT4 revealed that the N-terminus of the protein is responsible for its interaction with CHP1 (Figures S4IS4K). Smaller deletions within the N-terminal region identified a conserved 113–126 amino acid region as necessary for this interaction (Figure 4F), regardless of the reduced CHP1 protein level due to GPAT4 loss (Figure S4L). GPAT4 is an ER membrane protein, but loss of CHP1 interaction did not alter its ER localization (Figures S5A-S5B). To test the necessity of the CHP1-GPAT4 interaction in glycerolipid synthesis, we expressed wild type and CHP1-interaction deficient (113–119del) GPAT4 cDNA in GPAT4 knockout cells. Unlike wild type GPAT4 cDNA, introduction of the CHP1-interaction deficient GPAT4 cDNA failed to restore the decrease in triacylglycerol levels (Figure 4G) or palmitate sensitivity (Figure 4H). These experiments demonstrate that CHP1-GPAT4 interaction is essential to enable glycerolipid synthesis in mammalian cells.
CHP1 activates GPAT4 through its myristoyl moiety
Given the requirement of the CHP1-GPAT4 interaction for glycerolipid synthesis, we reasoned that CHP1 may modulate GPAT4 catalytic activity. To test this, we performed a GPAT activity assay using 14C labeled glycerol-3-phosphate as substrate in wild type and CHP1 knockout HeLa cells. Indeed, loss of CHP1 reduced cellular GPAT enzyme activity to the levels seen in GPAT4/GPAT3 double knockout cells, indicating a requirement for CHP1 in ER GPAT activity (Figure S6A).
We next sought to determine how CHP1 may activate GPAT4. CHP1 protein contains 1) a myristoylation signal (MGSRAS); 2) two functional EF-hand Ca2+-binding domains (EF3-EF4); and 3) two nuclear export signals (NES) (Figure 5A). We mutated key CHP1 protein residues to disrupt myristoylation (G2A/S6A), calcium binding (D123A/D125A/D127A/D164A/D166A/D168A) and the nuclear export signal (V138A/L139A/V179A/L180A) and stably expressed them in a CHP1 knockout HeLa cell line. Expression of the wild type or calcium binding deficient CHP1 restored sensitivity to palmitate toxicity, but mutants of the myristoylation site or the nuclear export signal failed to do so (Figure 5B). This suggests that cytoplasmic localization and myristoylation of CHP1 are essential for its metabolic function, while calcium binding is not.
Figure 5. CHP1 activates GPAT4 through its myristoyl moiety.

(A) Schematic of functional protein domains of CHP1.
(B) Identification of functionally relevant residues of CHP1 in glycerolipid metabolism. Fold change in cell number (log2) of HeLa wild type (black), CHP1_KO (blue), CHP1_KO expressing FLAG-CHP1-EF_mut (D123A/D125A/D127A/D164A/D166A/D168A) (gray), FLAG-CHP1-NES_mut (V138A/L139A/V179A/L180A), FLAG-CHP1-myr_mut (G2A/S6A) and FLAG-CHP1-myr_EF_mut (G2A/S6A/D123A/D125A/D127A/D164A/D166A/D168A) (red) cells after a 4-day treatment with the indicated palmitate concentrations (mean ± SD, n=3). ***p < 0.001 versus wild type.
(C) GPAT activity assay of HeLa CHP1_KO cells expressing vector, FLAG-CHP1 and FLAG-CHP1-myr_mut cDNAs. All cell lines are additionally infected with an HA-GPAT4 virus. Immunoblotting analysis of the indicated proteins. β-actin was used as a loading control (top). Cell lysates were incubated with [14C]-glycerol-3-phosphate and with or without palmitoyl-CoA. GPAT activity was quantified as the CPM in the non-polar fraction (mean ± SD, n=3). **p < 0.01, ***p < 0.001 versus CHP1_KO expressing FLAG-CHP1 (bottom).
(D) Fold change (log2) in indicated lipid groups of HeLa CHP1_KO cells expressing vector, FLAG-CHP1 and FLAG-CHP1-myr_mut cDNAs treated with 50μM palmitate for 24 hrs prior to lipid extraction. Lipid species of the same group were summed. Values were normalized to the average of the untreated CHP1_KO cells expressing FLAG-CHP1 cDNA (mean ± SD, n=3). **p < 0.01, ***p < 0.001 versus CHP1_KO expressing FLAG-CHP1 cDNA.
(E) Schematic depicting steps to crosslink CHP1 and GPAT4 through a bifunctional fatty acyl group on the myristoylation site of CHP1.
(F) Immunoblot using an antibody against CHP1 on immunoprecipitates with FLAG-CHP1 or FLAG-CHP1-myr_mut in the presence or absence of x-alk-16 photo-crosslinking. Crosslinked complex of CHP1-GPAT4 appeared as a higher band with a combined molecular weight of these two proteins (~80 kDa).
(G) Schematic depicting active and inactive forms of GPAT4. Interaction of CHP1 with GPAT4 alone is necessary but not sufficient for GPAT4 activity. Full GPAT4 activity requires CHP1 to be myristoylated.
See also Figure S6.
Myristoylation, the addition of a 12-carbon fatty acyl chain, plays important roles in protein-protein interaction and targeting proteins to cellular membranes, regulating diverse cellular functions (Farazi et al., 2001). Interestingly, blocking myristoylation of CHP1 did not change the localization of CHP1 (Figure S6B) or its interaction with GPAT4 in co-immunoprecipitation experiments (Figure S6C). As myristoylation can also modulate protein structure and activity (Hantschel et al., 2003), we asked whether CHP1 myristoylation is required for GPAT4 to be active. We therefore performed GPAT activity assays in CHP1 knockout cells and isogenic counterparts complemented with wild type and myristoylation mutant CHP1 cDNA. While expression of wild type CHP1 cDNA induced GPAT activity ~20 fold, myristoylation mutant CHP1 cDNA failed to activate GPATs in CHP1 knockout cells (Figure 5C). Consistent with this, reintroduction of wild type but not myristoylation mutant CHP1 cDNA restored triacylglycerol, cholesteryl ester and acylcarnitine levels of CHP1 knockout cells (Figure 5D). To test whether the myristoyl group on CHP1 also makes direct intermolecular contacts with GPAT4, we used x-alk-16, a bi-functional fatty acid reporter that contains a clickable alkyne and a photo-activatable diazirine which can crosslink proteins in its close vicinity (Peng and Hang, 2015) (Figure 5E). Similar to myristate, x-alk-16 can incorporate into wild type CHP1 and not the myristoylation mutant counterpart (Figure S6D). In these experiments, only wild type, but not myristoylation deficient CHP1, effectively co-immunoprecipitated GPAT4 upon photocrosslinking, confirming a contact between the CHP1 myristoyl moiety and GPAT4 (Figures 5F &S6E). Altogether, our results show that CHP1 must interact with GPAT4 but also be myristoylated to fully activate GPAT4 for enabling glycerolipid synthesis at the endoplasmic reticulum (Figure 5G).
Upon CHP1 loss, cells depend on peroxisomal GNPAT to synthesize sufficient phospholipids to proliferate
Our results with CHP1 knockout cells suggest that mammalian cells can survive and proliferate without ER GPAT activity. As these enzymes are required for the synthesis of essential membrane lipids, our findings indicate a degree of metabolic plasticity that allows sufficient phospholipid synthesis for cell survival and proliferation in the absence of CHP1. To identify these alternative metabolic routes that enable cell proliferation, we sought to define genes that are synthetically lethal with CHP1 loss. We therefore transduced wild type and CHP1 knockout Jurkat cells with the metabolism focused sgRNA library and identified genes whose loss reduced cellular proliferation and viability only in CHP1 knockout cells, but not in wild type counterparts (Figure 6A). Remarkably, the top two scoring genes essential in CHP1 knockout cells both encode peroxisomal proteins: ATP binding cassette subfamily D member 3 (ABCD3), which catalyzes the import of acyl-CoAs into peroxisomes and glyceronephosphate O-acyltransferase (GNPAT), which catalyzes the acylation of dihydroxyacetonephosphate (DHAP), a precursor for peroxisomal ether lipids (Datta and Hajra, 1984) (Figures 6B & S7A). Interestingly, none of the mitochondrial GPATs scored, suggesting that ER GPATs may use different fatty acid pools or their products may have different metabolic fates. To confirm these results, we transduced Jurkat wild type cells or CHP1 knockout cells with two sgRNAs targeting GNPAT. As predicted by the screen, GNPAT loss reduced proliferation of CHP1 knockout cells, but not that of wild type cells (Figure 6C). Interestingly, at the time of collection, we found that the remaining CHP1 knockout cells infected with virus expressing GNPAT sgRNA had higher amounts of GNPAT than the infected wild type cells, which is consistent with a selection against GNPAT loss in CHP1 knockout state (Figure 6C). Collectively, these data demonstrate that GNPAT is essential for the optimal proliferation of cells lacking ER GPAT activity.
Figure 6. Upon CHP1 loss, cells depend on peroxisomal GNPAT to proliferate.

(A) Schematic depicting the CRISPR based screens of wild type and CHP1_KO Jurkat cells using a metabolism focused sgRNA library.
(B) Gene scores in wild type versus CHP1_KO Jurkat cells (top). Top 5 genes scoring as differentially required in the CHP1_KO cells. Genes linked to peroxisomes are indicated in red (bottom).
(C) Immunoblot analysis of Jurkat wild type and CHP1_KO cells infected with control and GNPAT targeting sgRNAs. Lysates from the first and ninth day of culture were compared. β-actin was used as a loading control (top). Relative cell numbers of the indicated cell lines to vector controls (mean ± SD, n=3). *p < 0.05, ***p < 0.001 versus vector control (bottom).
(D) Fraction of ether phosphatidylcholine (PC) and phosphatidylethanolamine (PE) species of wild type, GNPAT_KO and CHP1_KO Jurkat cells. Lipid species of the same group were summed (mean ± SD, n=3).
See also Figure S7.
We next asked how GNPAT alters cellular membrane lipid composition upon CHP1 loss. GNPAT catalyzes the first step of the synthesis of ether lipids, a unique class of glycerolipids that have an ether bond at the sn-1 position of the glycerol backbone rather than an ester bond like most other glycerolipids (Braverman and Moser, 2012). Under normal conditions, peroxisomes are the main site of ether lipid synthesis but contribute only to a minor portion of total glycerolipid content (Hajra et al., 2000; Liu et al., 2005). Consistent with these observations, ether lipid content of phosphatidylcholine and phosphatidylethanolamine, the two most abundant membrane lipids, decreased in GNPAT knockout cells (Figure 6D). In contrast, CHP1 knockout cells accumulated 2-fold more ether lipids in their membranes compared to wild type cells, suggesting that GNPAT mediated acylation of DHAP is the major route for glycerolipid synthesis when CHP1 or ER GPAT activity is lost (Figure 6D). This indicates that when ER glycerolipid pathway is inhibited, peroxisomal GNPAT compensates for the reduced glycerolipid synthesis and provides sufficient precursors for membrane lipid synthesis to enable cell survival and proliferation (Figure 7).
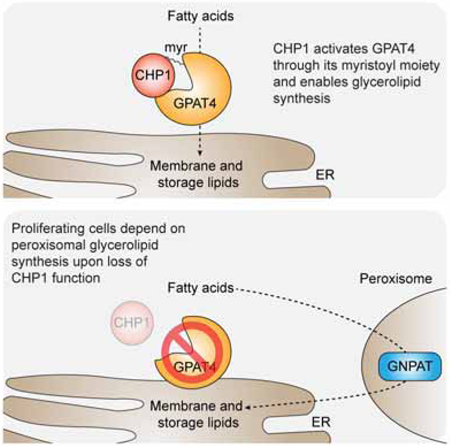
Figure 7. Loss of CHP1 rewires glycerolipid metabolism in proliferating cells.

(A) Schematic depicting CHP1/GPAT4-catalyzed ER glycerolipid synthesis and the alternative peroxisomal pathway upon CHP1-GPAT4 loss. Under normal circumstances, CHP1 binds to and activates the major ER GPAT, (GPAT4), enabling the synthesis of membrane lipids and triacylglycerols at the endoplasmic reticulum. Upon CHP1 loss, peroxisomal GNPAT compensates for the loss of ER glycerolipid synthesis by generating acyl-DHAP, which in turn generates lysophosphatidic acid and glycerolipids.
Discussion
Cells require glycerolipid synthesis to make membranes and lipid droplets. Here, using multiple genetic screens, we systematically defined metabolic regulators of glycerolipid synthesis in mammalian cells. A major finding of our work is the identification of CHP1, a poorly characterized protein, as a key regulator of the first committed step of glycerolipid synthesis. Our data also suggests that fatty acid toxicity arises due to excess incorporation into cellular glycerolipids and that blocking the initial steps of the glycerolipid synthesis pathway, particularly GPAT4, is sufficient to prevent this toxicity. These results are confirmed by an shRNA screen by Piccolis et al. in this issue which shows GPAT4 as a key modulator of lipotoxicity caused by saturated fatty acids. Consistent with these findings, recent work shows that saturated fatty acids generate solid phase regions within the organellar membranes, disrupting membrane fluidity and thus impairing cell viability (Masuda et al., 2015; Shen et al., 2017). Our work also highlights the applicability of SRS microscopy in the intracellular imaging of labeled metabolites in high concentration (Shen et al., 2017).
While there are a few reports on the regulation of GPAT4 (Pagac et al., 2016; Shan et al., 2010; Yu et al., 2018), precisely how ER GPAT activity is regulated in mammalian cells is not completely understood. We identify CHP1 as a major regulatory partner for GPAT4, but whether CHP1-GPAT4 interaction and CHP1 myristoylation are regulated steps of lipid metabolism is still unclear. Myristoylation does not alter GPAT4 localization and may cause a conformational change to prime its catalytic site. This suggests that potential upstream pathways may impact GPAT4 activity rather than its localization. However, future work combining molecular and structural studies will clarify the upstream pathways that regulate CHP1-GPAT4 interaction.
The fact that CHP1 null cells survive and proliferate raises the question of how mammalian cells can proliferate without ER GPAT activity. Previous work suggests that mitochondrial GPATs are a major route of glycerolipid synthesis in some cell or tissue types and may compensate for ER GPATs (Lewin et al., 2008; Wendel et al., 2013). In contrast, our genetic screens with CHP1 null cells show an alternative metabolic pathway involving peroxisomal GNPAT as the major route for glycerolipid synthesis. It will be necessary to determine whether this plastic metabolism is a feature of proliferating cells or other differentiated cell types as well. If true, our data raises the possibility that ER GPATs may use different metabolite pools from their mitochondrial counterparts.
Finally, it will be of interest to understand whether our findings have therapeutic implications. As a conserved regulatory subunit in the membrane and triacylglycerol synthesis pathway, CHP1 likely plays a role in human physiology. A recent study identified CHP1 mutations in patients with cerebellar ataxia (Mendoza-Ferreira et al., 2018). Interestingly, similar ataxic phenotypes are associated with loss-of-function mutations in lipin enzymes downstream of GPATs (Dwyer et al., 2012). Since CHP1 may impact other biological processes (Lin and Barber, 1996), it should be determined whether any of these effects is related to CHP1’s role in lipid metabolism. Given that inhibition of GPAT4 ameliorates metabolic syndrome in mouse models (Zhang et al., 2014, Kuhajda et al., 2011), targeting CHP1-GPAT4 interaction or CHP1 myristoylation with small molecule inhibitors may lead to effective therapies for dysfunctional lipid accumulation.
STAR Methods
Contact for Reagent and Resource Sharing
Further information and requests for resources and reagents should be directed to and will be fulfilled by the Lead Contact, Kıvanç Birsoy (kbirsoy@rockefeller.edu).
Experimental Model and Subject Details
Cell Lines
The cell line 3T3-F442A was kindly provided by Dr. Paul Cohen (Rockefeller University). Remaining cell lines (HEK293T, Jurkat, HeLa and HepG2) were purchased from the ATCC. Cell lines were verified to be free of mycoplasma contamination and the identities of all were authenticated by STR profiling.
Cell Culture Conditions
Jurkat cells and their derivatives were maintained in RPMI media (Gibco) containing 2 mM glutamine, 10% fetal bovine serum, penicillin and streptomycin. HEK293T, HeLa, HepG2, 3T3-F442A and their derivatives were maintained in DMEM media (Gibco) containing 4.5g/L glucose, 110mg/L pyruvate, 4mM glutamine, 10% fetal bovine serum, penicillin and streptomycin. For experiments involving sensitivity to fatty acids, regular RPMI was supplemented with 10% charcoal/dextran treated fetal bovine serum (HyClone). All cells were maintained at 37°C and 5% CO2.
Method Details
Cell proliferation assays
Indicated cell lines were cultured in replicates of three in 96-well plates at 1000 (suspension) or 150 (adherent) cells per well in 200 uL RPMI base media under the conditions described in each experiment, and a separate group of 3 wells was also plated for each cell line with no treatment for an initial time point. Immediately (untreated cells for initial time point) or after 4 days (with varying treatment conditions), 40 uL of Cell Titer Glo reagent (Promega) was added to each well, mixed briefly, and the luminescence read on a luminometer (Molecular Devices). Initial reading and treatment for adherent cells were carried out after cells were allowed to adhere overnight. For each well, the fold change in luminescence relative to the initial luminescence was measured and reported in a log2 scale as the number of population doublings. Cell culture images were taken using a Primovert microscope (Zeiss).
Bovine serum albumin (BSA) conjugation of fatty acids
All fatty acids used for treatment were conjugated to BSA. A 12 mM solution of the indicated fatty acid was made by dissolving the fatty acid in 20 mL of 0.01M NaOH and stirred for 30 min at 70°C. Dissolved fatty acid solution was added into a stirring 60 mL 10% BSA solution in PBS to make a final concentration of 3 mM. Solution was incubated with stirring for 1hr at 37°C to allow fatty acids to conjugate with BSA. Solution was then 0.22 μm filtered and stored in a glass container.
Lipid metabolite profiling and isotope tracing
For lipid metabolite profiling experiments, Jurkat cells (3 × 10⁶ cells per replicate) were cultured as triplicates in 6-well plates and treated for 24 hrs with the indicated conditions prior to collection of cells and washing with 1 mL of cold 0.9% NaCl. Cell pellets were resuspended in 500 uL of cold LC/MS grade methanol, and non-polar metabolites extracted by consecutive addition of 250 uL LC/MS grade water followed by 400 uL of LC/MS grade chloroform. HeLa and 3T3-F442A cells (6 × 10⁵ cells per replicate) were cultured as triplicates in 6-well plates and allowed to adhere overnight. Cells were subsequently treated for 24 hrs with the indicated conditions and washed in-well with 1mL of cold 0.9% NaCl. After consecutive addition of 600 uL of LC/MS grade methanol and 300 uL of LC/MS grade water, cells were scraped off and 750 uL of the suspension was mixed with 400 uL of LC/MS grade chloroform for non-polar metabolites extraction. After 10 min extraction by vortexing at 4°C and centrifugation for 10 min at 1 0,000 x g and 4°C, 350 μL of the lower lipid-containing layer was carefully collected and dried under nitrogen. Dried lipid extracts were stored at −80°C until LC/MS analysis. For isotope tracing exp eriments, cells were treated with 500 uM [U-13C16]-palmitate (Cambridge Isotope Laboratories) for 24 hrs before metabolite extraction. For C. elegans samples, 1000 worms were collected and for D. melanogaster, 10 mg of migut tissue was pooled from multiple flies for each replicate. Samples were treated the same way as Jurkat cells except for a longer vortexing step of 1 hr.
Lipids were separated on an Ascentis Express C18 2.1 × 150 mm 2.7 μm column (Sigma-Aldrich) connected to a Vanquish UHPLC system and a QExactive Plus benchtop orbitrap mass spectrometer (Thermo Fisher Scientific) equipped with a heated electrospray ionization (HESI) probe. Dried lipid extracts were reconstituted in 50 uL 65:30:5 acetonitrile:isopropanol:water (v/v/v) and 5 uL of sample were injected into the LC/MS/MS, with separate injections for positive and negative ionization modes. Mobile phase A in the chromatographic method consisted of 60:40 water:acetonitrile with 10 mM ammonium formate and 0.1% formic acid, and mobile phase B consisted of 90:10 isopropanol:acetonitrile, with 10 mM ammonium formate and 0.1% formic acid. The chromatographic gradient was described previously (Hu et al., 2008). The column oven and autosampler were held at 55°C and 4°C, respectively. The mass spectrometer parameters were described previously (Bird et al., 2011). The spray voltage was set to 3.0 kV, and the heated capillary and the HESI were held at 285°C and 350°C, respectively. The S-lens RF level was set to 45, sweep gas at 1 and the sheath and auxiliary gas were set to 60 and 20 units, respectively. These conditions were held constant for both positive and negative ionization mode acquisitions. External mass calibration was performed every 7 days using the standard calibration mixture.
Mass spectra were acquired in both full-scan and data-dependent MS/MS mode. For the full-scan acquisition, the resolution was set to 70,000, the AGC target was 1 × 10⁶, the maximum injection time was 50 msec, and the scan range was m/z = 120–2000. For data-dependent MS/MS, the top 10 ions in each full scan were isolated with a 1.2-Da window, fragmented with a step-wise collision energy of 20, 30, and 40 units, and analyzed at a resolution of 17,500 with an AGC target of 1 × 10⁵ and a maximum injection time of 75 msec. The underfill ratio was set to 0. The selection of the top 10 ions was set to isotopic exclusion, a dynamic exclusion window of 8.0 sec.
High-throughput identification and relative quantification of lipids were performed separately for positive and negative ionization mode data, using LipidSearch software (ThermoFisher Scientific/Mitsui Knowledge Industries) (Taguchi and Ishikawa, 2010; Yamada et al., 2013) using the default parameters for QExactive product search and alignment. After alignment, raw peak areas for all identified lipids were exported to Microsoft Excel and filtered according to the following predetermined quality control criteria: Rej (“Reject” parameter calculated by LipidSearch) equal to 0; PQ (“Peak Quality” parameter calculated by LipidSearch software) greater than 0.85; CV (standard deviation / mean peak area across triplicate injections of a represented (pooled) biological sample) below 0.4; R (linear correlation across a three-point dilution series of the representative (pooled) biological sample) greater than 0.9. Typically, approximately 70% of identified lipids passed all four quality control criteria. Raw peak areas of the filtered lipids were added together to create a total lipid signal for each sample, and individual lipid peak areas were normalized to this total signal as a control for lipid extraction efficiency, as well as sample loading. Lipid groups with CV more than 0.15 were then excluded.
CRISPR-based screen
The metabolism-focused and whole genome sgRNA libraries were designed and screens performed as previously described (Wang et al., 2014, 2017). Oligonucleotides for sgRNAs were synthesized by CustomArray Inc. and amplified by PCR. For positive genetic screen, only gene which score strongly in the positive end were analyzed since only a small portion of the initial cell population remained and negative gene score changes are unreliable. A complete list of differential gene scores for each screen is provided in Table S1.
Generation of knock-out and cDNA overexpression cell lines
sgRNAs (oligonucleotide sequences are indicated in Table S3) were cloned into lentiCRISPR-v1 or -v2 linearized with BsmBI by T4 ligase (NEB). sgRNA expressing vector along with lentiviral packaging vectors Delta-VPR and CMV VSV-G were transfected into HEK-293T cells using the XTremeGene 9 transfection reagent (Roche). Similarly, for overexpression cell lines, gBlocks (IDT) containing the cDNA of interest were cloned into pMXS linearized with BamHI and NotI by Gibson Assembly (NEB). cDNA vectors along with retroviral packaging vectors gag-pol and CMV VSV-G were transfected into HEK-293T cells. For FLAG and HA tagged proteins, tags were added to the C terminus of each protein. Media was changed 24 hrs after transfection. The virus-containing supernatant was collected 48 hrs after transfection and passed through a 0.45 μm filter to eliminate cells. Target cells in 6-well tissue culture plates were infected in media containing 8 μg/mL of polybrene and a spin infection was performed by centrifugation at 2,200 rpm for 1 hour. Post-infection, virus was removed and cells were selected with puromycin or blasticidin. For knockout cells, after selection, cells were single-cell diluted into the wells of a 96-well plate. Cells were grown for two weeks, and the resultant colonies were expanded. Clones were validated for loss of the relevant protein via immunoblotting.
Immunoblotting
Cell pellets were washed twice with ice-cold PBS prior to lysis in RIPA buffer (10 mM Tris-Cl pH 7.5, 150 mM NaCl, 1 mM EDTA, 1% Triton X-100, 0.1% SDS) supplemented with protease inhibitors and phosphatase inhibitors (Roche). Each cell lysate was sonicated and, after centrifugation for 10 min at 4°C and 20,000 x g, supernatants were collec ted. For immunoblots with GPAT4, cell pellets were lysed with fos-choline buffer (50 mM Tris-HCl pH 7.5, 150 mM NaCl, 1 mM EDTA, 0.2% foscholine-13 (Anatrace)) supplemented with protease inhibitors and phosphatase inhibitors (Roche). Each cell lysate was incubated in lysis buffer for 10 min at 4°C and, after centrifugation for 10 min at 4°C and 13,000 x g, supernatants were collected. Sa mple protein concentrations were determined by using Pierce BCA Protein Assay Kit (Thermo Scientific) with bovine serum albumin as a protein standard. Samples were resolved on 12% or 10–20% SDS-PAGE gels and analyzed by immunoblotting as previously described (Birsoy et al., 2014).
Stimulated Raman scattering microscopy
The setup for SRS microscopy was similar to what was described earlier (Shen et al., 2014), which integrates picoEmerald laser system (Applied Physics and Electronics) and a laser-scanning microscope (FV1200MPE; Olympus). The images were taken through a 60× objective (water immersion, N.A. = 1.2, UPlanAPO/IR; Olympus). The lasers were tuned so that C-D bond vibration at 2101 cm−1 could be selectively imaged. Images were acquired by Fluoview Software and were later assigned pseudo colors in ImageJ. CH3 bond vibration signal was collected for use as protein content normalization.
Fluorescence microscopy
In 6-well plates, 300,000 cells were seeded on coverslips previously coated with fibronectin. 12 hours later, cells were fixed for 15 min with 4% paraformaldehyde diluted in PBS at room temperature. After three washes with PBS, cells on the coverslips were permeabilized by incubation with 0.01% TritonX-100 in PBS for 1 min at room temperature prior to another three PBS washes. Coverslips were incubated with Alexa 488 Phalloidin (20X diluted in PBS) at room temperature for 20 min and washed thrice with PBS. Coverslips were then incubated with LipidTOX neutral lipid stain (1000X diluted in PBS) at room temperature for 30 min. After three washes with PBS, coverslips were incubated with a 200 nM solution of DAPI in PBS for 5 min in dark, washed three times with PBS and finally mounted onto slides with Prolong Gold antifade mounting media (Invitrogen). Images were taken on a Delta Vision bright-field fluorescence Inverted Olympus IX-71 microscope (GE Healthcare).
Differentiation and oil red O staining of 3T3-F442A cells
For differentiation, 3T3-F442A cells were subcultured in 6-well collagen-coated plates (Corning BioCoat) and grown to confluence. Differentiation was induced by treating confluent cells with medium containing 10% FBS, 1 μM dexamethasone, 1 μM rosiglitazone, 850 nM insulin, and 1 nM T3 for 48 hrs. On day 2 of differentiation, cells were switched to medium containing 10% FBS, 1 μM rosiglitazone, 850 nM insulin, and 1 nM T3. From day 4 and onwards, differentiated cells were kept in maintenance medium containing 10% FBS, 850 nM insulin, and 1 nM T3, changing the medium every 48 hrs. On day 7, differentiated cells were subject to analyses. Cells in each well were washed with 2 mL of PBS once and fixed with 4% paraformaldehyde for 15 min at room temperature. Paraformaldehyde was aspirated and each well was washed with 60% isopropanol. Cells were incubated with oil red O working solution for 15 min at room temperature and washed with 60% isopropanol. Cells were then washed with deionized water and kept in PBS for imaging. Micrographs were taken with a REVOLVE4 microscope (Echo Laboratories).
Nile red staining of C. elegans
Feeding RNAi was performed on N2 (wildtype) C. elegans as described (Kamath et al., 2000). The Y71H2AL.c clone (pbo-1) from the Vidal RNAi feeding library was used (Rual et al., 2004). 500–1000 worms were collected and washed twice with PBS + 0.1% Triton X-100. Worms were then fixed with 200 μL of 40% isopropanol for 3 min. Excess supernatant was removed and the worms were stained in 150 μL of Nile red working solution (6 μL of 0.5 mg/mL Nile red dissolved in acetone) for 30 min at room temperature in dark with gentle rocking. Nile red working solution was removed and worms were resuspended in 50 μL M9 buffer and mounted on a 2% agarose pad for microscopy. Nile red stain was observed under the FITC channel. Fluorescence images were taken using a Primovert microscope (Zeiss).
Nile red staining and qPCR of D. melanogaster
D. melanogaster lines were kept at a 12-hour light/dark cycle and all crosses were performed at 22–25°C. The following fly stocks were provided from B loomington Drosophila Stock Center (BDSC) and Vienna Drosophila Resource Center (VDRC). The stock numbers (#) were given in parentheses. Those stocks used in here are: White RNAi (BDSC#33623), elm RNAi (VDRC#108624), Actin5C Gal4 (BDSC#3954). Adult flies were directly homogenized in 1 mL TRIzol (Life Technologies) and total RNA was isolated according to the manufacturer’s protocol (RNeasy mini kit, QIAGEN). cDNA library was prepared from 5 μg total RNA, by using oligo(dT) amplification and the Superscript III First Strand synthesis kit (Invitrogen). cDNA library was used to amplify the Elm and Rp32l transcripts with the forward 5’-AACCAAATCGAGCGACTTTACT-3’, reverse 5’-CAGTTCCGGGATACGCATCAG-3’ and forward 5’-CCCAAGGGTATCGACAACAGA-3’, reverse 5’-CGATCTCGCCGCAGTAAAC-3’ primers, respectively. 5 days old adult midguts and fat bodies were dissected in ice cold PBS and kept on ice until required sample size obtained. Tissues were then fixed in ice cold 4% paraformaldehyde/PBS for 20 min at room temperature and washed with PBS for 3 × 10 min. Tissues were stained with 0.25 ug/mL Nile Red/PBS solution for 30 min at room temperature. Following the staining, samples were washed in PBS for 3 × 10 min at room temperature. Specimens were finally mounted in Fluoromount-G (Southern Biotech) and analyzed with confocal microscopy.
Immunoprecipitation
Before lysis for immunoprecipitation, proteins were crosslinked in live cells in media by adding dithiobis(succinimidyl propionate) to a working concentration of 2.5 mM and incubating for 15 min at room temperature. Crosslinking reaction was quenched by adding 1/10 volume of 1M Tris pH 8.5 to the media and incubating for 2 min at room temperature. Cells were washed with ice cold TBS (150 mM NaCl) twice and lysed as described for immunoblotting. For anti-FLAG immunoprecipitations, the FLAG-M2 affinity gel was washed with 1 mL TBS (150 mM NaCl) twice and 40 uL or 20uL of a 50% slurry of the affinity gel was then added to the lysate supernatant and incubated with rotation at 4°C for 120 min. Affinity gel was washed twice w ith wash buffer (TBS, 150 mM NaCl, 0.01% Tween-20, 0.2% fos-choline-13) and once with TBS (300 mM NaCl). Proteins were eluted by incubating with 500 ng/uL of 3XFlag peptide in TBS (300 mM NaCl) with 0.2% fos-choline-13 for 15 min at room temperature. For anti-HA immunoprecipitations, HA magnetic beads were washed with wash buffer twice and 25 uL of a 50% slurry of the magnetic beads was then added to the lysate supernatant and incubated with rotation at room temperature for 30 min. Beads were washed twice with wash buffer and once with TBS (300 mM NaCl). Proteins were eluted by incubating with 0.1M glycine, pH 2.0 with 0.2% fos-choline-13 for 10 min at room temperature. Low pH was neutralized by adding 15 uL 1M Tris, pH 8.5 for each 100 uL of eluate. For anti-GPAT4 immunoprecipitation, 50 μL of Dynabeads M-280 Sheep Anti-Rabbit IgG slurry was washed 1mL wash buffer twice and incubated with either anti-GPAT4 antibody or isotype control IgG for 1 hr with rotation at 4°C. Conjugated beads were washed twice with wash buffer and incubated with lysate supernatant for 120 min with rotation at 4°C. Beads were washed and proteins were eluted as outlined for anti-HA immunoprecipitations.
Proteomics
Following immunoprecipitation, proteins were either cleaned up by ice cold acetone precipitation (HA-GPAT4) or by running samples shortly into SDS-PAGE (FLAG-CHP1). SDS-PAGE cleaned-up samples were reduced, alkylated (10 mM DTT, 30 mM iodoacetamide, Sigma) and digested with trypsin (Shevchenko et al., 1996). Precipitated protein samples where reduced and alkylated (10 mM DTT, 40 mM iodoacetamide, Sigma), in 8 M urea and digested with Endoproteinase LysC (Wako Chemicals) and trypsin (Promega). The acidified digests were desalted (Rappsilber et al., 2007) and analyzed by reversed phase nano-LC-MS/MS using either a Fusion Lumos or a QExactive Plus (Thermo Scientific).
Data were quantified and searched against a Uniprot human database (March 2016) using ProteomeDiscoverer v. 1.4.0.288 (Thermo Scientific) combined with Mascot v. 2.5.1 (Matrix Science). Oxidation of methionine and protein N-terminal acetylation were allowed as variable modifications and all cysteines where treated as carbamidomethylated. Peptide matches were filtered using a Percolator (Käll et al., 2007), calculated false discovery rate of 1%. Contaminants are further removed by comparison to proteins in the CRAPome v1.1 (Mellacheruvu et al., 2013) with an average SC of 0.2 and above and a FLAG-GFP control immunoprecipitation. A complete list of identified peptides is provided in Table S2.
GPAT activity assay
Cell lysates were prepared as described for immunoblotting. 200 ug of each lysate was resuspended in 300 uL of assay buffer (75 mM Tris-HCl, pH 7.5, 4 mM MgCl2, 1 mg/ml fatty acid free BSA). Samples were supplemented with or without 50 uM palmitoyl-CoA as indicated. Each sample was incubated with 0.5 μCi or 10.4 μM [14C]-glycerol-3-phosphate for 30 min at 37°C. Reaction was stopped by adding 500 μL 1-butanol. After adding 800 μL of deionized water and vortexing, samples were centrifuged at 14,000 x g for 5 min at room temperature. The bottom polar layer was removed and the non-polar layer was washed with 1200 μL of butanol-saturated water. Samples were vortexed and centrifuged at 14,000 x g for 5 min at room temperature. 200 μL of the non-polar layer was mixed in scintillation vials with 5 mL of ScintiSafe Econo Cocktail (Fisher). Radioactivity was measured in a Tri-Carb 2910 Liquid Scintillation Analyzer (Perkin Elmer) and the counts per minute (cpm) for each vial were normalized by microgram of protein.
UV crosslinking with bifunctional fatty acid reporter
The bifunctional x-alk-16 was synthesized as previously described (Peng and Hang, 2015). Cells were grown in 6-well plates and incubated in regular DMEM supplemented with 2% charcoal/dextran treated fetal bovine serum (HyClone) with DMSO control or 50 μM x-alk-16 for 2 hrs at 37°C and 5% CO 2. Cell media was changed to PBS and cells were UV irradiated at 365 nm on ice for 10 min using a Spectrolinker XL-1000 UV crosslinker (Spectronics) at a distance of 3 cm.
Cells were then lysed and analyzed by immunoprecipitation for the crosslinked proteins as described above.
Statistical analysis
Sample size, mean, and significance p values are indicated in the text and figure legends. Error bars in the experiments represent standard deviation (SD) from either independent experiments or independent samples. Statistical analyses were performed using GraphPad Prism 7, or reported by the relevant computational tools.
Supplementary Material
Table S2: Proteomics data for CHP1 and GPAT4 co-immunoprecipitation, Related to Figure 4.
Table S3: Oligonucleotides used in this study, Related to STAR Methods.
KEY RESOURCES TABLE
| REAGENT or RESOURCE | SOURCE | IDENTIFIER |
|---|---|---|
| Antibodies | ||
| ACSL4/ACSL3 | GeneTex | GTX100260, RRID:AB_1240790 |
| β-ACTIN | GeneTex | GTX109639, RRID:AB_1949572 |
| CHP1 | GeneTex | GTX113936, RRID:AB_2036564 |
| GFP | Proteintech | 66002–1-Ig, RRID:AB_11182611 |
| Custom GPAT4 | This paper (YenZym) | N/A |
| GPAT3 | GeneTex | GTX87708, RRID:AB_10724633 |
| GPAT1 | GeneTex | GTX85034, RRID:AB_10721826 |
| HA | Cell Signaling | 3724, RRID:AB_1549585 |
| GNPAT | GeneTex | GTX81658, RRID:AB_11168329 |
| FLAG | Sigma | F1804, RRID:AB_262044 |
| CALNEXIN | Cell Signaling | 2679S, RRID:AB_2228381 |
| Anti-rabbit IgG, HRP-linked | Cell Signaling | 7074S, RRID:AB_2099233 |
| m-lgGK BP-HRP | Santa Cruz | sc-516102, RRID:AB_2687626 |
| Rabbit IgG, Isotype Control | Invitrogen | 026102, RRID:AB_2532938 |
| Anti-Mouse Secondary Antibody, Alexa Fluor 568 | Thermo Fisher Scientific | A10037, RRID:AB_2534013 |
| Anti-Rabbit Secondary Antibody, Alexa Fluor 488 | Thermo Fisher Scientific | A21206, RRID:AB_141708 |
| Bacterial and Virus Strains | ||
| NEB Stable Competent E. coli | NEB | C3040 |
| Chemicals, Peptides, and Recombinant Proteins | ||
| RPMI 1640 | Gibco | 11875 |
| DMEM | Gibco | 11965 |
| Trypsin | Gibco | 25200 |
| BSA Fatty Acid-free | Alfa Aesar | J64944 |
| Palmitic acid | Cayman Chemical | 10006627 |
| Arachidonic acid | Cayman Chemical | 90010 |
| Penicillin-Streptomycin | Gibco | 15140122 |
| FBS | Sigma | 12306C |
| Charcoal/Dextran Treated FBS | HyClone | SH30068 |
| Methanol | Fisher Scientific | A456 |
| Water | Fisher Scientific | W6 |
| Chloroform | Fisher Scientific | C607 |
| [U-13C16]-palmiticacid | Cambridge Isotope Laboratories | CLM-409 |
| Phusion High-Fidelity PCR Master Mix with HF Buffer | NEB | M0531 |
| BsmBI | NEB | R0580 |
| T4 DNA Ligase | NEB | M0202 |
| X-tremeGENE 9 DNA Transfection Reagent | Roche | 6365779001 |
| BamHI | NEB | R3136 |
| Notl | NEB | R3189 |
| Polybrene | Sigma | H9268 |
| Puromycin | Sigma | P8833 |
| Blasticidin | Invivogen | ant-bl |
| Fos-choline-13 | Anatrace | F310 |
| Alexa Fluor 488 Phalloidin | Invitrogen | A12379 |
| HCS LipidTOX Deep Red Neutral Lipid Stain | Invitrogen | H34477 |
| Isopropanol | Fisher Scientific | A461 |
| Oil red O | Sigma | O0625 |
| Nile red | Sigma | 72485 |
| TRIzol | Invitrogen | 15596026 |
| Fluoromount-G | Southern Biotech | 0100–01 |
| Dithiobis(succinimidyl propionate) | Thermo Fisher Scientific | 22585 |
| Anti-FLAG-M2 Affinity Gel | Sigma | A2220 |
| Pierce Anti-HA Magnetic Beads | Thermo Fisher Scientific | 88837 |
| [14C]-glycerol-3-phosphate | PerkinElmer | NEC608V050uci |
| ScintiSafe Econo Cocktail | Fisher Scientific | SX22 |
| Bifunctional x-alk-16 | (Peng and Hang, 2015) | N/A |
| SYBR Green PCR Master Mix | Applied Biosystems | 4309155 |
| Normal donkey serum | Jackson ImmunoResearch | 017-000-121 |
| Metabolomics Amino Acid Mix Standard | Cambridge Isotope Laboratories | MSK-A2–1.2 |
| XF RPMI Base medium, pH 7.4 (for seahorse) | Agilent | 103576–100 |
| Oligomycin | Sigma | 04876 |
| FCCP | Santa Cruz | sc-203578 |
| Antimycin A | MilliporeSigma | A8674–25MG |
| Dynabeads M-280 Sheep Anti-Rabbit IgG | Invitrogen | 11203D |
| Molecular Probes ER-Tracker Blue-White DPX | Invitrogen | E12353 |
| HBSS | Gibco | 14025092 |
| Fibronectin | Corning | 54008 |
| Critical Commercial Assays | ||
| CellTiter-Glo Luminescent Cell Viability Assay | Promega | G7573 |
| DNeasy Blood & Tissue Kit | Qiagen | 69506 |
| Zyppy Plasmid Miniprep Kit | Zymo Research | D4019 |
| Pierce BCA Protein Assay Kit | Thermo Fisher Scientific | 23225 |
| Superscript III First Strand Synthesis System | Invitrogen | 18080051 |
| Seahorse XF Palmitate-BSA fatty acid oxidation (FAO) Substrate | Agilent | 102720–100 |
| RNeasy Mini Kit | Qiagen | 74104 |
| Experimental Models: Cell Lines | ||
| Jurkat | ATCC | N/A |
| HeLa | ATCC | N/A |
| HepG2 | Dr. Wei Min | N/A |
| HEK293T | ATCC | N/A |
| 3T3-F442A | Dr. Paul Cohen | N/A |
| Experimental Models: Organisms/Strains | ||
| Mouse: C57BL/6J | The Jackson Laboratory | 000664 |
| Mouse: C57BL/6 | Charles River | 027 |
| C. elegans: N2 wild type | Dr. Shai Shaham | N/A |
| D. melanogaster: RNAi of white | Bloomington Drosophila Stock Center | 33623 |
| D. melanogaster: RNAi of Elm | Vienna Drosophila Stock Center | 108624 |
| D. melanogaster: Actin5C Gal4 | Bloomington Drosophila Stock Center | 3954 |
| Oligonucleotides | ||
| DNA oligonucleotides and primers | This Study | See Table S3 |
| Recombinant DNA | ||
| CRISPR Cas9 sgRNA Library | (Birsoy et al., 2015) | N/A |
| pLenti CRISPR | Addgene | 49535 |
| pLenti CRISPR V2 | Addgene | 52961 |
| pMXS-IRES-Blast | Cell Biolabs | RTV-016 |
| pSECB | (Minton et al., 2018) | N/A |
| pLenti CRISPR sgACSL4_1 | This Study | N/A |
| pLenti CRISPR sgACSL4_2 | This Study | N/A |
| pLenti CRISPR sgACSL3_1 | This Study | N/A |
| pLenti CRISPR sgACSL3_2 | This Study | N/A |
| pLenti CRISPR sgCHP1_1 | This Study | N/A |
| pLenti CRISPR sgCHP1_2 | This Study | N/A |
| pMXS-IRES-BlastACSL4 | This Study | N/A |
| pMXS-IRES-BlastACSL3 | This Study | N/A |
| pMXS-IRES-BlastCHP1 | This Study | N/A |
| pLenti CRISPR sgmCHP1_1 | This Study | N/A |
| pLenti CRISPR sgmCHP1_2 | This Study | N/A |
| pMXS-IRES-Blast FLAG-CHP1 | This Study | N/A |
| pMXS-IRES-Blast 3XFLAG-CHP1 | This Study | N/A |
| pLenti CRISPR sgGPAT4_1 | This Study | N/A |
| pLenti CRISPR sgGPAT4_2 | This Study | N/A |
| pMXS-IRES-Blast HA-GPAT4 | This Study | N/A |
| pMXS-IRES-Blast HA-GPAT4-ΔN | This Study | N/A |
| pMXS-IRES-Blast HA-GPAT4-ΔS | This Study | N/A |
| pMXS-IRES-Blast HA-GPAT4-ΔN1/2 | This Study | N/A |
| pMXS-IRES-Blast HA-GPAT4-ΔN1 | This Study | N/A |
| pMXS-IRES-Blast HA-GPAT4-ΔN2 | This Study | N/A |
| pMXS-IRES-Blast HA-GPAT4-ΔN3 | This Study | N/A |
| pMXS-IRES-Blast HA-GPAT4-ΔNs1 | This Study | N/A |
| pMXS-IRES-Blast HA-GPAT4-ΔNs2 | This Study | N/A |
| pMXS-IRES-Blast HA-GPAT4-ΔNs3 | This Study | N/A |
| pMXS-IRES-Blast HA-GPAT4-ΔNs4 | This Study | N/A |
| pMXS-IRES-Blast HA-GPAT4-ΔNs5 | This Study | N/A |
| pMXS-IRES-Blast HA-GPAT4-ΔNs6 | This Study | N/A |
| pMXS-IRES-Blast HA-GPAT4-ΔNs7 | This Study | N/A |
| pMXS-IRES-Blast HA-GPAT4-ΔNs8 | This Study | N/A |
| pMXS-IRES-Blast HA-GPAT4-ΔNs9 | This Study | N/A |
| pMXS-IRES-Blast HA-GPAT4-ΔNs10 | This Study | N/A |
| pLenti CRISPR sgGPAT3 | This Study | N/A |
| pMXS-IRES-BlastFLAG-CHP1-NES_mut | This Study | N/A |
| pMXS-IRES-BlastFLAG-CHP1-myr_mut | This Study | N/A |
| pMXS-IRES-Blast FLAG-CHP1-EF_mut | This Study | N/A |
| pMXS-IRES-BlastFLAG-CHP1-myr_EF_mut | This Study | N/A |
| pMXS-IRES-Blast3XFLAG-CHP1-myr_mut | This Study | N/A |
| pSECB sgCHPI | This Study | N/A |
| pLenti CRISPR V2 sgGNPAT_1 | This Study | N/A |
| pLenti CRISPR V2 sgGNPAT_2 | This Study | N/A |
| Other | ||
| Z2 Coulter Counter | Beckman | Model Z2 |
| SpectraMax Microplate Reader | Molecular Devices | Model M3 |
| Primovert Microscope | Carl Zeiss | 415510-1105-000 |
| REVOLVE4 Microscope | Echo Laboratories | FJSD1001 |
Highlights.
CHP1 regulates the major route of glycerolipid synthesis in mammals and invertebrates
CHP1 binds and activates GPAT4, the rate limiting enzyme of ER glycerolipid synthesis
Activation of GPAT4 requires myristoylation of CHP1
Loss of CHP1-GPAT4 complex leads to a dependency on peroxisomal lipid synthesis
Acknowledgements
We thank all members of the Birsoy Lab for helpful suggestions. We also thank Chan Hee J. Choi for assistance with adipocyte differentiation and Emmanuelle Thinon and Qiang Li for assistance with click chemistry and photocrosslinking. This research is supported by the NIH (K22CA193660 to K.B.), the Irma-Hirschl Trust (K.B.), AACR NextGen Grant (K.B.) and Robertson Therapeutic Development Fund (X.G.Z.). X.G.Z. is supported by the Center for Basic and Translational Research on Disorders of the Digestive System through the generosity of the Leona M. and Harry B. Helmsley Charitable Trust. D.K. is a Rockefeller University Women & Science Fellow of the Life Sciences Research Foundation. K.B. is a Searle Scholar, Pew-Stewart Scholar, Sidney Kimmel Scholar and Basil O’Connor Scholar of the March of Dimes.
Footnotes
Publisher's Disclaimer: This is a PDF file of an unedited manuscript that has been accepted for publication. As a service to our customers we are providing this early version of the manuscript. The manuscript will undergo copyediting, typesetting, and review of the resulting proof before it is published in its final citable form. Please note that during the production process errors may be discovered which could affect the content, and all legal disclaimers that apply to the journal pertain.
Declaration of Interests
The authors declare no competing interests.
References
- Agarwal AK, Sukumaran S, Cortés VA, Tunison K, Mizrachi D, Sankella S, Gerard RD, Horton JD, and Garg A (2011). Human 1-acylglycerol-3-phosphate O-acyltransferase isoforms 1 and 2: biochemical characterization and inability to rescue hepatic steatosis in Agpat2(−/−) gene lipodystrophic mice. J. Biol. Chem 286, 37676–37691. [DOI] [PMC free article] [PubMed] [Google Scholar]
- Alwarawrah Y, Hughes P, Loiselle D, Carlson DA, Darr DB, Jordan JL, Xiong J, Hunter LM, Dubois LG, Thompson JW, et al. (2016). Fasnall, a selective FASN inhibitor, shows potent anti-tumor activity in the MMTV-Neu model of HER2(+) breast cancer. Cell Chem. Biol 23, 678–688. [DOI] [PMC free article] [PubMed] [Google Scholar]
- Bell RM, and Coleman RA (1980). Enzymes of glycerolipid synthesis in eukaryotes. Annu. Rev. Biochem 49, 459–487. [DOI] [PubMed] [Google Scholar]
- Bird SS, Marur VR, Sniatynski MJ, Greenberg HK, and Kristal BS (2011). Serum lipidomics profiling using LC-MS and high-energy collisional dissociation fragmentation: focus on triglyceride detection and characterization. Anal. Chem 83, 6648–6657. [DOI] [PMC free article] [PubMed] [Google Scholar]
- Birsoy K, Possemato R, Lorbeer FK, Bayraktar EC, Thiru P, Yucel B, Wang T, Chen WW, Clish CB, and Sabatini DM (2014). Metabolic determinants of cancer cell sensitivity to glucose limitation and biguanides. Nature 508, 108–112. [DOI] [PMC free article] [PubMed] [Google Scholar]
- Birsoy K, Wang T, Chen WW, Freinkman E, Abu-Remaileh M, and Sabatini DM (2015). An essential role of the mitochondrial electron transport chain in cell proliferation is to enable aspartate synthesis. Cell 162, 540–551. [DOI] [PMC free article] [PubMed] [Google Scholar]
- Braverman NE, and Moser AB (2012). Functions of plasmalogen lipids in health and disease. Biochim. Biophys. Acta BBA - Mol. Basis Dis 1822, 1442–1452. [DOI] [PubMed] [Google Scholar]
- Coleman R, and Lee DP (2004). Enzymes of triacylglycerol synthesis and their regulation. Prog. Lipid Res 43, 134–176. [DOI] [PubMed] [Google Scholar]
- Datta NS, and Hajra AK (1984). Does microsomal glycerophosphate acyltransferase also catalyze the acylation of dihydroxyacetone phosphate? FEBS Lett. 176, 264–268. [DOI] [PubMed] [Google Scholar]
- Dwyer JR, Donkor J, Zhang P, Csaki LS, Vergnes L, Lee JM, Dewald J, Brindley DN, Atti E, Tetradis S, et al. (2012). Mouse lipin-1 and lipin-2 cooperate to maintain glycerolipid homeostasis in liver and aging cerebellum. Proc. Natl. Acad. Sci 109, E2486–E2495. [DOI] [PMC free article] [PubMed] [Google Scholar]
- Ericsson J, Jackson SM, Kim JB, Spiegelman BM, and Edwards PA (1997). Identification of glycerol-3-phosphate acyltransferase as an adipocyte determination and differentiation factor 1-and sterol regulatory element-binding protein-responsive gene. J. Biol. Chem 272, 7298–7305. [DOI] [PubMed] [Google Scholar]
- Farazi TA, Waksman G, and Gordon JI (2001). The biology and enzymology of protein N-myristoylation. J. Biol. Chem 276, 39501–39504. [DOI] [PubMed] [Google Scholar]
- Goldberg IJ, Trent CM, and Schulze PC (2012). Lipid metabolism and toxicity in the heart. Cell Metab. 15, 805–812. [DOI] [PMC free article] [PubMed] [Google Scholar]
- Haas JT, Miao J, Chanda D, Wang Y, Zhao E, Haas ME, Hirschey M, Vaitheesvaran B, Farese RV, Kurland IJ, et al. (2012). Hepatic insulin signaling is required for obesity-dependent expression of SREBP-1c mRNA but not for feeding-dependent expression. Cell Metab. 15, 873–884. [DOI] [PMC free article] [PubMed] [Google Scholar]
- Hajra AK, Larkins LK, Das AK, Hemati N, Erickson RL, and MacDougald OA (2000). Induction of the peroxisomal glycerolipid-synthesizing enzymes during differentiation of 3T3-L1 adipocytes. Role in triacylglycerol synthesis. J. Biol. Chem 275, 9441–9446. [DOI] [PubMed] [Google Scholar]
- Hantschel O, Nagar B, Guettler S, Kretzschmar J, Dorey K, Kuriyan J, and Superti-Furga G (2003). A myristoyl-phosphotyrosine switch regulates c-Abl. Cell 112, 845–857. [DOI] [PubMed] [Google Scholar]
- Hardwicke MA, Rendina AR, Williams SP, Moore ML, Wang L, Krueger JA, Plant RN, Totoritis RD, Zhang G, Briand J, et al. (2014). A human fatty acid synthase inhibitor binds β-ketoacyl reductase in the keto-substrate site. Nat. Chem. Biol 10, 774–779. [DOI] [PubMed] [Google Scholar]
- Henne WM, Reese ML, and Goodman JM (2018). The assembly of lipid droplets and their roles in challenged cells. EMBO J. 37, e98947. [DOI] [PMC free article] [PubMed] [Google Scholar]
- Henneberry AL, and McMaster CR (1999). Cloning and expression of a human choline/ethanolaminephosphotransferase: synthesis of phosphatidylcholine and phosphatidylethanolamine. Biochem. J 339, 291–298. [PMC free article] [PubMed] [Google Scholar]
- Hu C, van Dommelen J, van der Heijden R, Spijksma G, Reijmers TH, Wang M, Slee E, Lu X, Xu G, van der Greef J, et al. (2008). RPLC-ion-trap-FTMS method for lipid profiling of plasma: method validation and application to p53 mutant mouse model. J. Proteome Res 7, 4982–4991. [DOI] [PubMed] [Google Scholar]
- Käll L, Canterbury JD, Weston J, Noble WS, and MacCoss MJ (2007). Semi-supervised learning for peptide identification from shotgun proteomics datasets. Nat. Methods 4, 923–925. [DOI] [PubMed] [Google Scholar]
- Kamath RS, Martinez-Campos M, Zipperlen P, Fraser AG, and Ahringer J (2000). Effectiveness of specific RNA-mediated interference through ingested double-stranded RNA in Caenorhabditis elegans. Genome Biol. 2, 1–10. [DOI] [PMC free article] [PubMed] [Google Scholar]
- Kemiläinen H, Adam M, Mäki-Jouppila J, Damdimopoulou P, Damdimopoulos AE, Kere J, Hovatta O, Laajala TD, Aittokallio T, Adamski J, et al. (2016). The hydroxysteroid (17β) dehydrogenase family gene HSD17B12 is involved in the prostaglandin synthesis pathway, the ovarian function, and regulation of fertility. Endocrinology 157, 3719–3730. [DOI] [PubMed] [Google Scholar]
- Klett EL, Chen S, Yechoor A, Lih FB, and Coleman RA (2017). Long-chain acyl-CoA synthetase isoforms differ in preferences for eicosanoid species and long-chain fatty acids. J. Lipid Res 58, 884–894. [DOI] [PMC free article] [PubMed] [Google Scholar]
- Kuhajda FP, Aja S, Tu Y, Han WF, Medghalchi SM, El Meskini R, Landree LE, Peterson JM, Daniels K, Wong K, et al. (2011). Pharmacological glycerol-3-phosphate acyltransferase inhibition decreases food intake and adiposity and increases insulin sensitivity in diet-induced obesity. Am. J. Physiol.-Regul. Integr. Comp. Physiol 301, R116–R130. [DOI] [PMC free article] [PubMed] [Google Scholar]
- Kusminski CM, Shetty S, Orci L, Unger RH, and Scherer PE (2009). Diabetes and apoptosis: lipotoxicity. Apoptosis 14, 1484–1495. [DOI] [PubMed] [Google Scholar]
- Lewin TM, de Jong H, Schwerbrock NJM, Hammond LE, Watkins SM, Combs TP, and Coleman RA (2008). Mice deficient in mitochondrial glycerol-3-phosphate acyltransferase-1 have diminished myocardial triacylglycerol accumulation during lipogenic diet and altered phospholipid fatty acid composition. Biochim. Biophys. Acta BBA - Mol. Cell Biol. Lipids 1781, 352–358. [DOI] [PMC free article] [PubMed] [Google Scholar]
- Lin X, and Barber DL (1996). A calcineurin homologous protein inhibits GTPase-stimulated Na-H exchange. Proc. Natl. Acad. Sci 93, 12631–12636. [DOI] [PMC free article] [PubMed] [Google Scholar]
- Listenberger LL, Han X, Lewis SE, Cases S, Farese RV, Ory DS, and Schaffer JE (2003). Triglyceride accumulation protects against fatty acid-induced lipotoxicity. Proc. Natl. Acad. Sci 100, 3077–3082. [DOI] [PMC free article] [PubMed] [Google Scholar]
- Liu D, Nagan N, Just WW, Rodemer C, Thai T-P, and Zoeller RA (2005). Role of dihydroxyacetonephosphate acyltransferase in the biosynthesis of plasmalogens and nonether glycerolipids. J. Lipid Res 46, 727–735. [DOI] [PubMed] [Google Scholar]
- Liu Q, Bengmark S, and Qu S (2010). The role of hepatic fat accumulation in pathogenesis of non-alcoholic fatty liver disease (NAFLD). 9. [DOI] [PMC free article] [PubMed] [Google Scholar]
- Masuda M, Miyazaki-Anzai S, Keenan AL, Okamura K, Kendrick J, Chonchol M, Offermanns S, Ntambi JM, Kuro-o M, and Miyazaki M (2015). Saturated phosphatidic acids mediate saturated fatty acid–induced vascular calcification and lipotoxicity. J. Clin. Invest 125, 4544–4558. [DOI] [PMC free article] [PubMed] [Google Scholar]
- Mellacheruvu D, Wright Z, Couzens AL, Lambert J-P, St-Denis NA, Li T, Miteva YV, Hauri S, Sardiu ME, Low TY, et al. (2013). The CRAPome: a contaminant repository for affinity purification–mass spectrometry data. Nat. Methods 10, 730–736. [DOI] [PMC free article] [PubMed] [Google Scholar]
- Mendoza-Ferreira N, Coutelier M, Janzen E, Hosseinibarkooie S, Löhr H, Schneider S, Milbradt J, Karakaya M, Riessland M, Pichlo C, et al. (2018). Biallelic CHP1 mutation causes human autosomal recessive ataxia by impairing NHE1 function. Neurol. Genet 4, e209. [DOI] [PMC free article] [PubMed] [Google Scholar]
- Meyers RM, Bryan JG, McFarland JM, Weir BA, Sizemore AE, Xu H, Dharia NV, Montgomery PG, Cowley GS, Pantel S, et al. (2017). Computational correction of copy number effect improves specificity of CRISPR–Cas9 essentiality screens in cancer cells. Nat. Genet 49, 1779–1784. [DOI] [PMC free article] [PubMed] [Google Scholar]
- Minton DR, Nam M, McLaughlin DJ, Shin J, Bayraktar EC, Alvarez SW, Sviderskiy VO, Papagiannakopoulos T, Sabatini DM, Birsoy K, et al. (2018). Serine catabolism by SHMT2 is required for proper mitochondrial translation initiation and maintenance of formylmethionyl-tRNAs. Mol. Cell 69, 610–621.e5. [DOI] [PMC free article] [PubMed] [Google Scholar]
- Mitchell AG, and Martin CE (1995). A novel cytochrome b5-like domain is linked to the carboxyl terminus of the Saccharomyces cerevisiae delta-9 fatty acid desaturase. J. Biol. Chem 270, 29766–29772. [DOI] [PubMed] [Google Scholar]
- Pagac M, Cooper DE, Qi Y, Lukmantara IE, Mak HY, Wu Z, Tian Y, Liu Z, Lei M, Du X, et al. (2016). SEIPIN regulates lipid droplet expansion and adipocyte development by modulating the activity of glycerol-3-phosphate acyltransferase. Cell Rep. 17, 1546–1559. [DOI] [PMC free article] [PubMed] [Google Scholar]
- Peng T, and Hang HC (2015). Bifunctional fatty acid chemical reporter for analyzing S-palmitoylated membrane protein-protein interactions in mammalian cells. J. Am. Chem. Soc 137, 556–559. [DOI] [PMC free article] [PubMed] [Google Scholar]
- Peterson TR, Sengupta SS, Harris TE, Carmack AE, Kang SA, Balderas E, Guertin DA, Madden KL, Carpenter AE, Finck BN, et al. (2011). mTOR complex 1 regulates lipin 1 localization to control the SREBP pathway. Cell 146, 408–420. [DOI] [PMC free article] [PubMed] [Google Scholar]
- Piccolis M, Bond L, Kampmann M, Pulimeno P, Chitraju C, Jayson C, Lai ZW, Elliott S, Weissman J, Walther T, et al. Probing the global cellular responses to lipotoxicity caused by saturated fatty acids. Mol. Cell 74. [DOI] [PMC free article] [PubMed] [Google Scholar]
- Pompeia C, Freitas JJ., Kim JS, Zyngier SB, and Curi R (2002). Arachidonic acid cytotoxicity in leukocytes: implications of oxidative stress and eicosanoid synthesis. Biol. Cell 94, 251–265. [DOI] [PubMed] [Google Scholar]
- Rappsilber J, Mann M, and Ishihama Y (2007). Protocol for micro-purification, enrichment, prefractionation and storage of peptides for proteomics using StageTips. Nat. Protoc 2, 1896–1906. [DOI] [PubMed] [Google Scholar]
- Rual J-F, Ceron J, Koreth J, Hao T, Nicot AS, Hirozane-Kishikawa T, Vandenhaute J, Orkin SH, Hill DE, van den Heuvel S, et al. (2004). Toward improving Caenorhabditis elegans phenome mapping with an ORFeome-based RNAi library. Genome Res. 14, 2162–2168. [DOI] [PMC free article] [PubMed] [Google Scholar]
- Samuel VT, Petersen KF, and Shulman GI (2010). Lipid-induced insulin resistance: unravelling the mechanism. The Lancet 375, 2267–2277. [DOI] [PMC free article] [PubMed] [Google Scholar]
- Shan D, Li J, Wu L, Li D, Hurov J, Tobin JF, Gimeno RE, and Cao J (2010). GPAT3 and GPAT4 are regulated by insulin-stimulated phosphorylation and play distinct roles in adipogenesis. J. Lipid Res 51, 1971–1981. [DOI] [PMC free article] [PubMed] [Google Scholar]
- Shen Y, Xu F, Wei L, Hu F, and Min W (2014). Live-cell quantitative imaging of proteome degradation by stimulated Raman scattering. Angew. Chem. Int. Ed 53, 5596–5599. [DOI] [PMC free article] [PubMed] [Google Scholar]
- Shen Y, Zhao Z, Zhang L, Shi L, Shahriar S, Chan RB, Di Paolo G, and Min W (2017). Metabolic activity induces membrane phase separation in endoplasmic reticulum. Proc. Natl. Acad. Sci 114, 13394–13399. [DOI] [PMC free article] [PubMed] [Google Scholar]
- Shevchenko A, Wilm M, Vorm O, and Mann M (1996). Mass spectrometric sequencing of proteins silver-stained polyacrylamide gels. Anal. Chem 68, 850–858. [DOI] [PubMed] [Google Scholar]
- Taguchi R, and Ishikawa M (2010). Precise and global identification of phospholipid molecular species by an Orbitrap mass spectrometer and automated search engine Lipid Search. J. Chromatogr. A 1217, 4229–4239. [DOI] [PubMed] [Google Scholar]
- Van Horn CG, Caviglia JM, Li LO, Wang S, Granger DA, and Coleman RA (2005). Characterization of recombinant long-chain rat acyl-CoA synthetase isoforms 3 and 6: identification of a novel variant of isoform 6. Biochemistry 44, 1635–1642. [DOI] [PubMed] [Google Scholar]
- Wang T, Wei JJ, Sabatini DM, and Lander ES (2014). Genetic screens in human cells using the CRISPR-Cas9 system. Science 343, 80–84. [DOI] [PMC free article] [PubMed] [Google Scholar]
- Wang T, Yu H, Hughes NW, Liu B, Kendirli A, Klein K, Chen WW, Lander ES, and Sabatini DM (2017). Gene essentiality profiling reveals gene networks and synthetic lethal interactions with oncogenic Ras. Cell 168, 890–903.e15. [DOI] [PMC free article] [PubMed] [Google Scholar]
- Wendel AA, Lewin TM, and Coleman RA (2009). Glycerol-3-phosphate acyltransferases: Rate limiting enzymes of triacylglycerol biosynthesis. Biochim. Biophys. Acta BBA - Mol. Cell Biol. Lipids 1791, 501–506. [DOI] [PMC free article] [PubMed] [Google Scholar]
- Wendel AA, Cooper DE, Ilkayeva OR, Muoio DM, and Coleman RA (2013). Glycerol-3-phosphate acyltransferase (GPAT)-1, but not GPAT4, incorporates newly synthesized fatty acids into triacylglycerol and diminishes fatty acid oxidation. J. Biol. Chem 288, 27299–27306. [DOI] [PMC free article] [PubMed] [Google Scholar]
- Williams KJ, Argus JP, Zhu Y, Wilks MQ, Marbois BN, York AG, Kidani Y, Pourzia AL, Akhavan D, Lisiero DN, et al. (2013). An essential requirement for the SCAP/SREBP signaling axis to protect cancer cells from lipotoxicity. Cancer Res. 73, 2850–2862. [DOI] [PMC free article] [PubMed] [Google Scholar]
- Yamada T, Uchikata T, Sakamoto S, Yokoi Y, Fukusaki E, and Bamba T (2013). Development of a lipid profiling system using reverse-phase liquid chromatography coupled to high-resolution mass spectrometry with rapid polarity switching and an automated lipid identification software. J. Chromatogr. A 1292, 211–218. [DOI] [PubMed] [Google Scholar]
- Yu J, Loh K, Song Z, Yang H, Zhang Y, and Lin S (2018). Update on glycerol-3-phosphate acyltransferases: the roles in the development of insulin resistance. Nutr. Diabetes 8. [DOI] [PMC free article] [PubMed] [Google Scholar]
- Zhang C, Cooper DE, Grevengoed TJ, Li LO, Klett EL, Eaton JM, Harris TE, and Coleman RA (2014). Glycerol-3-phosphate acyltransferase-4-deficient mice are protected from diet-induced insulin resistance by the enhanced association of mTOR and rictor. Am. J. Physiol.-Endocrinol. Metab 307, E305–E315. [DOI] [PMC free article] [PubMed] [Google Scholar]
Associated Data
This section collects any data citations, data availability statements, or supplementary materials included in this article.
Supplementary Materials
Table S2: Proteomics data for CHP1 and GPAT4 co-immunoprecipitation, Related to Figure 4.
Table S3: Oligonucleotides used in this study, Related to STAR Methods.