

Abstract
Cooperation is a major factor in the evolution of human societies. The structure of social networks, which affects the dynamics of cooperation and other interpersonal phenomena, have common structural signatures. One of these signatures is the tendency to organize as groups. This tendency gives rise to networks with community structure, which are composed of distinct modules. In this paper, we study analytically the evolutionary game dynamics on large modular networks in the limit of weak selection. We obtain novel analytical conditions such that natural selection favours cooperation over defection. We calculate the transition point for each community to favour cooperation. We find that a critical inter-community link creation probability exists for given group density, such that the overall network supports cooperation even if individual communities inhibit it. As a byproduct, we present solutions for the critical benefit-to-cost ratio which perform with remarkable accuracy for diverse generative network models, including those with community structure and heavy-tailed degree distributions. We also demonstrate the generalizability of the results to arbitrary two-player games.
Keywords: networks, cooperation, evolutionary game theory, community structure
1. Introduction
Cooperation is a central tenet of social life of many species. When individuals cooperate, they pay a cost to help one another. The dynamics of interpersonal cooperation is affected by the structure of social networks, which characterize patterns of interpersonal interaction and exchange [1–5]. The problem of cooperation is also widely studied in mathematical and physical sciences [6]. In this paper, we focus on a particular feature of social networks, namely, community structure. This structural feature is ubiquitous in social networks, and is associated with a tendency of societies to organize as modules, or communities, with disparate intergroup and intragroup connectivity [7]. Community structure is measured and studied in many species, such as dolphins [8], chimpanzees [9], macaques [10], sharks [11], various pollinator species [12] and even relatively solitary species such as desert tortoise [13]. Community structure regulates the interpersonal connections and thereby affects the dynamical processes taking place on social networks. For example, the presence of community structure affects the epidemic spreading of infectious disease for various animal species [14]. Networks with high modularity buffer the spread of ecological perturbation impact across the whole population [15]. Also in the social life of humans, community structure is shown to promote the spread of health behaviours [16] and the diffusion of information online [17]. The effect of community structure on cooperative dynamics has also been studied under diverse simulation settings and modelling assumptions [18–21]. Here we aim to provide the first analytical results to study the effect of community structure on the evolution of cooperation. We first introduce a potent approximation framework which, as we shall demonstrate, performs with remarkable accuracy for a wide array of network models with diverse properties, including heavy-tailed degree distributions, small-world properties, varying levels of clustering and community structure. We use this framework to put in crisp focus a standard generative network model, namely, the stochastic block model (SBM). We provide an explicit solution for the conditions such that natural selection favours cooperation, and then generalize the results to any 2 × 2 evolutionary game.
2. Model of social interactions
We use the framework of evolutionary graph theory [1]. We consider a generic two-player game with two available strategies, denoted by C and D. Both players receive R if they mutually choose C, and receive P if they mutually choose D. If one player chooses C and the other chooses D, the C-player receives S and the D-player receives T. The strategy of node x is denoted by sx ∈ {0, 1}, where 1 corresponds to strategy C and 0 to strategy D. We denote the set of network neighbours of node x by . We consider averaged pay-offs, where the pay-off of node x with degree kx is given by
| 2.1 |
At each time step, a random individual is chosen to update its strategy via copying that of a neighbour. The probability that neighbour x is copied is proportional to 1 + δfx, where fx is the pay-off of x and 0 < δ ≪ 1 models the selection strength, that is, higher δ indicates stronger social learning via observing the pay-off of peers. The case δ = 0 is equivalent to the voter model [22–24]. The weak-selection limit considered here can be viewed as the first-order correction to the voter model. We seek an analytical condition such that natural selection favours the fixation of C over fixation of D. According to the structure coefficient theorem [25], this happens if (R − P)σ > (T − S), where σ is the structure coefficient, which is independent of the game and only depends on the network structure. Thus, it suffices to calculate σ for the given network. This can be done exactly by considering a mathematical equivalence between the evolutionary game dynamics and that of coalescing random walks [26]. Below we highlight the high computational cost of this method for large networks, propose a mean-field approximation to ameliorate the situation for large networks, and use it to obtain remarkably accurate solutions for networks with community structure. We also explain the referent of the term ‘mean-field’ in the proposed solution.
3. General framework
To obtain σ for generic 2 × 2 games, we apply the methodology of [26] to unweighted undirected graphs. We analyse the ‘donation game’ version of the Prisoner’s Dilemma, with R = b − c, S = −c, T = b and P = 0 and later discuss how σ can be derived from the results. For notational brevity, we set c = 1 without loss of generality. This choice is simply equivalent to a rescaling of every pay-off value. We shall discuss how the results for generic c can be readily obtained from provided results. The pay-off of node x is
| 3.1 |
For the update of node x, we have
| 3.2 |
The first term on the right-hand side corresponds to the event that node x is not chosen to update its strategy. The second term corresponds to the expected value of sx conditional upon node x having been chosen to update. In the limit of weak selection, expanding to the first order of δ after multiplying both sides by kx, we get
| 3.3 |
Now we define . Summing (3.3) over all nodes, we see that in the zeroth-order dynamics of the system (i.e. δ = 0, corresponding to the voter model), the expected value of ψ(t) is a conserved quantity [22,24,27]. The fixation probability can be obtained by equating the average value of ψ over every initial mutant placement with its expected value as t → ∞. The expected first-order change of ψ is
| 3.4 |
Exchanging the summation order, denoting the first moment of the degree distribution (the average degree) by μ1, we get
| 3.5 |
We need to sum up these expected increments from t = 0 up to t = ∞. Let ξx denote this expected total change for given initial condition in which only node x is C and all other nodes are D. The fixation probability for a given initial condition will then be (kx + ξx)/(Nμ1). Averaging over all nodes, this becomes
| 3.6 |
The sum on the right-hand side of (3.6) requires the calculation of temporal sum of the spin products on the right-hand side of (3.5). Note that these summations are to be performed in the voter-model regime. That is, due to the factor δ, we should only keep the summations in zeroth order. In [26,28], it is shown that for any two nodes i and j, if we find the expected temporal sum of 1/N − si sj from t = 0 to t = ∞ under the voter-model dynamics and then average this sum over all single-node initial placements, the result is equal to τij/(2N), where τij is the expected meeting time of two random walkers initiated at nodes i and j. These meeting times follow the following recurrence relation:
| 3.7 |
Thus, the random walk equivalence relates the fixation probability to the expected value of the meeting times of two random walkers initiated one, two and three steps away on the network, corresponding to the three last terms on the right-hand side of (3.5), respectively. Note that the expression ‘ℓ steps away’ here refers to random-walk steps, rather than graph distance. So, for example, node y is ℓ steps away from node x if , where Aℓ is the ℓth power of the adjacency matrix. Using the meeting times which are the solutions to the system of equations (3.7), we define the quantity τx as the expected remeeting time of two random walkers both initiated at node x:
| 3.8 |
We also define . Using these definitions, and after some algebraic simplifications, the fixation probability can be expressed in the following form:
| 3.9 |
If we repeat the analysis for the fixation of D, we get the same result as (10), with the sign of the first-order term flipped. Setting ρC > ρD, we arrive at the condition such that natural selection favours the fixation of C over D. This outcome occurs if we have b > b*, where b* is the critical benefit-to-cost ratio and is given by
| 3.10 |
The result for generic c is readily obtained by replacing b in the above equation by (b/c). For any value of b/c below this value, natural selection favours defection over cooperation. Moreover, if the value of (b/c)* for a given network turns out to be negative, this means that natural selection favours defection over cooperation regardless of b and c. This network version of the tragedy of the commons would be unsalvageable via modification of the pay-off structure. Below we discuss an example in which cooperation can be rescued by structural intervention instead, that is, by bridging individually uncooperative networks together.
4. Large networks: mean-field approximation
The drawback of this exact framework is that solving (3.7) requires solving a system of N(N − 1)/2 linear equations, which can be infeasible for large networks. The conventional Cholesky decomposition methods to solve this system have the complexity of order N6, and faster techniques often require sparsity. So for large networks in general, obtaining the exact solution is computationally infeasible. To obviate this limitation, here we seek a mean-field approximation to obtain analytical results that are computationally feasible for large networks. We use the fact that, combining (3.8) and (3.7), the remeeting times of these random walkers satisfy the following equation:
| 4.1 |
Using this equation and assuming a mean-field approximation in which every τx value is replaced by the average value over all x, we obtain
| 4.2 |
where μ2 is the second moment of the degree distribution. This substitution of the τx values with their mean is the rationale behind the term ‘mean-field’ we employed, which is conventional in the mathematical literature of evolutionary games [2]. For the mean-field approximation of the fixation probability, we plug this into (2.9) and obtain:
| 4.3 |
Noting that is equal to N for any network, we obtain
| 4.4 |
Plugging this result into (3.10), we arrive at the critical benefit-to-cost ratio above which natural selection favours cooperation over defection:
| 4.5 |
Note that the previous approximations in the literature can be obtained as limiting cases. If the variance of the degree distribution is small, we can expand equation (4.5) in terms of the degree variance:
| 4.6 |
If we assume that the graph is regular with degree μ1 (that is, all nodes have degree μ1), then the first term on the right-hand side of (4.6) is equivalent to existing results in the biological literature for the special case of bi-transitive graphs [29]. This also indicates that the error of using the result of [29] for heterogeneous (i.e. non-regular) graphs increases when network density is close to 1/2. If in addition to small variance, we take the limit of large N, the right-hand side of equation (16) tends to μ1. Thus, we recover the well-known b/c > k rule in the literature for large regular graphs [30].
5. Networks with community structure
A common analytical model to generate networks with community structure and to perform community detection is the SBM [31–33]. Here we study analytically the evolution of cooperation on SBM networks, and then extend the results to arbitrary symmetric 2 × 2 games.
We consider a SBM [31,32] with m equi-probable groups, intra-community link probability p and inter-community link probability q. In this model, for each node, the probability of being assigned to either of the m communities is assumed to be the same. For node x with degree kx, denote the number of within-community neighbours by and denote the number of its neighbours in other communities by . For large N, the average degree μ1, which is the expected value of kx, is
| 5.1 |
Also because the inter- and intra-community degree distributions are independent, the variance of k is the sum of the variance of and the variance of :
| 5.2 |
Note that in SBM networks, although the assignment probabilities are uniform, this does not indicate homogeneous community size. The expected value of community sizes are the same, but at each realization of SBM networks, the community sizes are not necessarily the same. The probability of having m communities with identical size tends to zero as N increases for any m > 1. Combining (5.1) and (5.2), we obtain μ2, which we can insert into (4.4) to obtain the fixation probability. For the critical benefit-to-cost ratio, we insert the expression for μ2 and μ1 into (4.5). Defining α: = 1/m and β: = 1 − 1/m for brevity, and after algebraic simplifications, we obtain
| 5.3 |
Figure 1 demonstrates that the approximation (5.3) has relative error less than 1% for network size as small as 40. In these network sizes, the exact method can be employed in reasonable time, and thereby we have a benchmark to assess the solutions. Figure 1 demonstrates that for large networks, the error rate is remarkably small. So for large networks where the exact method becomes prohibitively costly, the mean-field approximation can be used to produce accurate results.
Figure 1.
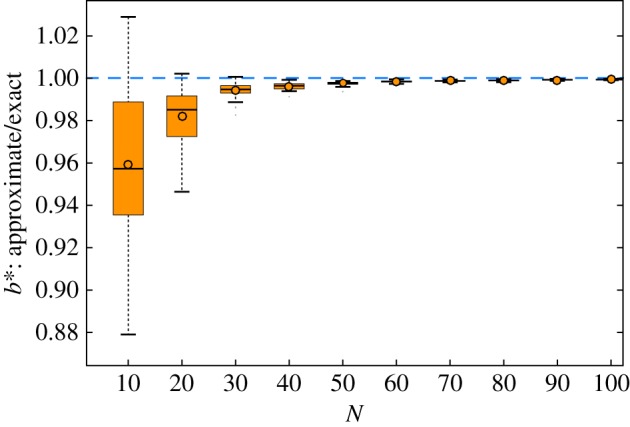
Accuracy of the proposed mean-field approximation for b* as a function of N. The network generation parameters are set to the example values of p = 0.7, q = 0.1 and m = 3. The performance is consistently good for every parameter configuration tried, which will be demonstrated in figure 3. (Online version in colour.)
The special case of p = q is equivalent to the Erdős–Rényi (ER) model [34]. Equivalently, we can set m = 1. In this special case, equation (5.3) simplifies to
| 5.4 |
Figure 2a illustrates the accuracy of the proposed mean-field approximation (5.4) for ER networks. We plot 1/b* instead of b* for better visualization. Equation (5.4) indicates a phase transition at ; visible in figure 2a. That is, in the ER model, the expected critical benefit-to-cost ratio becomes negative if . In this regime, natural selection favours fixation of D over C for any benefit-to-cost ratio.
Figure 2.
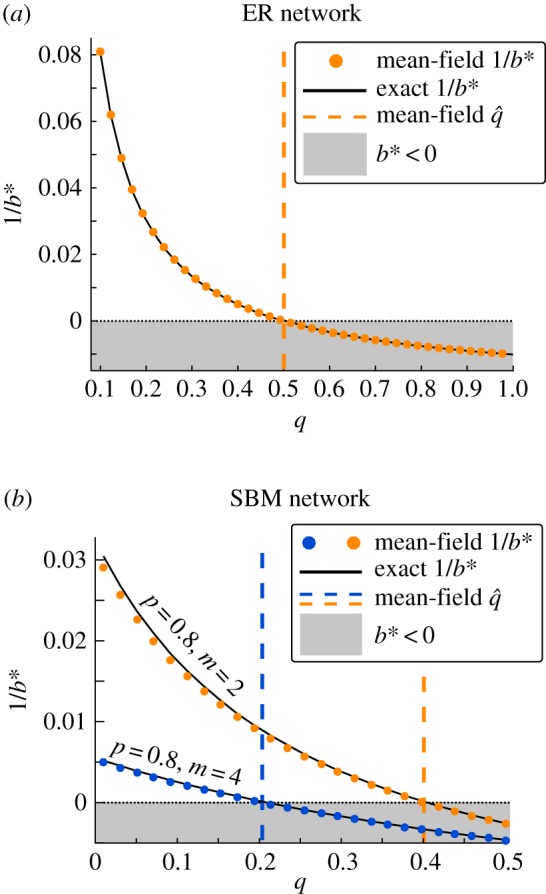
(a) Accuracy of the proposed mean-field approximation for b* for ER networks as a function of link creation probability p. As predicted by (5.4), there is a phase transition at . That is, above , there is a different cooperative phase: natural selection does not favour cooperation over defection regardless of the benefit-to-cost ratio. The mean-field prediction is in agreement with the exact results. (b) Accuracy of the proposed mean-field approximation for b*. The network size is 100. The dashed lines depict the predicted threshold value as given by (5.5), agrees with the exact results, for example, parameter settings. For , natural selection promotes fixation of defection over cooperation regardless of the benefit-to-cost ratio. The intercepts match the result for lim q → 0+ obtained in (5.6). (Online version in colour.)
For the general case of p ≠ q, too, we can find such a point of transition. We can find (the critical inter-community link probability above which natural selection favours fixation of D over C for any benefit-to-cost ratio) by setting the denominator of (5.3) equal to zero and solving the resulting quadratic equation for q. Expanding the solution for large N, we obtain
| 5.5 |
This result has an important consequence. Each of the m communities with intra-community link probability p, considered separately, is an ER network. So the expected value of the critical benefit-to-cost ratio for each of them is given by (5.4). Suppose the communities have p > 1/2, which, as discussed above, means that cooperation is not favoured by natural selection for each individual community considered separately. We can then interconnect these communities under the SBM setting, with inter-community probability q. For , the critical benefit-to-cost ratio of the overall network is positive, despite individual communities inhibiting the fixation of cooperation. This confirms analytically the numerical observations about conjoining random networks [35].
In figure 2b, we present the comparison of (5.3) with the exact results. The orange markers pertain to the example case of m = 4 and p = 0.8, for which (5.3) gives . The blue markers pertain to m = 2 and p = 0.8, with . The network size is 100 in both cases. The approximations are remarkably close to the exact values.
Of particular relevance for actual scenarios is the case where q ≪ 1, which means that the communities are sparsely interconnected. In this regime, we can expand b* as follows:
| 5.6 |
The interesting result here is the existence of the zeroth-order term. This fact can be seen in figure 2b as well. For N = 100, p = 0.8 with m = 2, from (23) we get b* ≈ 200, and with m = 4 we get b* ≈ 32.9. The inverse of these values are 0.0050 and 0.030, respectively, which correctly match the intercepts observed in figure 2b. This confirms that in the limit as q → 0+, b* tends to a positive number. Thus, sparse interconnection of dense communities rescues cooperation. Note that this happens as long as the whole network is connected, so that b* is well defined. If q is exactly zero, the network will be segregated into disjoint components separated off, where b* cannot be defined. So q can be as small as to ensure graph connectedness, but no smaller. The minimum value of q such that the whole network is connected asymptotically approaches zero as N tends to infinity. These results are conceptually consistent with the findings in the social sciences which underscore the important role of structural holes and boundary spanners [35,36]. Nodes that function as network brokers connect the segregated patches of the network together and thereby facilitate collective cooperation. Broker nodes that were previously trapped in closed circles surrounded by defectors can now connect to nodes outside this circle, allowing cooperation to flow between clusters.
6. Extension of results
6.1. Extension to any game
Returning to arbitrary 2 × 2 games, according to the structure coefficient theorem, the structure coefficient is defined in terms of b* as follows:
| 6.1 |
For the special case of SBM or ER networks, σ can be obtained readily by inserting the corresponding values of b* from equations (5.3) and (5.4) into (6.1), respectively. For general networks, we use the mean-field value for b* obtained in (4.5). The result simplifies to
| 6.2 |
Natural selection favours the fixation of C over the fixation of D if (R − P)σ > (T − S). Thus, we have obtained analytical conditions such that natural selection favours the fixation of one strategy over the other for any 2 × 2 game.
6.2. Extension to other network families
We conclude by highlighting the accuracy of the proposed mean-field approximation for b* via simulations and numerical results for other network families besides SBM and ER. In figure 3, we plot the histogram of the ratio of the approximate b* to the exact value (computed via solving the system of N(N − 1)/2 linear equations as given by (3.7)) for 10 different network families. Besides SBM and ER, we consider the small-world model [37], and seven other network generation families, which all generate networks with heavy-tailed degree distribution. We use these additional seven families as pessimistic scenarios regarding our mean-field approximation, because these models generate highly heterogeneous networks. For the SBM model, we chose m uniformly from {2, 3, 4, 5}, p uniformly in [0.1, 1], and q uniformly in [0.01, p]. For the small-world model [37], we chose the initial lattice degree uniformly from ×{4, 8, 12} and the link creation probability uniformly from [0, 0.1]. For ER networks, we chose the link formation probability uniformly in [0.2, 1]. For preferential attachment (PA) with linear kernel [38,39], we randomly generate m between 1 and 5, and the kernel bias is generated randomly between 0 and 5. For the scale-free model of Holme & Kim [40], we chose the triad formation probability of the model uniformly in [0, 1]. For Klemm–Eguiluz scale-free model [41], we choose the cross-over probability parameter of the model uniformly in [0, 1]. For both models, we choose the number of initial connections of incoming nodes uniformly between 1 and 5. For the spatial scale-free model of Barthelemy [42] (SSL), we generated networks on a two-dimensional lattice with distance decay parameter rc chosen uniformly in [0, 0.2]. For the uncorrelated configuration model [43], we chose the minimum number of connections uniformly between 1 and 5, and the exponent in the power-law degree distribution is chosen uniformly in [1, 4]. For super-linear preferential attachment [39] (PA:SL), where the attachment kernel depends on degrees as kθ, we chose the number of initial connections of incoming nodes uniformly between 1 and 4, and the exponent of the kernel uniformly in [0, 3]. Greater exponents produce networks with higher degree inequality. We also test the results on the LFR model [44], which is another conventional generative model for networks with community structure, besides SBM. Mathematical and statistical studies of networks involving community structure, such as those of inference and sampling, predominantly use the SBM model and its variants for analytical treatment. The usage of LFR models are comparatively more inclined towards simulations and numerical experiments. So in this section, we have also included LFR benchmarks in this paper for the sake of completeness and to confirm the reasonable performance of the proposed solution on alternative network families with community structure. The are generated with the mixing parameter chosen uniformly at random in [0, 1]. The maximum degree kmax was chosen uniformly between 1 and N − 1, the average degree was chosen uniformly between 1 and kmax, the degree exponent was uniformly in [0, 3], the exponent for the community size distribution was chosen uniformly in [0, 2]. We required that no community has less than 5% of the nodes, which also automatically introduces the cap N[1 − 0.05 (m − 1)] on the maximum community size. For each family, we generate 10 000 networks. For every generated network, the size is randomly chosen between 100 and 500, which is reasonably small so that the exact results could be feasibly calculated via solving (3.7). The histograms are highly concentrated around unity, which confirms the accuracy of the proposed mean-field approximations. Interestingly, the proposed approximation works well for networks with high structural heterogeneity, including those with heavy-tailed degree distributions.
Figure 3.

The distribution of the ratio of the proposed mean-field approximation to the true value of b*. The true value is obtained by solving the N(N − 1)/2 linear equations as given by (3.7), which is infeasible for very large networks, but feasible for the size ranges of the test networks. The 10 network generation families are discussed in the text. Two example graphs with high heterogeneity are depicted to highlight the robustness of the proposed mean-field approximation to structural heterogeneity. By ‘heterogeneity’, we mean that the network properties of the nodes are different, as apposed to a regular network, such as a ring, in which every node exhibits similar structural properties. (Online version in colour.)
7. Discussion
We presented accurate mean-field solutions for 2 × 2 games on heterogeneous networks that determine which strategy is favoured by natural selection. We have considered the limit of weak selection, which is amenable to analytical treatment. For general selection strength, the problem is shown to be NP-hard [45]. We have used our solution to study the case of modular networks in detail, and have uncovered a network-structural phase transition which pertains to regions in which one of the strategies will not be favoured by natural selection regardless of the pay-off parameters. We have obtained similar results for ER networks as a special case. We have obtained analytical expressions for the inter-connection of segregated communities, which individually inhibit cooperation, but after interconnection, can collectively favour cooperation. This result in agreement with the previous results in the literature [18,20], which obtain qualitatively similar results via various updating schemes and simulation parameters, and even those that consider many-player games [19]. Our analytical findings together with the previous simulation studies consistently highlight the cooperative advantage of sparsely interconnecting dense communities, and indicate that this advantage is a robust feature of cooperative dynamics on networks, which has notable real-world consequences.
Data accessibility
This article has no additional data.
Authors' contributions
All authors contributed to all aspects of the paper.
Competing interests
The authors declare no competing interests.
Funding
This work was supported by a grant from the James S. McDonnell Foundation (N.M.), NSF grant no. 1715315 (B.A.) and the John Templeton Foundation (M.A.N.).
References
- 1.Lieberman E, Hauert C, Nowak MA. 2005. Evolutionary dynamics on graphs. Nature 433, 312–316. ( 10.1038/nature03204) [DOI] [PubMed] [Google Scholar]
- 2.Szabó G, Fath G. 2007. Evolutionary games on graphs. Phys. Rep. 446, 97–216. ( 10.1016/j.physrep.2007.04.004) [DOI] [Google Scholar]
- 3.Perc M, Gómez-Gardeñes J, Szolnoki A, Floría LM, Moreno Y. 2013. Evolutionary dynamics of group interactions on structured populations: a review. J. R. Soc. Interface 10, 20120997 ( 10.1098/rsif.2012.0997) [DOI] [PMC free article] [PubMed] [Google Scholar]
- 4.Perc M, Szolnoki A. 2010. Coevolutionary games—a mini review. BioSystems 99, 109–125. ( 10.1016/j.biosystems.2009.10.003) [DOI] [PubMed] [Google Scholar]
- 5.Simpson B, Willer R. 2015. Beyond altruism: sociological foundations of cooperation and prosocial behavior. Ann. Rev. Sociol. 41, 43–63. ( 10.1146/annurev-soc-073014-112242) [DOI] [Google Scholar]
- 6.Perc M, Jordan JJ, Rand DG, Wang Z, Boccaletti S, Szolnoki A. 2017. Statistical physics of human cooperation Phys. Rep. 687, 1–51. ( 10.1016/j.physrep.2017.05.004) [DOI] [Google Scholar]
- 7.Girvan M, Newman ME. 2002. Community structure in social and biological networks. Proc. Natl Acad. Sci. USA 99, 7821–7826. ( 10.1073/pnas.122653799) [DOI] [PMC free article] [PubMed] [Google Scholar]
- 8.Lusseau D, Wilson B, Hammond PS, Grellier K, Durban JW, Parsons KM, Barton TR, Thompson PM. 2006. Quantifying the influence of sociality on population structure in bottlenose dolphins. J. Anim. Ecol. 75, 14–24. ( 10.1111/jae.2006.75.issue-1) [DOI] [PubMed] [Google Scholar]
- 9.Kanngiesser P, Sueur C, Riedl K, Grossmann J, Call J. 2011. Grooming network cohesion and the role of individuals in a captive chimpanzee group. Am. J. Primatol. 73, 758–767. ( 10.1002/ajp.20914) [DOI] [PubMed] [Google Scholar]
- 10.Sueur C, Petit O, De Marco A, Jacobs A, Watanabe K, Thierry B. 2011. A comparative network analysis of social style in macaques. Anim. Behav. 82, 845–852. ( 10.1016/j.anbehav.2011.07.020) [DOI] [Google Scholar]
- 11.Mourier J, Vercelloni J, Planes S. 2012. Evidence of social communities in a spatially structured network of a free-ranging shark species. Anim. Behav. 83, 389–401. ( 10.1016/j.anbehav.2011.11.008) [DOI] [Google Scholar]
- 12.Olesen JM, Bascompte J, Dupont YL, Jordano P. 2007. The modularity of pollination networks. Proc. Natl Acad. Sci. USA 104, 19 891–19 896. ( 10.1073/pnas.0706375104) [DOI] [PMC free article] [PubMed] [Google Scholar]
- 13.Sah P, Nussear KE, Esque TC, Aiello CM, Hudson PJ, Bansal S. 2016. Inferring social structure and its drivers from refuge use in the desert tortoise, a relatively solitary species. Behav. Ecol. Sociobiol. 70, 1277–1289. ( 10.1007/s00265-016-2136-9) [DOI] [Google Scholar]
- 14.Sah P, Leu ST, Cross PC, Hudson PJ, Bansal S. 2017. Unraveling the disease consequences and mechanisms of modular structure in animal social networks. Proc. Natl Acad. Sci. USA 114, 4165–4170. ( 10.1073/pnas.1613616114) [DOI] [PMC free article] [PubMed] [Google Scholar]
- 15.Gilarranz LJ, Rayfield B, Liñán-Cembrano G, Bascompte J, Gonzalez A. 2017. Effects of network modularity on the spread of perturbation impact in experimental metapopulations. Science 357, 199–201. ( 10.1126/science.aal4122) [DOI] [PubMed] [Google Scholar]
- 16.Centola D. 2010. The spread of behavior in an online social network experiment. Science 329, 1194–1197. ( 10.1126/science.1185231) [DOI] [PubMed] [Google Scholar]
- 17.Weng L, Menczer F, Ahn Y-Y. 2013. Virality prediction and community structure in social networks. Sci. Rep. 3, 2522 ( 10.1038/srep02522) [DOI] [PMC free article] [PubMed] [Google Scholar]
- 18.Wang Z, Szolnoki A, Perc M. 2013. Optimal interdependence between networks for the evolution of cooperation. Sci. Rep. 3, 2470 ( 10.1038/srep02470) [DOI] [PMC free article] [PubMed] [Google Scholar]
- 19.Wang Z, Szolnoki A, Perc M. 2013. Interdependent network reciprocity in evolutionary games. Sci. Rep. 3, 1183 ( 10.1038/srep01183) [DOI] [PMC free article] [PubMed] [Google Scholar]
- 20.Jiang L-L, Perc M. 2013. Spreading of cooperative behaviour across interdependent groups. Sci. Rep. 3, 2483 ( 10.1038/srep02483) [DOI] [PMC free article] [PubMed] [Google Scholar]
- 21.Wang Z, Szolnoki A, Perc M. 2014. Rewarding evolutionary fitness with links between populations promotes cooperation. J. Theor. Biol. 349, 50–56. ( 10.1016/j.jtbi.2014.01.037) [DOI] [PubMed] [Google Scholar]
- 22.Sood V, Redner S. 2005. Voter model on heterogeneous graphs. Phys. Rev. Lett. 94, 178701 ( 10.1103/PhysRevLett.94.178701) [DOI] [PubMed] [Google Scholar]
- 23.Antal T, Redner S, Sood V. 2006. Evolutionary dynamics on degree-heterogeneous graphs. Phys. Rev. Lett. 96, 188104 ( 10.1103/PhysRevLett.96.188104) [DOI] [PMC free article] [PubMed] [Google Scholar]
- 24.Sood V, Antal T, Redner S. 2008. Voter models on heterogeneous networks. Phys. Rev. E 77, 041121 ( 10.1103/PhysRevE.77.041121) [DOI] [PMC free article] [PubMed] [Google Scholar]
- 25.Tarnita CE, Ohtsuki H, Antal T, Fu F, Nowak MA. 2009. Strategy selection in structured populations. J. Theor. Biol. 259, 570–581. ( 10.1016/j.jtbi.2009.03.035) [DOI] [PMC free article] [PubMed] [Google Scholar]
- 26.Allen B, Lippner G, Chen Y-T, Fotouhi B, Momeni N, Yau S-T, Nowak MA. 2017. Evolutionary dynamics on any population structure. Nature 544, 227–230. ( 10.1038/nature21723) [DOI] [PubMed] [Google Scholar]
- 27.Fotouhi B, Rabbat MG. 2014. Voter model with arbitrary degree dependence: clout, confidence and irreversibility. Eur. Phys. J. B 87, 55 ( 10.1140/epjb/e2014-41088-3) [DOI] [Google Scholar]
- 28.Chen Y-T. et al. 2013. Sharp benefit-to-cost rules for the evolution of cooperation on regular graphs. Ann. Appl. Probab. 23, 637–664. ( 10.1214/12-AAP849) [DOI] [Google Scholar]
- 29.Taylor PD, Day T, Wild G. 2007. Evolution of cooperation in a finite homogeneous graph. Nature 447, 469–472. ( 10.1038/nature05784) [DOI] [PubMed] [Google Scholar]
- 30.Ohtsuki H, Hauert C, Lieberman E, Nowak MA. 2006. A simple rule for the evolution of cooperation on graphs and social networks. Nature 441, 502–505. ( 10.1038/nature04605) [DOI] [PMC free article] [PubMed] [Google Scholar]
- 31.Holland PW, Laskey KB, Leinhardt S. 1983. Stochastic blockmodels: first steps. Soc. Netw. 5, 109–137. ( 10.1016/0378-8733(83)90021-7) [DOI] [Google Scholar]
- 32.Decelle A, Krzakala F, Moore C, Zdeborová L. 2011. Asymptotic analysis of the stochastic block model for modular networks and its algorithmic applications. Phys. Rev. E 84, 066106 ( 10.1103/PhysRevE.84.066106) [DOI] [PubMed] [Google Scholar]
- 33.Karrer B, Newman ME. 2011. Stochastic blockmodels and community structure in networks. Phys. Rev. E 83, 016107 ( 10.1103/PhysRevE.83.016107) [DOI] [PubMed] [Google Scholar]
- 34.Erdős P, Rényi A. 1959. On random graphs. Publicationes Math. 6, 290–297. [Google Scholar]
- 35.Fotouhi B, Momeni N, Allen B, Nowak MA. 2018. Conjoining uncooperative societies facilities evolution of cooperation. Nat. Hum. Behav. 2, 492–499. ( 10.1038/s41562-018-0368-6) [DOI] [PubMed] [Google Scholar]
- 36.Long JC, Cunningham FC, Braithwaite J. 2013. Bridges, brokers and boundary spanners in collaborative networks: a systematic review. BMC Health Serv. Res. 13, 158 ( 10.1186/1472-6963-13-158) [DOI] [PMC free article] [PubMed] [Google Scholar]
- 37.Newman ME, Watts DJ. 1999. Renormalization group analysis of the small-world network model. Phys. Lett. A 263, 341–346. ( 10.1016/S0375-9601(99)00757-4) [DOI] [Google Scholar]
- 38.Dorogovtsev SN, Mendes JFF, Samukhin AN. 2000. Structure of growing networks with preferential linking. Phys. Rev. Lett. 85, 4633–4636. ( 10.1103/PhysRevLett.85.4633) [DOI] [PubMed] [Google Scholar]
- 39.Krapivsky PL, Redner S, Leyvraz F. 2000. Connectivity of growing random networks. Phys. Rev. Lett. 85, 4629–4632. ( 10.1103/PhysRevLett.85.4629) [DOI] [PubMed] [Google Scholar]
- 40.Holme P, Kim BJ. 2002. Growing scale-free networks with tunable clustering. Phys. Rev. E 65, 026107 ( 10.1103/PhysRevE.65.026107) [DOI] [PubMed] [Google Scholar]
- 41.Klemm K, Eguiluz VM. 2002. Growing scale-free networks with small-world behavior. Phys. Rev. E 65, 057102 ( 10.1103/PhysRevE.65.057102) [DOI] [PubMed] [Google Scholar]
- 42.Barthélemy M. 2003. Crossover from scale-free to spatial networks. Europhys. Lett. 63, 915–921. ( 10.1209/epl/i2003-00600-6) [DOI] [Google Scholar]
- 43.Catanzaro M, Boguná M, Pastor-Satorras R. 2005. Generation of uncorrelated random scale-free networks. Phys. Rev. E 71, 027103 ( 10.1103/PhysRevE.71.027103) [DOI] [PubMed] [Google Scholar]
- 44.Lancichinetti A, Fortunato S, Radicchi F. 2008. Benchmark graphs for testing community detection algorithms. Phys. Rev. E 78, 046110 ( 10.1103/PhysRevE.78.046110) [DOI] [PubMed] [Google Scholar]
- 45.Ibsen-Jensen R, Chatterjee K, Nowak MA. 2015. Computational complexity of ecological and evolutionary spatial dynamics. Proc. Natl Acad. Sci. USA 112, 15 636–15 641. ( 10.1073/pnas.1511366112) [DOI] [PMC free article] [PubMed] [Google Scholar]
Associated Data
This section collects any data citations, data availability statements, or supplementary materials included in this article.
Data Availability Statement
This article has no additional data.