Abstract
Extracellular matrix (ECM) is a major component of the local environment, i.e. the niche, that can determine cell behavior1. During metastatic growth, cancer cells shape the ECM of the metastatic niche by hydroxylating collagen to promote their own metastatic growth2, 3. However, only particular nutrients might support the ability of cancer cells to hydroxylate collagen because nutrients dictate which enzymatic reactions are active in cancer cells4, 5. Here, we discovered that breast cancer cells rely on the nutrient pyruvate to drive collagen-based ECM remodeling in the lung metastatic niche. Specifically, we discovered that pyruvate uptake induces the production of α-ketoglutarate. This metabolite in turn activated collagen hydroxylation by increasing the activity of the enzyme collagen prolyl-4-hydroxylase (P4HA). Strikingly, inhibition of pyruvate metabolism was sufficient to impair collagen hydroxylation and consequently the growth of breast cancer-derived lung metastases in different mouse models. In summary, we provide a mechanistic understanding of the link between collagen remodeling and the nutrient environment in the metastatic niche.
Keywords: Extracellular matrix metabolism, collagen remodeling, collagen modification, collagen hydroxylation, metabolic regulation, lung microenvironment, pyruvate metabolism, α-ketoglutarate, metastatic growth, metastatic niche, breast cancer, breast cancer-derived lung metastases
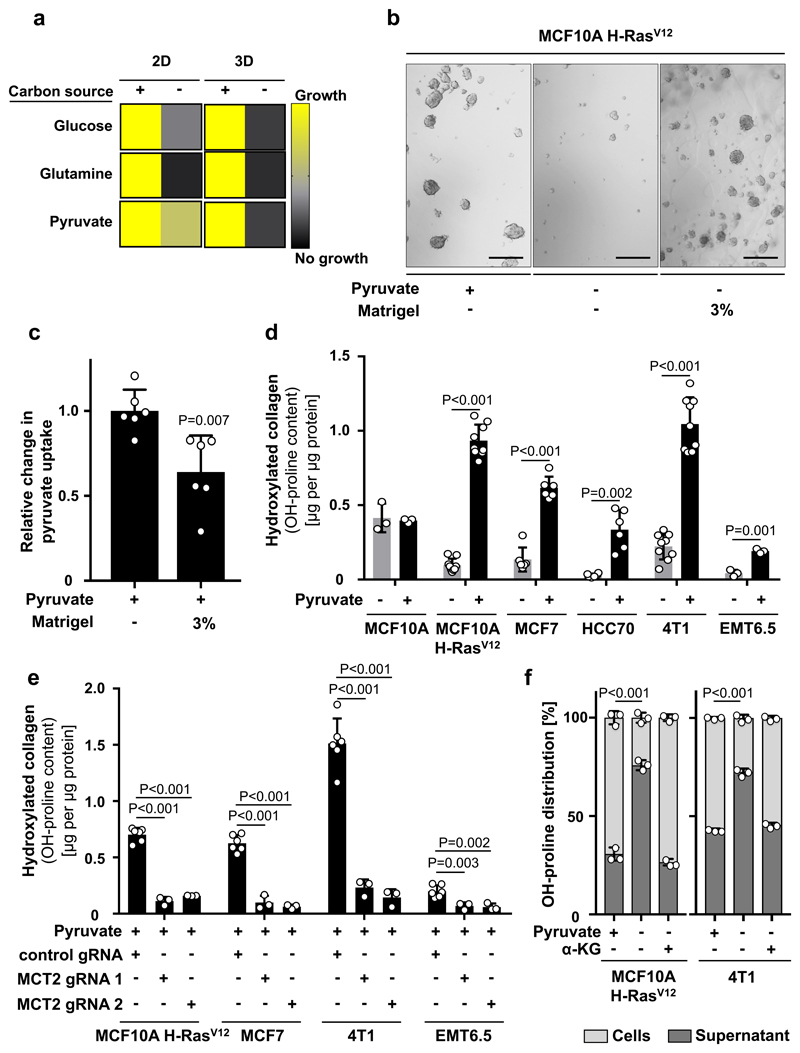
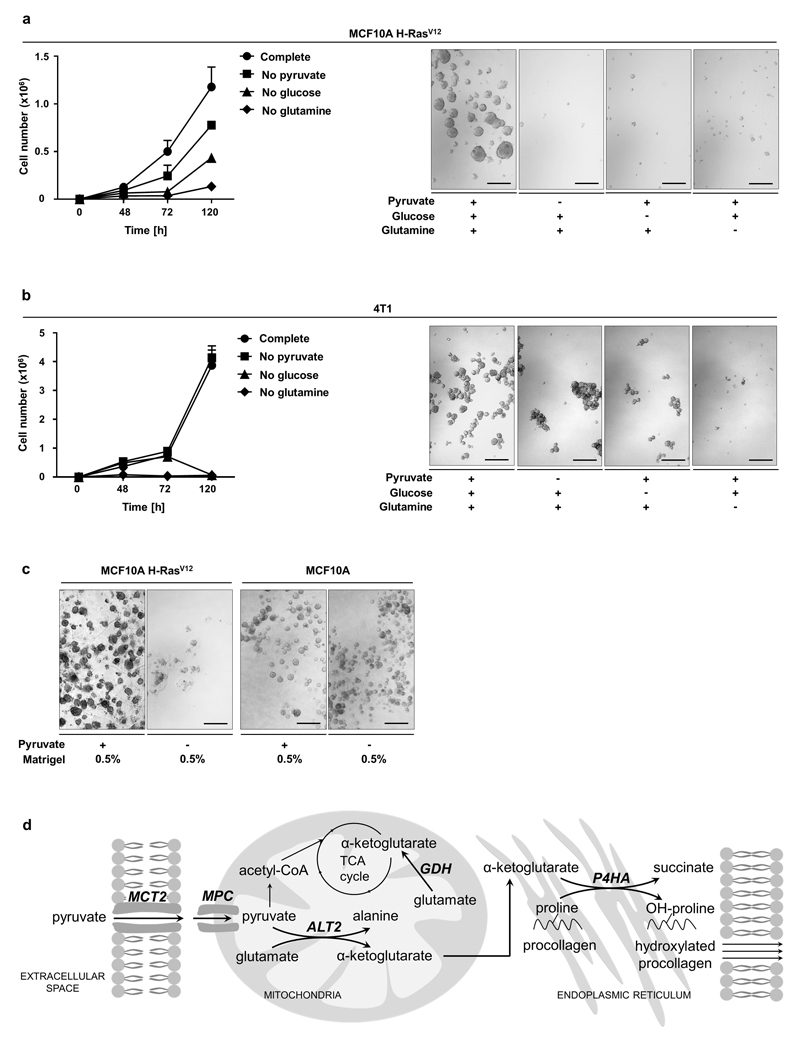
The metabolic requirements of ECM production and modification can be enforced in vitro by shifting cancer cells from attached monolayer (2D) to spheroid (3D) growth. In the latter condition, soft-agar coating prevents cells from attachment and thus induces in cells the need to generate ECM for effective growth. We postulated that nutrients that drive 3D (but not 2D) growth could be a requirement for ECM metabolism. Consequently, we depleted glucose, glutamine, or pyruvate from the media and assessed growth of MCF10A H-RASV12 and 4T1 cells in 3D compared to 2D cultures. The latter nutrient has been identified to be particularly available in the lung6, 7, which is a frequent metastatic site of breast cancers. We found that only pyruvate depletion impaired the 3D growth of breast cancer cells, while having only a minor effect on 2D growth (Figure 1a, Extended Data Figure 1a, b). This identifies pyruvate as a nutrient potentially important for ECM metabolism. In this case, we expect that ECM supplementation (Matrigel) restores 3D growth in the absence of pyruvate and decreases pyruvate uptake. Indeed, Matrigel induced the expected alterations in MCF10A H-RASV12 cells (Figure 1b, 1c). Notably, non-tumorigenic MCF10A cells were pyruvate independent (Extended Data Figure 1c). Thus, we concluded that pyruvate supports ECM metabolism in breast cancer cells.
Figure 1. Pyruvate drives ECM remodeling via collagen hydroxylation.
(a) Growth response of MCF10A H-RasV12 2D and 3D culture with or without glucose (17.5 mM), glutamine (2.5 mM) or pyruvate (0.5 mM). Growth was assessed based on cell number (2D, n=6) or spheroid size (3D, n=3).
(b) Representative pictures of MCF10A H-RasV12 spheroids with or without pyruvate and supplemented with ECM (Matrigel). Analysis was performed at day 5. Scale bar: 150 µm.
(c) Relative change in pyruvate uptake in MCF10A H-RasV12 spheroids with or without supplemented ECM (Matrigel) normalized to the condition with pyruvate. n=6.
(d) Hydroxylated collagen based on hydroxyproline (OH-proline) in human (MCF10A, MCF10A H-RASV12, MCF7, HCC70) and mouse (4T1, EMT6.5) breast cancer spheroids with or without pyruvate. n=3 for MCF10A and EMT6.5; n=6 for MCF7 and HCC70; n=9 for MCF10A H-RasV12 and 4T1.
(e) Hydroxylated collagen based on hydroxyproline (OH-proline) in breast cancer spheroids transduced with lentiviral CRISPR with or without guide for MCT2 in the presence of pyruvate. n=6 for control gRNA; n=3 for MCT2 gRNA1 and 2.
(f) Collagen stability based on the hydroxyproline (OH-proline) distribution between MCF10A H-RasV12 cells and supernatant upon MMP 8 digestion with or without pyruvate or cell permeable α-ketoglutarate (dimethyl 2-oxoglutarate; α-KG; 1.5 mM). n=3.
Error bars represent SD of mean from biological independent samples. Two-tailed unpaired student’s T-test.
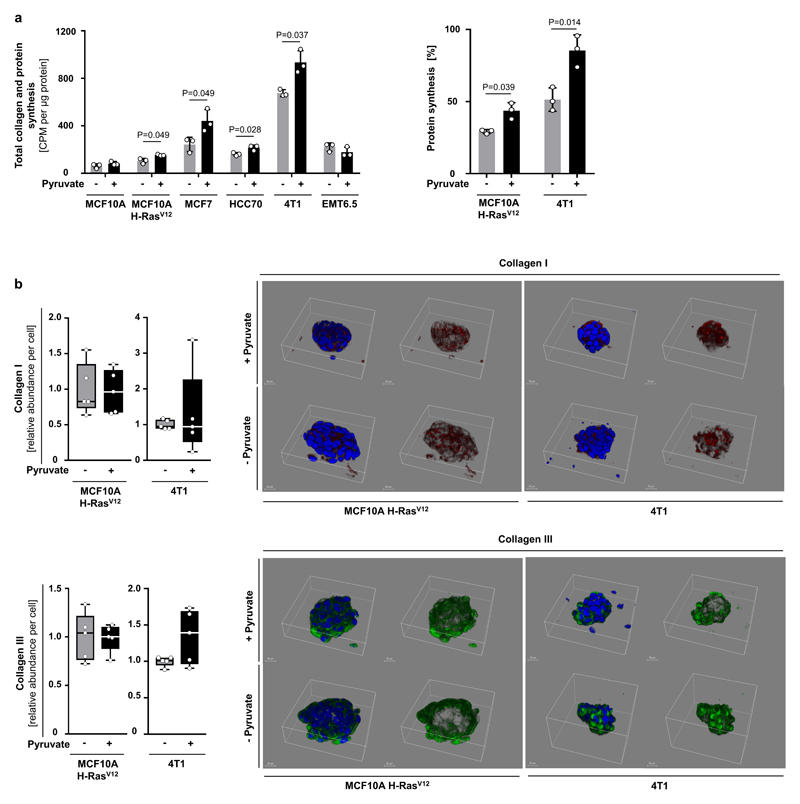
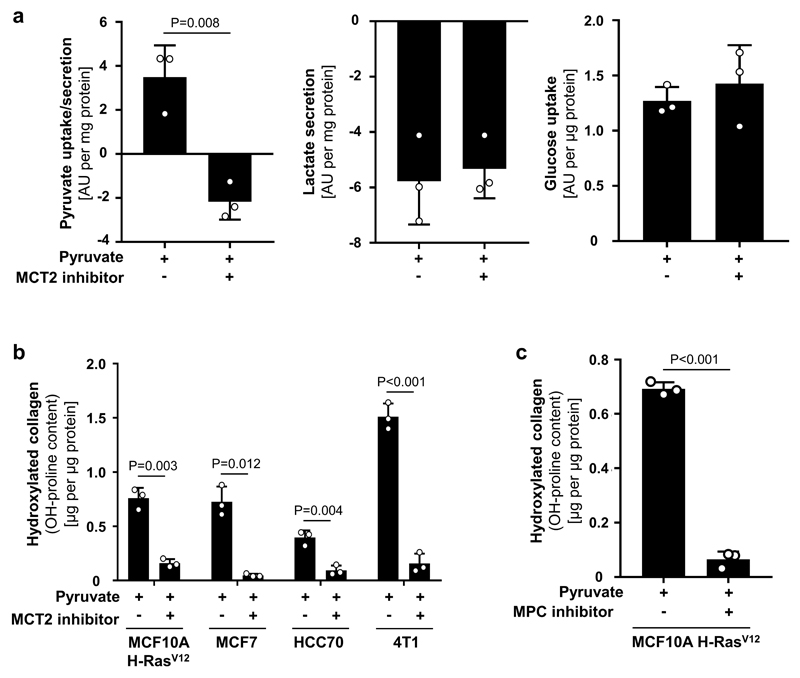
Next, we investigated the impact of pyruvate on collagen-based ECM production and modification by cancer cells (Extended Data Figure 1d). We used different human (MCF10A H-RASV12, MCF7, HCC70) and mouse (4T1, EMT6.5) breast cancer cells and assessed collagen hydroxylation (ECM modification) and collagen synthesis (ECM production). Non-tumorigenic MCF10A cells were used as control. We found that pyruvate significantly increased hydroxylated collagen in all cancer cells (Figure 1d), but had no effect on non-tumorigenic MCF10A cells and collagen synthesis (Figure 1d, Extended Data Figure 2a, b). We obtained similar results by targeting pyruvate uptake (by inhibiting the pyruvate transporter monocarboxylate transporter (MCT) 2) and pyruvate metabolism (by inhibiting the mitochondrial pyruvate carrier) (Figure 1e, Extended Data Figure 3a-c). These results suggest that pyruvate is required for collagen modification (i.e. hydroxylation) rather than synthesis.
As hydroxylation is essential for collagen stability, we next measured the stability of collagen produced by MCF10A H-RASV12 and 4T1 cells using a matrix metallopeptidase (MMP) 8 assay. MMP 8 digests collagen I-III, but digestion is impaired by increased stability. If pyruvate drives collagen stability via hydroxylation, we expect that upon pyruvate depletion MMP 8 is more effective in digesting cancer cell-produced collagen. Specifically, we measured the hydroxyproline distribution between cells and supernatant because only hydroxyproline from digested collagen is released to the supernatant. We observed that pyruvate depletion significantly decreased the stability of collagen produced by MCF10A H-RASV12 and 4T1 cells (Figure 1f). Thus, we concluded that pyruvate drives ECM remodeling by inducing collagen hydroxylation, which results in elevated collagen stability.
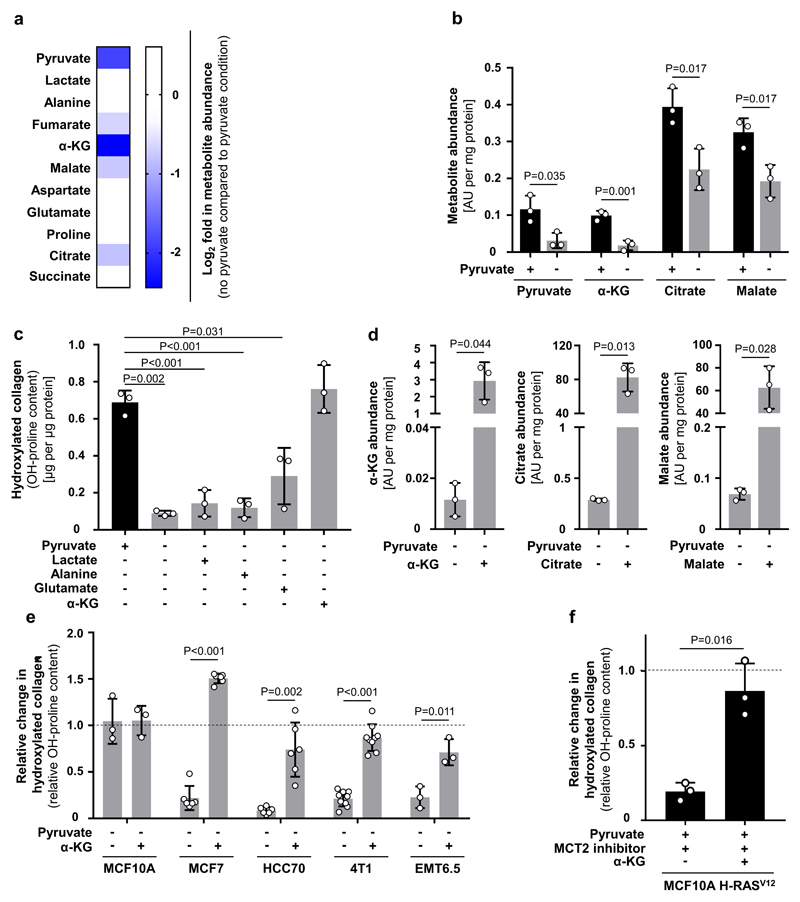
We then investigated the mechanism by which pyruvate drives collagen hydroxylation. We postulated that metabolites that changed in abundance upon pyruvate depletion could mechanistically link this nutrient to collagen hydroxylation. We found that upon pyruvate depletion the abundance of α-ketoglutarate, citrate and malate were reduced in MCF10A H-RASV12 spheroids (Extended Data Figure 4a, b). Lactate, a metabolite that can be taken up by cancer cells and converted into pyruvate8, was not altered in abundance and did not influence collagen hydroxylation (Extended Data Figure 4a, c). Consequently, we measured hydroxylated collagen in the presence of α-ketoglutarate, citrate and malate and observed that only addition of α-ketoglutarate significantly increased hydroxylated collagen (Figure 2a, Extended Data Figure 4d). This finding was confirmed in multiple cell lines and upon MCT2 inhibition (Figure 2b, Extended Data Figure 4e, f). Moreover, α-ketoglutarate addition rescued collagen stability upon pyruvate depletion (Figure 1f). Thus, we concluded that pyruvate-induced α-ketoglutarate production drives collagen hydroxylation.
Figure 2. Pyruvate drives availability of α-ketoglutarate which metabolically regulates P4HA activity.
(a) Hydroxylated collagen based on hydroxyproline (OH-proline) in MCF10A H-RASV12 spheroids in the presence or absence of pyruvate in combination with cell permeable α-ketoglutarate (dimethyl 2-oxoglutarate; α-KG; 1.5 mM), citrate (5 mM), or malate (5 mM).
(b) Relative change in hydroxylated collagen based on hydroxyproline (OH-proline) in human (MCF10A H-RASV12, MCF7) and mouse (4T1, EMT6.5) breast cancer spheroids transduced with lentiviral CRISPR with or without guide for MCT2 upon addition of cell permeable α-ketoglutarate (dimethyl 2-oxoglutarate; α-KG; 1.5 mM) in the presence of pyruvate. Data are normalized to the corresponding conditions without genetic MCT2 inhibition. Dashed line indicates the level of hydroxylated collagen in the corresponding conditions without genetic MCT2 inhibition.
(c) Hydroxylated collagen based on hydroxyproline (OH-proline) in human (MCF10A H-RasV12, MCF7, HCC70) and mouse (4T1) breast cancer spheroids in the presence of pyruvate upon addition of 1.5 mM (MCF10A H-RasV12, 4T1) or 2 mM (MCF7, HCC70) cell permeable α-ketoglutarate (dimethyl 2-oxoglutarate; α-KG) and/or 1.5 mM cell permeable succinate (dimethyl succinate).
Error bars represent SD of mean from biological independent samples (n=3). Two-tailed unpaired student’s T-test.
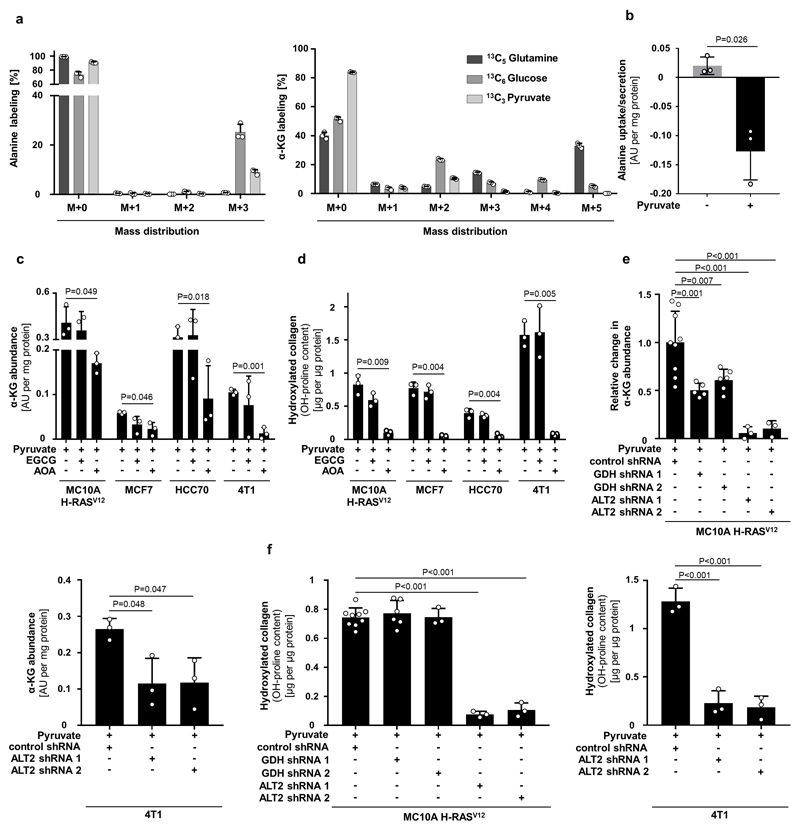
Pyruvate metabolism can be linked to α-ketoglutarate via several metabolic pathways. The most direct metabolic link is the alanine aminotransferase (ALT) reaction that converts pyruvate and glutamate to α-ketoglutarate and alanine (Extended Data Figure 1d). Measuring the 13C carbon distribution9 in the metabolites of the ALT reaction, we observed that pyruvate contributed more carbons to alanine than to α-ketoglutarate and that glutamine (important glutamate precursor) donated about 45% of carbon to α-ketoglutarate (Extended Data Figure 5a). Moreover, alanine was secreted specifically in the presence of pyruvate (Extended Data Figure 5b) and neither alanine nor glutamate rescued hydroxylated collagen upon pyruvate depletion (Extended Data Figure 4c). These findings indicate an involvement of ALT in pyruvate-driven α-ketoglutarate production. Consequently, we measured α-ketoglutarate and hydroxylated collagen abundance upon ALT2 inhibition and found that both were decreased (Extended Data Figure 5c-f). Thus, we concluded that pyruvate drives α-ketoglutarate production through ALT conversion.
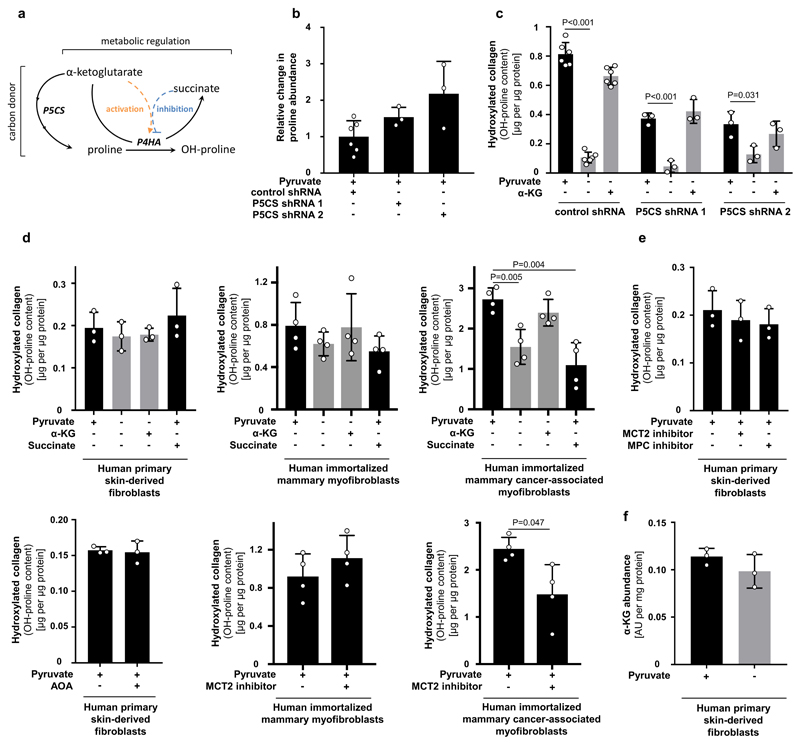
Next, we investigated whether α-ketoglutarate is a carbon donor for generating the P4HA substrate proline, or whether α-ketoglutarate metabolically activates P4HA via enzyme kinetics (Extended Data Figure 6a). We excluded the first mechanism by inhibiting the α-ketoglutarate to proline conversion via pyrroline-5-carboxylate synthase (P5CS) silencing (Extended Data Figure 6b, c). We then investigated whether α-ketoglutarate could be a metabolic activator of P4HA (Extended Data Figure 6a). Metabolic activation depends on metabolite substrate- and product-driven enzyme activity10, i.e. high substrate metabolite concentrations activate flux through a metabolic enzyme, while high product metabolite concentrations have an inhibitory effect. Thus, if α-ketoglutarate is a metabolic activator of P4HA activity, succinate as the co-product of the reaction should impair P4HA activity. Therefore, we added succinate to breast cancer spheroids and measured hydroxylated collagen in the presence of pyruvate. In accordance with the metabolic activator mechanism, we found that succinate significantly decreased hydroxylated collagen, while α-ketoglutarate on top of succinate rescued it (Figure 2c). These findings support the notion that P4HA is metabolically regulated by α-ketoglutarate. Interestingly, non-transformed fibroblasts (primary human skin-derived fibroblasts and immortalized human mammary myofibroblasts), which can also remodel ECM, were pyruvate, α-ketoglutarate and succinate independent, while cancer-associated myofibroblasts moderately decreased hydroxylated collagen in response to a decreased α-ketoglutarate to succinate ratio and decreased pyruvate availability (Extended Data Figure 6d-f). This suggests that metabolic regulation of P4HA is important in transformed cells and that in particular breast cancer cells (but not normal cells12) modulate this metabolic regulation via pyruvate uptake.
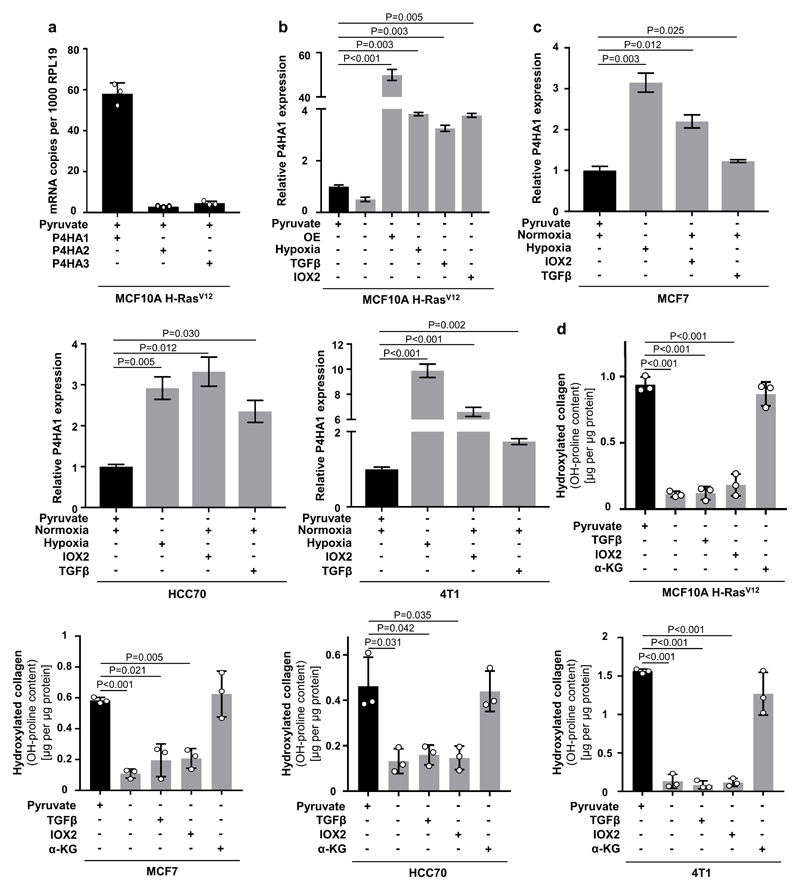
To date, transcriptional regulation of P4HA expression by HIF1α is considered to be the major determinant of collagen hydroxylation11. In the metastatic niche various stimuli such as hypoxia and TGFβ signaling converge in HIF1α stabilization resulting in the transcriptional up-regulation of P4HA11. To address the relationship between metabolic and transcriptional regulation of P4HA, we determined hydroxylated collagen abundance upon P4HA1 overexpression with or without pyruvate, α-ketoglutarate or succinate in normoxia or hypoxia (Figure 3a, Extended Data Figure 7a, b). While P4HA1 overexpression slightly increased hydroxylated collagen in the absence of pyruvate in normoxia, addition of α-ketoglutarate was necessary in normoxia and hypoxia to rescue hydroxylated collagen (Figure 3a). Moreover, succinate addition prohibited pyruvate-driven collagen hydroxylation in P4HA1 overexpressing spheroids in normoxia and hypoxia (Figure 3a). Accordingly, hypoxia, TGF-β stimulation and IOX2 treatment (which is a PHD2 inhibitor leading to HIF1α stabilization) did not restore hydroxylated collagen upon pyruvate depletion in different cancer cells (Figure 3b, Extended Data Figure 7b-d). These results suggest metabolic regulation by pyruvate as an important and transcriptionally independent determinant of collagen hydroxylation.
Figure 3. Pyruvate is a - transcriptionally independent - regulator of collagen hydroxylation.
(a) Hydroxylated collagen based on hydroxyproline (OH-proline) in MCF10A H-RasV12 spheroids transduced with an overexpressing vector (OE) with or without P4HA1 sequence cultured in normoxia or hypoxia (1 % oxygen) in the presence or absence of pyruvate and addition of cell permeable α-ketoglutarate (dimethyl 2-oxoglutarate; α-KG; 1.5 mM) and/or cell permeable succinate (dimethyl succinate; 1.5 mM). A two-way Anova with Tukey multiple comparisons was performed to compare across conditions. Significance of control versus OE in normoxia p=0.0003 and in hypoxia p=0.9042. Significance of pyruvate or α-ketoglutarate versus no pyruvate or succinate in normoxia/hypoxia p<0.0001. n=6 for +/- pryruvate, – pyruvate + α-KG and n=3 for + pyruvate + succinate in normoxia. n=3 for all conditions in hypoxia.
(b) Hydroxylated collagen based on hydroxyproline (OH-proline) in human (MCF10A H-RasV12, MCF7, HCC70) and mouse (4T1) breast cancer spheroids cultured in hypoxia (1 % oxygen) with or without pyruvate upon addition of cell permeable α-ketoglutarate (dimethyl 2-oxoglutarate; α-KG; 1.5 mM) and/or cell permeable succinate (dimethyl succinate; 1.5 mM). n=3.
Error bars represent SD of mean from biological independent samples. Two-tailed unpaired student’s T-test unless otherwise noted.
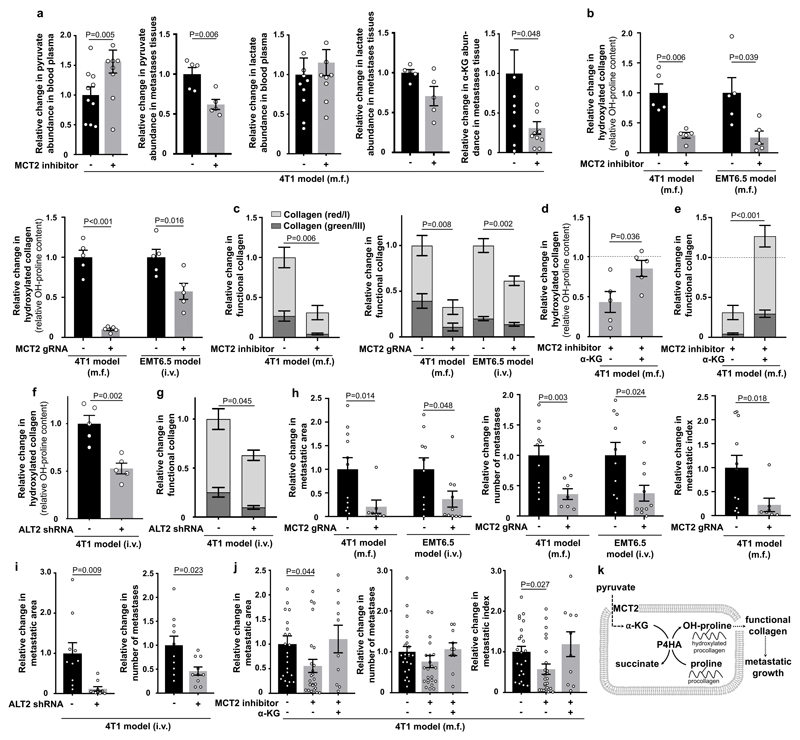
Finally, we asked whether the established mechanism occurs in the metastatic niche using two different breast cancer mouse models that metastasize to the lung. We confirmed that in vivo MCT2 inhibition resulted in the same intra- and extracellular metabolite abundance changes as identified in vitro (Figure 4a). Subsequently, we investigated in vivo ECM remodeling of the metastatic niche. We analyzed collagen hydroxylation and functional collagen I/III deposition (for which collagen stability is a prerequisite) in the 4T1 and EMT6.5 breast cancer models upon pharmacologic and genetic MCT2 inhibition. We observed that MCT2 inhibition resulted in decreased hydroxylated collagen and functional collagen I/III deposition in the lung metastatic niche (Figure 4b, c, Extended Data Figure 8a, b). Next, we performed a rescue experiment with α-ketoglutarate upon MCT2 inhibition. We found that α-ketoglutarate restored hydroxylated collagen and functional collagen I/III deposition in the metastatic niche upon MCT2 inhibition (Figure 4d, e, Extended Data Figure 8c). Moreover, we inhibited pyruvate driven α-ketoglutarate production by targeting ALT2, which phenocopied the effect of MCT2 inhibition (Figure 4f, g, Extended Data Figure 8d). These findings show that breast cancer cells in the lung metastatic niche rely on pyruvate to drive collagen-based ECM remodeling.
Figure 4. Pyruvate drives in vivo collagen hydroxylation and metastatic growth.
(a) Metabolite abundances in 4T1 mice treated upon MCT2 inhibition (α-cyano-4-hydroxycinnamic acid; 60 mg per kg; i.p.). Plasma n=10 exception pyruvate with MCT2 inhibitor n=9; tissue pyruvate/lactate n=5 and α-KG n=10.
(b) Hydroxylated collagen in 4T1 and EMT6.5 lung metastases upon pharmacologic (α-cyano-4-hydroxycinnamic acid; 60 mg per kg; i.p.) and genetic MCT2 inhibition (n=5).
(c) Functional collagen in the same models as described in (b). Significance collagen red/green reduction: 0.009/0.006 (4T1 inhibitor), 0.01/0.006 (4T1 genetic) and 0.001/0.04 (EMT6.5 genetic). n=10 (4T1 vehicle), n=7 (4T1 inhibitor), n=11 (4T1 control), n=6 (4T1 MCT2 gRNA), n=20 (EMT6.5 control), n=12 (EMT6.5 MCT2 gRNA).
(d) Hydroxylated collagen in 4T1 lung metastases upon MCT2 inhibition (α-cyano-4-hydroxycinnamic acid; 60 mg per kg; i.p.) with(out) cell permeable α-ketoglutarate (dimethyl 2-oxoglutarate; α-KG; 50 mg per kg; i.p.; n=5).
(e) Functional collagen in the same models as described in (d). Significance collagen red/green increase: 0.0008/0.0005. n=7 (inhibitor), n=9 (inhibitor + α-KG).
(f) Hydroxylated collagen in 4T1 lung metastases upon genetic inhibition of ALT2 (n=5).
(g) Functional collagen in the same models as described in (f). Significance collagen red/green reduction: 0.10/0.02. n=7 (control), n=4 (ALT2 shRNA).
(h-i) Metastatic burden in 4T1 and EMT6.5 lungs upon genetic MCT2 or ALT2 inhibition. n=11 (4T1 control; two cohorts), n=7 (4T1 MCT2 gRNA; two cohorts), n=10 (EMT6.5 control), n=10 (EMT6.5 MCT2 gRNA or shALT2).
(j) Metastatic burden in the same models as described in (d). n=23 (vehicle; three cohorts), n=24 (inhibitor; two cohorts), n=10 (inhibitor + α-KG).
(k) Role of pyruvate in ECM remodeling.
m.f. : mammary fat pad; i.v. : intra venous; i.p. : intra peritoneal. Dashed lines indicate level without treatment. Data are normalized to no treatment condition. Error bars represent SEM of mean from different mice. Two-tailed unpaired student’s T-test.
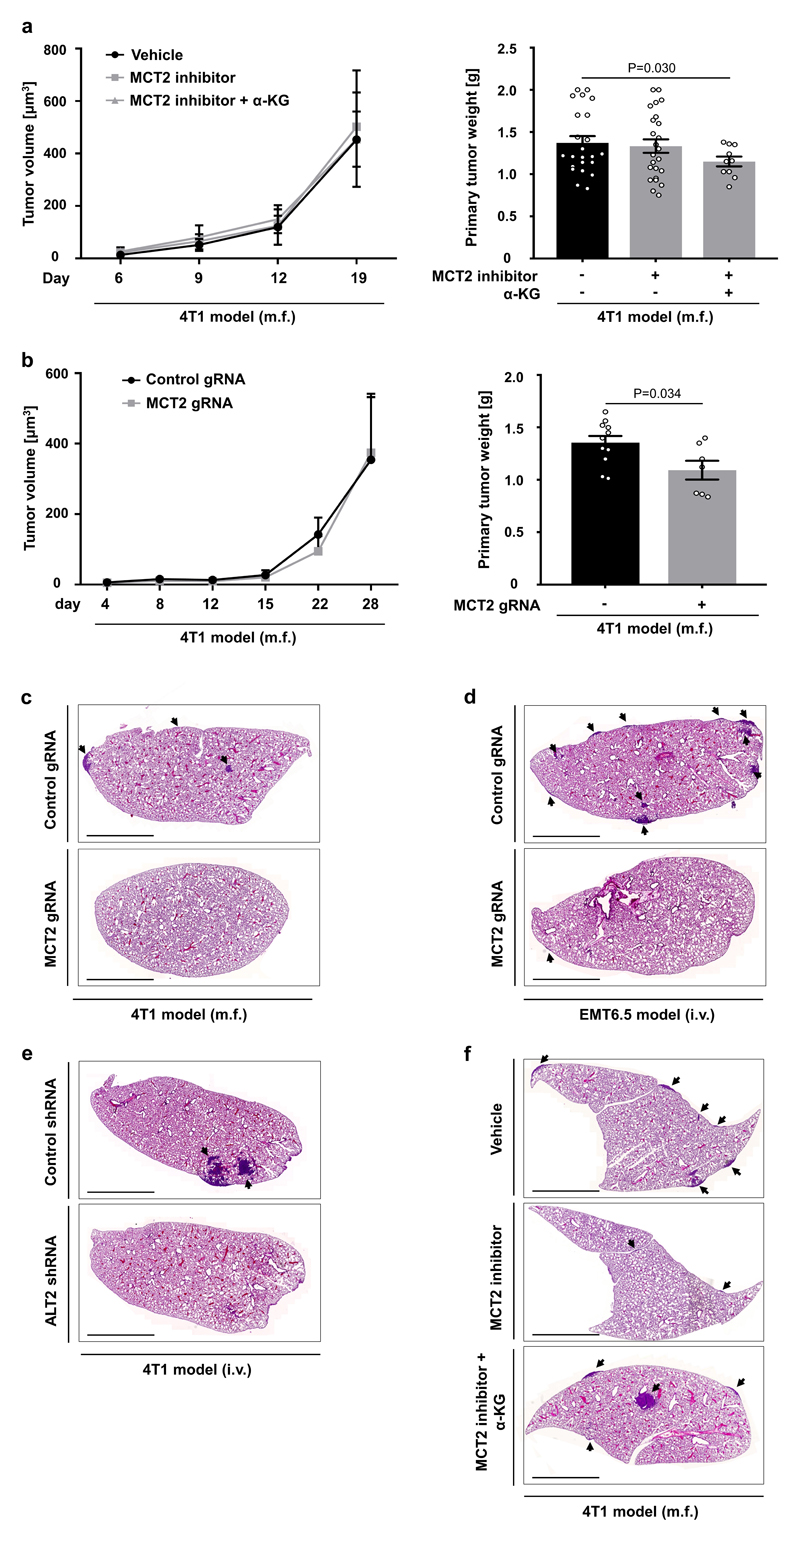
Subsequently, we evaluated the metastatic burden of the lung based on metastatic area, metastases number and metastatic index (metastatic area divided by primary tumor weight) in the same mouse models as described above. While primary tumor growth and weight was not significantly or only mildly affected (Extended Data Figure 9a, b), metastatic burden was substantially reduced upon pyruvate uptake and metabolism inhibition (Figure 4h, i, Extended Data Figure 9c-e). In accordance, α-ketoglutarate treatment fully restored metastatic burden upon MCT2 inhibition (Figure 4j, Extended Data Figure 9f). Thus, we concluded that inhibition of pyruvate metabolism is sufficient to impair metastatic growth in the lung.
Taken together, these results demonstrate that pyruvate serves as a pivotal nutrient in the lung metastatic niche to promote cancer cell-dependent ECM modification that supports metastatic growth (Figure 4k). Moreover, we provide evidence that nutrients fueling metabolic regulation can be decoupled from nutrients fueling carbon biosynthetic needs. This discovery allows for the first time to target regulation by metabolite concentrations, which was so far considered to be undruggable10. In conclusion, our data suggest that targeting pyruvate uptake can normalize the aberrant collagen remodeling in the lung metastatic niche and thus impair metastatic growth.
Methods
Cell Culture
MCF10A cells expressing H-RasV12 (MCF10A H-RasV12) as well as control cells expressing an empty pLA vector (MCF10A) were generated as previously described13. MCF10A and MCF10A H-RasV12 cells were grown in Dulbecco's modified Eagle's medium-F12 (DMEM-F12) supplemented with 5% horse serum, 1% penicillin (50 units per ml), 1% streptomycin (50 μg per ml), 0.5 μg per ml hydrocortisone, 100 ng per ml cholera toxin, 10 μg per ml insulin, and 20 ng per ml recombinant human EGF. MCF10A and MCF10A H-RasV12 cells were cultured in 0.5 mM pyruvate condition. As MCF10A H-RasV12 cells undergo growth inhibition upon pyruvate depletion, we used for these cells 0.02 mM pyruvate instead of complete pyruvate depletion. MCF7, HCC70, primary human skin-derived fibroblasts, immortalized human mammary myofibroblasts and immortalized human mammary cancer-associated myofibroblasts14 cells were cultured in Dulbecco's modified Eagle's medium (DMEM) supplemented with 10% fetal bovine serum, 1% penicillin (50 units per ml), 1% streptomycin (50 μg per ml) and with or without 1 mM pyruvate. 4T1 and EMT6.5 cells were cultured in Roswell Park Memorial Institute medium (RPMI) with 10% fetal bovine serum, 1% penicillin (50 units per ml), 1% streptomycin (50 μg per ml) and with or without 1 mM pyruvate. All cell lines were cultured in spheroids as described before13. Growth factor reduced Matrigel (3%) without phenol red was added into the cold DMEM-F12 media before the seeding by using tips precooled to -20°C. 3D cultures were performed as described before13, 15. All cell lines were confirmed to be mycoplasma-free by Mycoalert detection kit (Lonza). MCF10A, MCF7, HCC70 and 4T1 cell lines were purchased from ATCC. The EMT6.5 cell line was kindly provided by Professor Robin Anderson (Peter MacCallum Cancer Center). (Myo)fibroblasts cell lines were kindly provided by Professor Ludo Van Den Bosch (VIB) and Prof. Akira Orimo (Juntendo University). MCF10A, MCF7 and HCC70 cell lines were validated by DNA fingerprinting.
Cell permeable α-ketoglutarate (dimethyl 2-oxoglutarate) and succinate (dimethyl succinate) were purchased from Sigma-Aldrich and used at the concentration of 1.5 mM. In figure 2c and 3b α-ketoglutarate and succinate were used at the concentrations of 2 and 1.5 mM for MCF7 and HCC70, respectively. Malate and citrate were purchased from Sigma-Aldrich and used at the concentration of 5 mM. Effective transport of supplemented metabolites into the cells was confirmed by mass spectrometry analysis (Extended Data Figure 4d).
α-Cyano-4-hydroxycinnamic acid and UK5099 were purchased from Sigma-Aldrich and used at the concentration of 1.5 mM and 50 µM respectively. TGFβ1 was purchased from Peprotech and used at the concentration of 14 ng per ml. IOX2 was purchased from Sigma-Aldrich and used at the concentration of 50 µM. All the compounds were added at day 0 and analyzed at day 5. All growth experiments were performed in n≥3 biological replicates.
Collagen staining
MCF10A H-RasV12 spheroids were transferred to fibronectin-coated plates and allowed to loosely attach to facilitate the following steps. The spheroids were fixed with 4% parafolmaldehyde in PBS for 30 min and permeabilized with 0.5% Triton X100 in PBS for 30 min. The spheroids were then incubated with either anti-Collagen I (Abcam, Ab34710; 1:500 dilution) or anti-Collagen III (Abcam, Ab7778; 1:100 dilution) antibodies overnight at 4°C, washed 3 times with PBS, incubated for 1h with the appropriate Alexa Fluor 555-conjugated secondary antibody (Life Technologies, A31272) and then washed again 3 times in PBS. Nuclei were stained with a solution of 1.5 mM of 4’,6-diamidino-2-phenylindole (DAPI; Sigma Aldrich, D9542) in PBS for 15 min. Coverslips were mounted in Fluorescence Mounting Medium (Dako, S3023). The samples were visualized on a SP8X inverted confocal microscope (Leica Microsystems) equipped with a 405 nm and a white light laser. Images were acquired in form of Z-stacks using the LAS AF acquisition software (Leica Microsystems). Image analysis and fluorescence intensity quantification were performed with Imaris Image Analysis Software 8 (Bitplane).
shRNA knockdowns
The lentiviral pLKO shP5CS 1 (CCTCAGTCGTACACATGGAAA), shP5CS 2 (CCATTATTTGACCAGATCATT), shGDH 1 (GCCATTGAGAAAGTCTTCAAA), shGDH 2 (GCAGAGTTCCAAGACAGGATA), human shALT2 1 (CGGCATTTCTACGATCCTGAA), human shALT2 2 (CCATCAAATGGCTCCAGACAT), mouse shALT2 1 (CGGTATTTCTACAATCCTGAA), shALT2 2 (CCCTAAAGTTCTCTGCATTAT) and scramble control were purchased from Sigma-Aldrich. Lentiviral particles were produced in HEK293 cells. MCF10A H-RasV12 cells were selected with puromycin 1 µg per ml. 4T1 cells were selected with puromycin 2 µg per ml. As a control a lentiviral pLKO with scrambled sequence was generated. shRNA-based silencing was confirmed by qPCR and western blot (Extended Data Figure 10).
CRISPR knockout
The MCT2 KO cell lines were generated by cloning either one or two (different exons for higher KO efficiency) CRISPR guides of MCT2 in the lentiviral CRISPR and guide expressing plasmid lentiCRISPR v2 (Plasmid #52961). From these the human MCT2 gRNA1 (GAAGAATACGGTGACAGCTT), human MCT2 gRNA2 (combination of guide: GGAAGAATACGGTGACAGCTT and guide: GCAACTATAGATTGCTTGCAA), mouse MCT2 gRNA1 (combination of guide: GCGATATCCAAGCGATCTGAC and guideGTACTAACACGACTGTTCCGC) and mouse MCT2 gRNA2 (combination of guide: GAACCACTTCCTCCCGACGGA and guide: GCGTCCTGTTTAGATCTGTTC) were selected and cloned 3’ to the U6 promoter through Gibson cloning 16, 17. Lentiviral particles were produced in HEK293 cells. MCF10A H-RasV12 and MCF7 cells were selected with puromycin 1 µg per ml. 4T1 and EMT6.5 cells were selected with puromycin 2 µg per ml. As a control, a CRISPR line lacking the guide for MCT2 was generated. CRISPR-based knockout was confirmed by western blot (Extended Data Figure 10).
Overexpression
The PHA1 expressing line was generated by cloning the 1605 base pair coding domain sequence of P4HA1 into the lentiviral pLVX-IRES vector (Clontech, 632185) through Gibson cloning. The sequence of P4HA was bought as a G block from IDT. Lentiviral particles were produced in HEK293 cells. MCF10A H-RasV12 cells were selected with hygromycin 600 µg per ml. As a control, an empty lentiviral pLVX-IRES vector was generated. Overexpression was confirmed by qPCR (Extended Data Figure 7b) and western blot (Extended Data Figure 10).
Western blot analysis
Cells were collected and then lysed in RIPA lysis and extraction buffer (Thermo Scientific) supplemented with proteinase (Roche, 11836153001) and phosphatase (PhosSTOP™, Sigma, 4906845001). Protein amount was measured using a pierce BCA protein assay kit (Thermo Scientific). 25-40 µg of protein were loaded on a NuPAGE 4–12% denaturing Bis-Tris gel and transferred to a nitrocellulose membrane (Thermo Scientific). Membranes were incubated overnight at 4°C with either MCT2 (LabNed, 0315312; 1:200 dilution), GPT2 (Santa Cruz, 398383; 1:500 dilution), P5CS (Santa Cruz, 515443; 1:500 dilution), GDH (Abcam, 153973; 1:1000 dilution), P4HA1 (Abcam, 59497; 1:2000 dilution), β-Actin (Sigma A5441; 1:10000 dilution) or ERK1/2 (Cell Signaling 4695S; 1:1000 dilution) primary antibodies. The day after the membranes were incubated with either mouse (Cell Signaling Technology, 7076; 1:5000 dilution), rabbit (Cell Signaling Technology, 7076; 1:5000 dilution) or goat (Abcam, 6566; 1:5000 dilution) secondary antibodies, and bound antibodies visualized using Pierce ECL reagent (ThermoFisher Scientific).
RNA isolation and quantitative real-time PCR
Total RNA was isolated with the PureLink® RNA Mini kit (Life technologies). RNA was reverse transcribed into cDNA using a High-Capacity cDNA Reverse Transcription Kit (Life technologies). The relative levels of transcripts compared to the control RPL-19 were determined by quantitative real time PCR using SYBER® Green PCR Master Mix (Life technologies) and specific primers on a 7500 Fast Real Time PCR System (Applied Biosystems, Life technologies). Amplification was performed at 95°C for 10 min, followed by 40 cycles of 15 sec at 95°C and 1 min at 60°C.
Humans: RPL19 : Ribosomal protein L19 : Fw: 5’ - attggtctcattggggtctaac - 3’, Rv: 5’ - agtatgctcaggcttcagaaga - 3’; P5CS : Pyrroline-5-carboxylate synthase : Fw: 5’ - agtcccccttcgcatttagt - 3’, Rv: 5’ - aagctgcaagcatctggaat- 3’; P4HA1 : Prolyl 4-hydroxylase subunit alpha-1 : Fw: 5’ - caaaaccaaggctgagccga - 3’, Rv: 5’ - tttcatagccagagagccagg - 3’; P4HA2 : Prolyl 4-hydroxylase subunit alpha-2 : Fw: 5’ - tggagtgagataacgtgcctg - 3’, Rv: 5’ - gtcacagagggaagtgtctgg - 3’; P4HA3 : Prolyl 4-hydroxylase subunit alpha-3 : Fw: 5’ - ggcactgttttggtggaacc - 3’, Rv: 5’ - acttgttggccacccactta - 3’; GDH : Glutamate dehydrogenase : Fw: 5’ - acagtgggctgaaaacatcc - 3’, Rv: 5’ - atcaccaggttaagccatgc - 3’; ALT2 : Mitochondrial alanine aminotransferase : Fw: 5’ - accccgacaacatctacctg - 3’, Rv: 5’ - atcatcacacctgtccgtga - 3’.
Mouse: Alt2: forward, 5′-ATGTGGCAGCCTTTATCACC-3′; reverse, GACCAGGAGCTTCAGGATTG-3′. P4ha1: forward, 5′-CTTTCCTGACTTGGGAGCTG-3′; reverse; 5′-CTTCCGTTGTTCCACAAGGT-3′. Rpl19: forward, CAGGCATATGGGCATAGGGAA; reverse 5′-TGCCTTCAGCTTGTGGATGT-3′.
Mass Spectrometry analysis
The quenching and extraction procedure of 3D spheroids was performed as described before13, 15. Pseudo labeling steady state after 5 days of labeling was verified experimentally (Extended Data Figure 10f, g). Metabolite abundances and 13C labeling patterns were either analyzed with gas or liquid chromatography mass spectrometry. Metabolites for gas chromatography mass spectrometry analysis were extracted, derivatized and measured as described before18. Metabolites for liquid chromatography mass spectrometry analysis were derivatized and measured as described before13. In brief, metabolites were resuspended in 60% acetonitrile. Metabolites were measured using a 1290 Infinity II HPLC (Agilent) coupled to a 6470 triple quadrupole mass spectrometer (Agilent). Samples were injected onto an iHILIC®-Fusion(P) column with the above-mentioned solvents. The solvent, composed of acetonitrile and ammonium acetate (pH=9.3, 10 mM), was used at a flow rate of 0.100 ml per min. Data analysis was performed with MSD Chemstation Data Analysis (vE.02.0.2.1431) or Agilent MassHunter (vB.0802 Build 8.2.8260.0) followed by an inhouse developed Matlab script.
Hydroxylated collagen and collagen stability
We assessed hydroxylated collagen based on measuring the total hydroxyproline (OH-proline) content. This assumes that the majority of the total hydroxyproline originates from collagen. Hydroxyproline content was quantified by a colorimetric protocol as described by Creemers et al19. Spheroids or extracts from tissue were washed once in PBS and hydrolyzed for 3.5 hours at 135°C in 6 N HCl. Thereafter, samples were vacuum-evaporated and dissolved in demineralized water. Hydroxyproline residues were oxidized by adding chloramine-T (Sigma-Aldrich), followed by the addition of Ehrlich’s aldehyde reagent (mixture of p-dimethylaminobenzaldehyde, n-propanol and perchloric acid) and incubation of the samples at 65°C for chromophore development. A standard curve was made to calculate the absolute amount of hydroxyproline per sample, which was finally normalized to the protein content of a parallel sample (spheroids) or the same sample (tissue) determined by a BCA protein assay.
To assess collagen stability via resistance to MMP-mediated degradation, breast cancer spheroids were incubated with MMP 8 (0.4 ng per µl; Bio-Techne) for 24 hours at 37°C prior to hydrolysis of cells and supernatant. Subsequently, the hydroxyproline (OH-proline) content of the cells and the supernatant was measured as described above.
Total synthesis of collagen and protein
Total collagen and protein synthesis was quantified by incubating cells with 20 uCi/ml L-2,3,4,5-3H proline (PerkinElmer), as described before20. Briefly, after overnight labelling, cells were lysed in extraction buffer (11% acetic acid in H2O with 0.25% BSA) and collagenous proteins were precipitated by the addition of 20% trichloroacetic acid. Radioactivity was determined by liquid scintillation counting, and normalized for protein content.
Protein synthesis
Protein synthesis was analyzed using the Click-iT® HPG Alexa Fluor® 488 Protein Synthesis Assay Kit (ThermoFisher Scientific) according to the manufacturer’s instructions. Briefly, tumor spheroids were incubated with 50 µM Click-iT® HPG overnight in culture medium. Breast cancer spheroids were then fixed with 3.7% formaldehyde for 15 minutes at room temperature, washed and permeabilized with 0.5% Triton X-100 for 20 minutes at room temperature. Subsequently, cells were incubated with Click-iT® reaction cocktail for 30 minutes at room temperature protected from light, washed, and fluorescence was detected by flow cytometry. This assay assumes that the majority of methionine is incorporated into non-collagen protein.
In vivo pharmacologic, genetic inhibition and metabolism
All animal experiments were approved by the local authorities in compliance with all relevant ethical regulations (including but not limited to tumor size). For injection models, mice were randomized before injection of cancer cells. All samples were analyzed blinded. Sample size was determined using power calculations with B=0.8 and P<0.05 based on preliminary data and in compliance with the 3R system: Replacement, Reduction, Refinement.
Six weeks old female BALB/c mice were inoculated with 4T1 or EMT6.5 cells either into the mammary fat pad (m.f.; 1x10⁶ cells) or intravenously (i.v.; 1x10⁵ cells). α-cyano-4-hydroxycinnamic acid treatment was started after four days when the primary tumor nodule was established and palpable. 60 mg per kg of α-cyano-4-hydroxycinnamic acid was injected daily intraperitoneal to cancer bearing mice. α-cyano-4-hydroxycinnamic acid was dissolved in a mix containing 1.5% DMSO, 60% β-cyclodextrin, 35% polyethylene glycol (PEG) and 5% ethanol and pH neutralized with NaOH. The same mix without drug was injected as a vehicle to control animals. α-ketoglutarate was injected daily intraperitoneal at the concentration of 50 mg per kg. Treated and control mice were randomly chosen. Mice were sacrificed after 16 days of treatment. 4T1 MCT2 gRNA m.f. and EMT6.5 MCT2 gRNA m.f. models were sacrificed after 28 days. All i.v. injected models were sacrificed after 10 days. MCT2 gRNA 2 and ALT2 shRNA 1 were used for in vivo experiments. The animal study complies with ethical regulation and was approved by the KU Leuven ethics committee.
Metabolites were harvested, extracted and analyzed as described before21. Metabolites in the blood plasma were measured in the 4T1 m.f. model after 16 days of treatment with α-cyano-4-hydroxycinnamic acid (60 mg per kg; started 5 days post primary tumor initiation) or vehicle (Figure 4a left and middle panel). α-ketoglutarate in the metastasis tissues was measured in the 4T1 m.f. model after 2 days of treatment with α-cyano-4-hydroxycinnamic acid (60 mg per kg; started 18 days post primary tumor initiation; Figure 4a right panel). Hydroxyproline was measured in the metastasis tissues after 16 days of treatment with α-cyano-4-hydroxycinnamic acid (60 mg per kg; started 5 days post primary tumor initiation) and/or α-ketoglutarate (50 mg per kg; started 5 days post primary tumor initiation) or vehicle (Figure 4b, left panel; Figure 4d). Moreover, hydroxyproline was measured 28 days (Figure 4b, right panel m.f. model) or 10 days (Figure 4b, right panel i.v. model; Figure 4f) post-injection of genetically modified cells. Mice were sacrificed using nembutal, the breast tumors and lung metastases were placed in cold saline, dissected in less than 3 min, and immediately frozen using a liquid nitrogen cooled Biosqueezer (Biospec Products). The tissue was weighed (10-15 mg) and pulverized (Cryomill, Retsch) under liquid nitrogen conditions. The pulverized tissue was used to measure α-ketoglutarate and hydroxyproline as described above. 20 μL of blood plasma were extracted and analyzed as described above. Humane endpoints were determined as follows: Tumor size of 2 cm3. Following additional symptoms were monitored and upon detection of one of the symptoms the animal was euthanized: Loss of ability to ambulate, labored respiration, surgical infection or weight loss over 10 % of initial body weight. Housing and experimental animal procedures were approved by the Institutional Animal Care and Research Advisory Committee of the KU Leuven, Belgium.
Picro-Sirius Red and hematoxylin and eosin staining
Treatment were performed as described above, i.e. pharmacological MCT2 inhibition was initiated upon palpable primary tumor, while genetic MCT2 inhibition was present already during tumor initiation. Tissues were harvested at the same time points as described above. For the Sirius Red and hematoxylin and eosin (H&E) staining of pulmonary metastasis, dissected lung samples were gently infused via the trachea with 10% formalin and then processed as previously described. 5 µm thick sections obtained from the resulting paraffin blocks were stained with either Picro-Sirius Red or H&E. As Picro-Sirius Red stains thinner fibers in green and thicker fibers in red and collagen III are thinner than collagen I the assumption is that green is mainly collagen III while red is mainly collagen I. Picro-Sirius Red slides were analyzed with polarized microscope Imager M2 Carl Zeiss at 20X magnification. Enough images were acquired for each metastasis to cover the whole metastatic area, then GNU Image Manipulation Program (GIMP 2.10.8) was used to manually stitch all images belonging to the same metastasis together. The composite images were analyzed with ImageJ 1.45. Briefly, the polarized light images were split by RGB (red, green, blue), then the signal in the green and red channels was quantified. Only metastases with similar size were analyzed. One to four similar sized metastases per mouse were analyzed. Native collagen and highly vascularized metastases were excluded from the analysis.
Metastatic area and metastases number were quantified by ZEN blue software (2011). Metastatic index was calculated by dividing the metastatic area by the primary tumor weight. Only mice with a primary tumor of 0.8 g or greater were analyzed. All i.v. injected animals were analyzed. The animal study complies with ethical regulation and was approved by the KU Leuven ethics committee.
Statistical Analysis and software
Statistical data analysis was performed using GraphPad Prism version 7.0 (GraphPad Software Inc., CA, USA) on n≥3 biological replicates. Details on statistical tests and post-tests are presented in the figure legends. In brief, two-tailed unpaired student’s T-tests were performed on n≥3 biological replicates. Two-way Anova was performed in Figure 3a as described in the correspondent figure legend. Sample size for all experiments was chosen empirically. Independent experiments were pooled and analyzed together whenever possible as detailed in figure legends. Detection of outliers was performed using Grubb’s test in GraphPad. All graphs show mean +/- standard deviation or standard error of the mean as indicated in the figure legends.
Extended Data
Extended Data Figure 1. Pyruvate is required for 3D but not 2D growth of breast cancer cells.
(a-b) Growth curves (2D, left panels) and representative pictures (3D, right panels) of human MCF10A H-RasV12 and mouse 4T1 cells cultured in media with or without pyruvate or glucose or glutamine.
(c) Representative pictures of MCF10A H-RasV12 and MCF10A spheroids in the presence or absence of pyruvate or 0.5% supplemented ECM (Matrigel). Analysis was performed at day 5. Scale bar: 150 µm.
(d) Cellular pyruvate, α-ketoglutarate and hydroxyproline metabolism. Enzymes are depicted in italics. ALT2 refers to mitochondrial alanine aminotransferase. GDH refers to glutamate dehydrogenase. MCT2 refers to monocarboxylate transporter 2. MPC refers to mitochondrial pyruvate carrier. P4HA refers to collagen prolyl-4-hydroxylase. OH-proline refers to hydroxyproline. Only selected reactions are depicted.
The number of biological replicates for each experiment was n=3. Error bars represent SD of mean from biological independent samples. Scale bar: 150 μm.
Extended Data Figure 2. Pyruvate depletion does not affect collagen synthesis.
(a) Total collagen + protein synthesis (left panel) as well as protein synthesis (right panel) in human and mouse breast cancer spheroids with and without pyruvate. Total collagen + protein synthesis was assessed by incorporation of radioactive proline into collagen and protein, while sole protein synthesis was assessed by fluorescent labeled methionine incorporation into protein. The latter is more specific towards protein synthesis since methionine is only to a minor extent incorporated into collagen. Changes that occur in both parameters indicate alterations in protein synthesis, while changes that occur only in total collagen + protein synthesis indicate alterations in collagen synthesis. Our data indicate that collagen synthesis was not altered by pyruvate depletion, because either total collagen + protein synthesis is not altered or both parameters are altered to a similar extent in the tested cell lines. n=3.
(b) Relative collagen I and III abundance and representative 3D reconstruction in human MCF10A H-RASV12 and mouse 4T1 breast cancer spheroids with and without pyruvate measured by immunofluorescence. n=5. Collagen I/III are major collagen species in breast cancer22. Blue indicates DAPI-stained nuclei, red indicates collagen I, and green indicates collagen III. The total fluorescence intensity was measured in each microscopy field and normalized over cell number, scored as number of DAPI-stained nuclei. Five microscopy fields were averaged for each sample. Relative fluorescence intensities per cell are depicted, normalized to control condition. Solid line indicates median, the box extends are the 25th to 75th percentiles, the whiskers span between the smallest and the largest value.
Error bars represent SD of mean from biological independent samples unless otherwise noted. Two-tailed unpaired student’s T-test.
Extended Data Figure 3. Pyruvate drives collagen hydroxylation.
(a) Pyruvate, lactate and glucose uptake/secretion in human MCF10A H-RASV12 breast cancer spheroids treated with MCT2 inhibitor (α-cyano-hydroxycinnamic acid; 1.5mM). This data show that the used inhibitor impairs pyruvate uptake, but not lactate or glucose secretion and uptake, respectively.
(b-c) Hydroxylated collagen assessed via measurement of hydroxyproline (OH-proline) in human (MCF10A H-RASV12, MCF7, HCC70) and mouse (4T1) breast cancer spheroids treated with a MCT2 inhibitor (α-cyano-hydroxycinnamic acid; 1.5 mM), or treated with the MPC inhibitor UK5099 (50 μM) in the presence of pyruvate.
The number of biological replicates for each experiment was n=3. Error bars represent SD of mean from biological independent samples. Two-tailed unpaired student’s T-test.
Extended Data Figure 4. Pyruvate drives collagen hydroxylation via α-ketoglutarate.
(a) Heat map representing metabolite changes in MCF10A H-RasV12 spheroids in the presence or absence of pyruvate measured by mass spectrometry. Blue indicates significantly reduced metabolites upon pyruvate depletion. n=3.
(b) Intracellular abundance of pyruvate, α-ketoglutarate (α-KG), citrate and malate in human MCF10A H-RASV12 breast cancer spheroids with and without pyruvate. n=3.
(c) Hydroxylated collagen assessed via measurement of hydroxyproline (OH-proline) in MCF10A H-RasV12 spheroids in the presence or absence of pyruvate upon addition of either lactate (2 mM), alanine (2 mM), glutamate (2 mM) or cell permeable α-ketoglutarate (dimethyl 2-oxoglutarate; α-KG; 1.5 mM). n=3.
(d) Intracellular abundance of α-ketoglutarate (α-KG), citrate and malate in human MCF10A H-RASV12 breast cancer spheroids upon supplementation of cell permeable α-KG (dimethyl 2-oxoglutarate; 1.5 mM), citrate (5 mM) or malate (5 mM). n=3.
(e) Relative change in hydroxylated collagen assessed via measurement of hydroxyproline (OH-proline) in human (MCF10A, MCF7, HCC70) and mouse (4T1, EMT6.5) breast cancer spheroids in the absence of pyruvate with or without cell permeable α-ketoglutarate (dimethyl 2-oxoglutarate; α-KG; 1.5 mM). Data are normalized to controls. Dashed line indicates the level of hydroxylated collagen in control conditions with pyruvate. n=3 for MCF10A and EMT6.5; n=6 for MCF7 and HCC70; n=9 for MCF10A H-RasV12 and 4T1.
(f) Relative change in hydroxylated collagen assessed via measurement of hydroxyproline (OH-proline) in MCF10A H-RASV12 spheroids treated with the MCT2 inhibitor α-cyano-4-hydroxycinnamic acid (1.5 mM) upon addition of cell permeable α-ketoglutarate (dimethyl 2-oxoglutarate; α-KG; 1.5 mM) in the presence of pyruvate. Data are normalized to control. Dashed line indicates the level of hydroxylated collagen in control condition. n=3.
Error bars represent SD of mean from biological independent samples. Two-tailed unpaired student’s T-test.
Extended Dataure Fig 5. Pyruvate to alanine conversion drives α-ketoglutarate production.
(a) Carbon contribution of 13C5 glutamine, 13C6 glucose, and 13C3 pyruvate to alanine and α-ketoglutarate (α-KG) assessed by 13C tracer analysis. n=3.
(b) Alanine uptake/secretion in MCF10A H-RasV12 spheroids with and without pyruvate measured by the mass spectrometry analysis of the media. n=3.
(c-f) Intracellular abundance of α-ketoglutarate (α-KG) and hydroxylated collagen in human and mouse breast cancer spheroids upon treatment with the transaminase inhibitor aminooxyacetate (AOA; 0.8 mM), the glutamate dehydrogenase inhibitor epigallocatechin gallate (EGCG; 50 µM), transduced with a lentiviral vector with shRNA for either mitochondrial ALT2 (KD), GDH (KD) or scrambled control sequence in the presence of pyruvate. n=3 for EGCG and AOA treatment (c-d); n=9 for control shRNA, n=6 for GDH shRNA 1 and 2 and n=3 for ALT2 shRNA1 and 2 (MCF10A H-RasV12, e-f); n=3 for control shRNA and ALT2 shRNA 1 and 2 (4T1, e-f). In case ALT activity majorly contributs to α-ketoglutarate generation, ECGC (which inhibits the pyruvate independent conversion of glutamate to α-ketoglutarate via the enzyme glutamate dehydrogenase (GDH)), should have a minor effect on α-ketoglutarate abundance and hydroxylated collagen. Indeed, we found that this was the case.
Error bars represent SD of mean from biological independent samples. Two-tailed unpaired student’s T-test.
Extended Data Figure 6. α-ketoglutarate metabolically regulates P4HA activity in cancer cells.
(a) Schematic representation of the metabolic regulation and carbon donor mechanisms by which α-ketoglutarate can regulate collagen hydroxylation. Solid lines indicate metabolite conversion, while dashed lines indicate metabolic regulation. Enzymes are depicted in italics. P4HA refers to collagen prolyl-4-hydroxlase. P5CS refers to pyrroline-5-carboxylate synthase.
(b-c) Relative change in intracellular abundance of proline and hydroxylated collagen in MCF10A H-RasV12 spheroids transduced with a lentiviral vector with shRNA for either P5CS (KD) or scrambled control sequence with or without cell permeable α-ketoglutarate (dimethyl 2-oxoglutarate; α-KG; 1.5 mM) in the presence or absence of pyruvate normalized to control condition. If the carbon donor mechanism occurs, it is expected that proline abundance decreases in P5CS knockdown spheroids and that they no longer respond to the α-ketoglutarate rescue upon pyruvate depletion. However, we observed that proline abundance did not significantly change in P5CS knockdown spheroids. Moreover, α-ketoglutarate addition still significantly increased hydroxylated collagen to a similar extent as pyruvate. n=3 (b); n=6 (control shRNA); n=3 (P5CS shRNA 1 and 2 (c)).
(d) Hydroxylated collagen assessed via measurement of hydroxyproline (OH-proline) in human (myo)fibroblasts in presence or absence of pyruvate with or without cell permeable α-ketoglutarate (dimethyl 2-oxoglutarate; α-KG; 1.5 mM) and/or cell permeable succinate (dimethyl succinate; 1.5 mM). n=3 (human primary skin-derived fibroblasts); n=4 (human immortalized mammary and cancer associated myofibroblasts).
(e) Hydroxylated collagen assessed via measurement of hydroxyproline (OH-proline) in human (myo)fibroblasts treated with the MCT2 inhibitor α-cyano-4-hydroxycinnamic acid (1.5 mM), the MPC inhibitor UK5099 (50 μM) or the transaminase inhibitor AOA (0.8 mM) in the presence of pyruvate. n=3.
(f) Intracellular abundance of α-ketoglutarate (α-KG) in the presence or absence of pyruvate in human fibroblasts. n=3.
Error bars represent SD of mean from biological independent samples. Two-tailed unpaired student’s T-test.
Extended Data Figure 7. Metabolic regulation of P4HA activity is independent of it's known transcriptional regulation.
(a) Absolute levels of P4HA1, P4HA2 and P4HA3 in human MCF10A H-RASV12 breast cancer spheroids in presence of pyruvate.
(b) Relative change in P4HA1 expression upon pyruvate depletion as well as P4HA1 overexpression (OE) in normoxia, P4HA1 expression in hypoxia (1 % oxygen), upon 12 ng per ml TGFβ addition and 50 µM IOX2 treatment normalized to the control condition with pyruvate.
(c) Relative P4HA1 expression in human (MCF7, HCC70) and mouse (4T1) breast cancer spheroids in the presence (normoxia) or absence (hypoxia (1 % oxygen); IOX2 (50 µM); TGFβ (12 ng per ml)) of pyruvate normalized to the normoxia condition with pyruvate.
(d) Hydroxylated collagen assessed via measurement of hydroxyproline (OH-proline) in human (MCF10A H-RasV12, MCF7, HCC70) and mouse (4T1) breast cancer spheroids treated with TGFβ (12 ng per ml) or IOX2 (50 µM) with or without pyruvate or upon addition of cell permeable α-ketoglutarate (dimethyl 2-oxoglutarate; α-KG; 1.5 mM).
The number of biological replicates for each experiment was n=3. Error bars represent SD of mean from biological independent samples. Two-tailed unpaired student’s T-test.
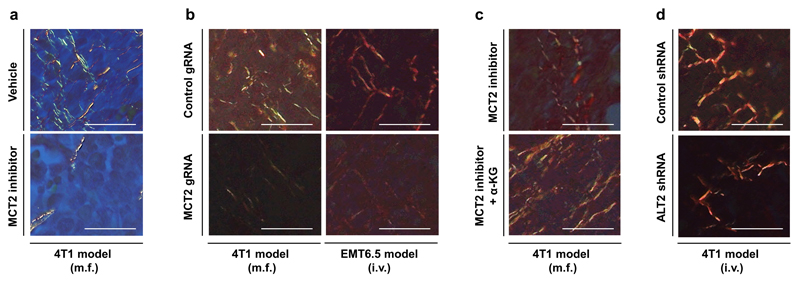
Extended Data Figure 8. Functional collagen deposition decreases in the lung metastatic niche upon pyruvate metabolism inhibition.
Representative pictures of functional collagen of lung metastases tissue based on Picro-Sirius Red staining and polarized light microscopy. Red predominantly indicates tick collagen I fibers and green predominately indicates thin collagen III fibers.
(a) 4T1 model (m.f.) upon pharmacologic inhibition of MCT2 (α-cyano-4-hydroxycinnamic acid; 60 mg per kg, i.p.).
(b) 4T1 (m.f.) and EMT6.5 (i.v.) model upon genetic inhibition of MCT2.
(c) 4T1 model (m.f.) upon pharmacologic inhibition of MCT2 (α-cyano-4-hydroxycinnamic acid; 60 mg per kg, i.p.) with or without treatment with cell permeable α-ketoglutarate (dimethyl 2-oxoglutarate; α-KG; 50 mg per kg; i.p.).
(d) 4T1 model (i.v.) upon genetic inhibition of ALT2.
m.f. refers to mammary fat pad injection. i.v. refers to intra venous injection. i.p. refers to intra peritoneal injection. Scale bar: 50 μm.
Extended Data Figure 9. Metastatic burden decreases independently of primary tumor volume upon pyruvate metabolism inhibition.
(a) Primary tumor volume over time and final tumor weight upon pharmacologic inhibition of MCT2 (α-cyano-4-hydroxycinnamic acid, 60 mg per kg, i.p.) with or without treatment with cell permeable α-ketoglutarate (dimethyl 2-oxoglutarate; α-KG; 50 mg per kg; i.p.) in the 4T1 model (m.f.). n=23 (vehicle, 3 cohorts), n=24 (MCT2 inhibitor, 2 cohorts), n=10 (MCT2 inhibitor + αKG).
(b) Primary tumor volume over time and final tumor weight upon genetic inhibition of MCT2 in the 4T1 model (m.f.). n=11 (4T1 control), n=7 (4T1 MCT2 gRNA).
(c) Representative pictures of lung metastases tissue upon genetic inhibition of MCT2 in the 4T1 model (m.f.) based on Hematoxylin and Eosin staining.
(d) Representative pictures of lung metastases tissue upon genetic inhibition of MCT2 in the EMT6.5 model (i.v.) based on Hematoxylin and Eosin staining.
(e) Representative pictures of lung metastases tissue upon genetic inhibition of ALT2 in the 4T1 model (i.v.) based on Hematoxylin and Eosin staining.
(f) Representative pictures of lung metastases tissue upon pharmacologic inhibition of MCT2 (α-cyano-4-hydroxycinnamic acid; 60 mg per kg; i.p.) with or without treatment with cell permeable α-ketoglutarate (dimethyl 2-oxoglutarate; α-KG; 50 mg per kg; i.p.) in the 4T1 model (m.f.) based on Hematoxylin and Eosin staining.
The much milder impact of MCT2 inhibition compared to the previously described P4HA inhibition2 on primary tumor growth could be explained by our previous observation that pyruvate is less available to primary breast cancers than to lung metastases6.
m.f. refers to mammary fat pad injection. i.v. refers to intra venous injection. i.p. refers to intra peritoneal injection. Arrow heads indicate metastases tissue. Error bars represent SEM of mean from different mice. Two-tailed unpaired student’s T-test. Scale bar: 0.5 cm.
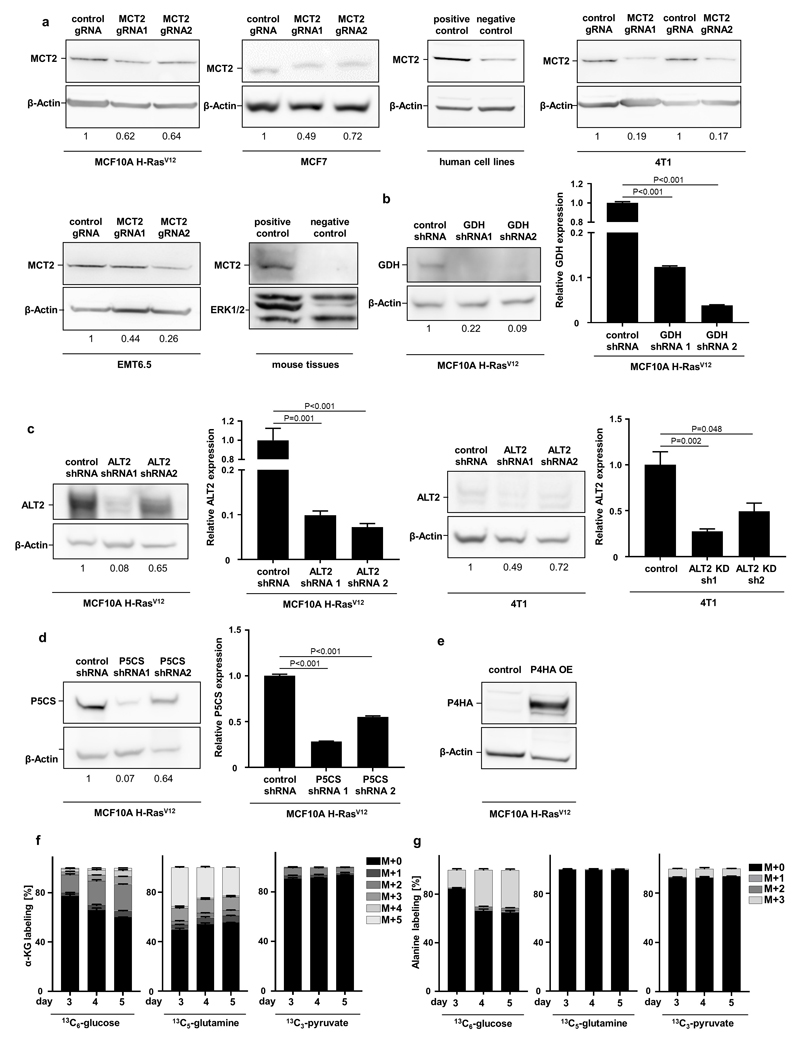
Extended Data Figure 10. Protein and RNA expression of genetically modified breast cancer cells.
(a) Western blot analysis for MCT2 in human (MCF10A H-RASV12, MCF7) and mouse (4T1, EMT6.5) breast cancer cells infected with either a control gRNA or two different MCT2 gRNA normalized to control condition. Human positive/negative control: H460/MDA-MB-468; mouse positive/negative control: testis/lung.
(b) Western blot analysis and relative gene expression for GDH in human MCF10A H-RASV12 breast cancer cells infected with either a control shRNA or two different GDH shRNA normalized to control condition.
(c) Western blot analysis and relative gene expression for ALT2 in human (MCF10A H-RASV12) and mouse (4T1) breast cancer cells infected with either a control shRNA or two different ALT2 shRNA normalized to control condition.
(d) Western blot analysis and relative gene expression for P5CS in human MCF10A H-RASV12 breast cancer cells infected with either a control shRNA or two different P5CS shRNA.
(e) Western blot analysis for P4HA in human MCF10A H-RASV12 breast cancer cells infected with either a control or an overexpressing P4HA vector.
(f-g) Time resolved contribution of 13C6-glucose, 13C5-glutamine and 13C3-pyruvate to α-ketoglutarate (α-KG) and alanine in human MCF10A H-RASV12 breast cancer spheroids.
The number of biological replicates for each experiment was n=3. Error bars represent SD of mean from biological independent samples. Two-tailed unpaired student’s T-test. For gel source data, see Supplementary Figure 1.
Supplementary Material
Acknowledgments
We thank Prof. Peter Carmeliet for providing shP5CS constructs, Prof. Ludo Van Den Bosch and Prof. Akira Orimo for providing (myo)fibroblasts, Prof. Jim Norman, Dr. Bianca Hemmeryckx, Dr. Fabio Stanchi, Dr. Liz Allen and Prof. Gabriele Bergers for their advice, Dr. Dimitrios Anastasiou for providing reagents, Dr. David Nittner (VIB histology core) for performing IHC staining, Prof. Robin Anderson for providing EMT6.5 cells. S.S. and MR are supported by FWO postdoctoral fellowships. MvG and GD are supported by Kom op tegen Kanker fellowships. S.-M.F. acknowledges funding from the European Research Council under the ERC Consolidator Grant Agreement n. 771486–MetaRegulation, FWO – Odysseus II, FWO – Research Grants and Projects, and KU Leuven – Methusalem Co-Funding.
Footnotes
Data availability
The authors declare that all data supporting the findings of this study are available within the article, its extended data files, source data or from the corresponding author upon reasonable request.
Authors Contribution
I.E. performed most experiments and analyzed all data. Key in vitro experiments were reproduced by MvG, MR, CE-N. M.R. helped with microscopy analysis, fibroblasts and western blot analysis. D.B. and G.D. helped with western blot analysis and/or in vivo experiments. M.v.G. performed the imaging of the tissue sections and helped with in vitro sample collection. S.S. and S.T. performed OH-proline measurements and collagen synthesis measurements. R.B and C.V helped with CRISPR and OE construct designs. C.E-N. performed the experiment with the HCC70 cell line. E.V. helped with the interpretation of in vivo ECM remodeling data. G.C. provided advice on ECM remodeling. I.E. and S.-M.F. designed the study and wrote the manuscript. S.-M.F. conceived and supervised the study.
Author Information
The authors declare to have no financial or non-financial competing interest. SMF has received research funding from Bayer AG and Merck.
References
- 1.Bonnans C, Chou J, Werb Z. Remodelling the extracellular matrix in development and disease. Nat Rev Mol Cell Biol. 2014;15:786–801. doi: 10.1038/nrm3904. [DOI] [PMC free article] [PubMed] [Google Scholar]
- 2.Gilkes DM, et al. Collagen Prolyl Hydroxylases are Essential for Breast Cancer Metastasis. Cancer research. 2013;73:3285–3296. doi: 10.1158/0008-5472.CAN-12-3963. [DOI] [PMC free article] [PubMed] [Google Scholar]
- 3.Xiong G, Deng L, Zhu J, Rychahou PG, Xu R. Prolyl-4-hydroxylase α subunit 2 promotes breast cancer progression and metastasis by regulating collagen deposition. BMC cancer. 2014;14:1. doi: 10.1186/1471-2407-14-1. [DOI] [PMC free article] [PubMed] [Google Scholar]
- 4.Elia I, Fendt S-M. In vivo cancer metabolism is defined by the nutrient microenvironment. Translational Cancer Research. 2016;5:S1284–S1287. [Google Scholar]
- 5.Elia I, Doglioni G, Fendt S-M. Metabolic Hallmarks of Metastasis Formation. Trends in Cell Biology. 2018 doi: 10.1016/j.tcb.2018.04.002. [DOI] [PubMed] [Google Scholar]
- 6.Christen S, et al. Breast cancer-derived lung metastasis show increased pyruvate carboxylase-dependent anaplerosis. Cell Reports. 2016;17:837–848. doi: 10.1016/j.celrep.2016.09.042. [DOI] [PubMed] [Google Scholar]
- 7.Shinde A, Wilmanski T, Chen H, Teegarden D, Wendt MK. Pyruvate carboxylase supports the pulmonary tropism of metastatic breast cancer. Breast cancer research : BCR. 2018;20:76. doi: 10.1186/s13058-018-1008-9. [DOI] [PMC free article] [PubMed] [Google Scholar]
- 8.Faubert B, et al. Lactate Metabolism in Human Lung Tumors. Cell. 2017;171:358–371.e359. doi: 10.1016/j.cell.2017.09.019. [DOI] [PMC free article] [PubMed] [Google Scholar]
- 9.Buescher JM, et al. A roadmap for interpreting 13C metabolite labeling patterns from cells. Current Opinion in Biotechnology. 2015;34:189–201. doi: 10.1016/j.copbio.2015.02.003. [DOI] [PMC free article] [PubMed] [Google Scholar]
- 10.Lorendeau D, Christen S, Rinaldi G, Fendt S-M. Metabolic control of signaling pathways and metabolic auto-regulation. Biology of the Cell. 2015;107:251–272. doi: 10.1111/boc.201500015. [DOI] [PubMed] [Google Scholar]
- 11.Gilkes DM, Semenza GL, Wirtz D. Hypoxia and the extracellular matrix: drivers of tumour metastasis. Nature reviews Cancer. 2014;14:430–439. doi: 10.1038/nrc3726. [DOI] [PMC free article] [PubMed] [Google Scholar]
- 12.Stegen S, et al. HIF-1α metabolically controls collagen synthesis and modification in chondrocytes. Nature. 2019;565(7740):511–515. doi: 10.1038/s41586-019-0874-3. [DOI] [PMC free article] [PubMed] [Google Scholar]
- 13.Elia I, et al. Proline metabolism supports metastasis formation and could be inhibited to selectively target metastasizing cancer cells. Nature communications. 2017;8 doi: 10.1038/ncomms15267. 15267. [DOI] [PMC free article] [PubMed] [Google Scholar]
- 14.Kojima Y, et al. Autocrine TGF-β and stromal cell-derived factor-1 (SDF-1) signaling drives the evolution of tumor-promoting mammary stromal myofibroblasts. Proceedings of the National Academy of Sciences of the United States of America. 2010;107:20009–20014. doi: 10.1073/pnas.1013805107. [DOI] [PMC free article] [PubMed] [Google Scholar]
- 15.van Gorsel M, Elia I, Fendt S-M. 13C tracer analysis and metabolomics in 3D cultured cancer cells. Methods in Molecular Biology. 2019;1862 doi: 10.1007/978-1-4939-8769-6_4. [DOI] [PubMed] [Google Scholar]
- 16.Mandegar MA, et al. CRISPR Interference Efficiently Induces Specific and Reversible Gene Silencing in Human iPSCs. Cell stem cell. 2016 doi: 10.1016/j.stem.2016.01.022. [DOI] [PMC free article] [PubMed] [Google Scholar]
- 17.Gilbert LA, et al. Genome-Scale CRISPR-Mediated Control of Gene Repression and Activation. Cell. 2014;159:647–661. doi: 10.1016/j.cell.2014.09.029. [DOI] [PMC free article] [PubMed] [Google Scholar]
- 18.Lorendeau D, et al. Dual loss of succinate dehydrogenase (SDH) and complex I activity is necessary to recapitulate the metabolic phenotype of SDH mutant tumors. Metab Eng. 2016 doi: 10.1016/j.ymben.2016.11.005. S1096-7176(1016)30217-30218. [DOI] [PubMed] [Google Scholar]
- 19.Creemers LB, Jansen DC, van Veen-Reurings A, van den Bos T, Everts V. Microassay for the assessment of low levels of hydroxyproline. Biotechniques. 1997;22:656–658. doi: 10.2144/97224bm19. [DOI] [PubMed] [Google Scholar]
- 20.Sunic D, Belford DA, McNeil JD, Wiebkin OW. Insulin-like growth factor binding proteins (IGF-BPs) in bovine articular and ovine growth-plate chondrocyte cultures: their regulation by IGFs and modulation of proteoglycan synthesis. Biochim Biophys Acta. 1995;1245:43–48. doi: 10.1016/0304-4165(95)00076-n. [DOI] [PubMed] [Google Scholar]
- 21.Broekaert D, Fendt S-M. Measuring in vivo tissue metabolism using 13C glucose infusions in mice. Methods in Molecular Biology. 2019;1862 doi: 10.1007/978-1-4939-8769-6_5. [DOI] [PubMed] [Google Scholar]
- 22.Oskarsson T. Extracellular matrix components in breast cancer progression and metastasis. The Breast. 2013;22(Supplement 2):S66–S72. doi: 10.1016/j.breast.2013.07.012. [DOI] [PubMed] [Google Scholar]
Associated Data
This section collects any data citations, data availability statements, or supplementary materials included in this article.


