

Abstract
While the benefit of prostate specific antigen (PSA) based screening is uncertain, a significant proportion of screen-detected cases is overdiagnosed. In order to make screening worthwhile, it is necessary to find policies that minimize overdiagnosis, without significantly increasing prostate cancer mortality (PCM). Using a micro simulation model (MISCAN) we project the outcomes of 83 screening policies in the US population, with different start and stop ages, screening frequencies, strategies where the PSA value changes the screening frequency, and strategies in which the PSA threshold (PSAt) increases with age. In the basecase strategy, yearly screening 50-74 with a PSAt of 3, the lifetime risk of PCM and overdiagnosis equals respectively, 2.4% and 3.8%. The policies that reduce overdiagnosis the most (for maximum PCM increases relative to base case of 1%, 3% and 5%, respectively) are with a PSAt of 3, (1) yearly screening 50-74 where, if PSA < 1 at age 65 or older, frequency becomes 4 years, with 3.6% (5.9% reduction), (2) 2-year screening 50-72, with 2.9% (24.3% reduction) and (3) yearly screening 50-70 (PSAt of 4 after age 66), with 2.2% (43.4% reduction). Stopping screening at age 70 is a reasonable way to reduce the harms and keep the benefit. Decreasing the stopping age has a larger effect on overdiagnosis reduction than reducing the screen frequency. Screening policies where the frequency of screening depends on PSA result or in which the PSAt changes with age did not substantially improve the balance of harms and benefits relative to simple yearly screening.
Introduction
There is not yet a consensus about the magnitude of the net benefit of early detection of prostate cancer, since the two largest prostate cancer screening randomized controlled trials found conflicting results. In the Prostate, Lung, Colorectal and Ovarian (PLCO) screening trial, after 13 years of follow-up, it was found that annual PSA screening does not reduce prostate cancer mortality.1 On the other hand, the European Randomized Study of Screening for Prostate Cancer (ERPSC) trial, after a 11-year follow-up and with mainly a 4-year screening interval, found a 20% prostate cancer mortality (PCM) reduction in comparison with no screening.2
Current guidelines in the US for prostate cancer screening reflect the lack of consensus, on what is the best trade-off between harms and benefits: the U.S. Preventive Services Task Force (USPSTF) recommended in 2012, against PSA screening, while the American Urological Association (AUA) advises in 2013 that men should be screened between the ages 55 and 69.3 Even within the organizations that are favourable to screening, different screening algorithms are proposed.4
In general, screening could result in some lives saved, with many over diagnosed cases. Overdiagnosis is the detection of cancer, where in the absence of screening, the cancers would have never been detected. There is a small chance of complications due to biopsy after an elevated PSA5. However there are significant side effects associated with treatment that have a negative effect in the quality of life 6. Overdiagnosis estimates can vary considerably depending on the methods and populations used 7, with number needed to detect between 5 and 48, and proportion of overdiagnosis in screen-detected cases varying between 22 and 67% 7-8.
In order to make PSA screening worthwhile, given the uncertainty surrounding the magnitude of the benefit of screening, and the estimates suggesting that a significant proportion of screen-detected cases is over diagnosed, there is a clear need to find screening policies with a better balance of harms and benefits. We aim to find the combination of start-stop age, screening frequency and prostate-specific antigen threshold for biopsy referral (PSAt) that minimizes overdiagnosis for several thresholds of limited PCM increase compared to screening yearly with a PSAt of 3 between ages 50 and 74.
Previously several studies 6,9 found that stopping screening at an earlier age than 70 is more cost-effective than screening until age 74. Others 10-11 found that strategies where frequency is determined by PSA result or where a higher PSAt for older are used could have better harms and benefits.
We add to Gulati et al 11 by evaluating more combinations of frequencies and stopping ages, and strategies in which the PSAt increases for older age groups. A promising new way of performing prostate cancer screening is to risk stratify men based on PSA level at a certain age 12,13. Men with a lower PSA would then be screened less frequently. What is still unclear is whether this set of policies is effectively better than simple screening algorithms, and therefore we also compare the harms and benefits of several ways of doing PSA-based risk stratification.
Few people advocate screening beyond age 75. However, Berghdal et al.14 notices that after 10 years of stopping screening in the ERPSC trial the incidence of high risk cancers in the screening group closely resembles the control (no screen) group. Therefore we also quantify the harms and benefits of screening for these older men.
Methods
Simulation Model
Micro simulation Screening Analysis (MISCAN) is a micro simulation model, which simulates individual life-histories. A detailed description is available in http://cisnet.cancer.gov/prostate/profiles.html. Each health state denotes a different disease, detection and treatment phase. There are three detection phases, preclinical, clinical and screen detected. We model 18 disease stages, consisting of the combination of 3 stages (T1, T2, T3), 3 grades (which correspond to Gleason Score 2-6, 7 and > 7) and whether or not the cancer is metastasized. In each of these disease stages, an individual can progress to a higher disease state, be clinically or screen detected, or can die.
The transition probabilities and durations, including the transitions between different stages, grades and duration until metastasized cancer are calibrated to ERSPC data. The durations between different disease states and between disease states and clinical detection are modelled as Weibull distributions with its parameters depending on T-stage and Gleason Score 15-16. Relative to our ERSPC model, there is an extra hazard of clinical detection which implies an earlier time of clinical diagnosis in the US 17.
After detection, the person is assigned to either watchful waiting, radical prostatectomy (RP) or radiation therapy (RT) with equal chance. A baseline prostate cancer survival curve is assigned, based on SEER data (1983-1986) from the pre-PSA era. The effect of treatment is introduced with a lower hazard ratio for PCM (0.62 for RP and 0.70 for RT) based on Etzioni et al 18. Additionally there is a cure rate based on the mortality reduction observed in the ERSPC trial and dependent on whether Gleason Score is lower or equal than 7 (0.42) or higher than 7 (0.23) 19.
A new feature in MISCAN, is the PSA growth generator. It resembles Inoue et al. 20, but with some important modifications (Online Supplement). The PSA growth parameters together with biopsy sensitivities are calibrated to SEER incidence data from 1990 to 2002 and to the PSA distribution of the first round of the ERSPC screening trial, except the correlation between errors in the PSA growth equation, which was calibrated to ERSPC data from different screening rounds to predict the probability that PSA < 1 about age 60 and PSA > 3 two screening rounds later.
The simulated population of ten million is based on the lifetables of Mariotto et al.21. US screening patterns are imposed, based on the screening generator of Mariotto et al. 21. Additionally we assume 100% biopsy compliance and 90% screen attendance in the base case analyses.
Up to the year 2012, we reproduce the screening patterns in the US population. Afterwards a screening policy is implemented. We accept new cohorts of men aged 50, between 2012 and 2022. Additionally, men opportunistically screened prior to 2012 and not yet diagnosed are also screened. This allows us to incorporate the effect of current screening practices in our projections.
The main outcomes are the lifetime risk of prostate cancer mortality (PCM) and overdiagnosis. Here we define overdiagnosis as a person who is screen-detected with prostate cancer, but would not be diagnosed in the absence of screening and dies from other causes.
Screening Policies
The base case screening strategy is yearly PSA testing between ages 50 and 74 with a PSAt of 3. We compute combinations of screening policies with starting ages 50, 54, 58 and 62, and stop ages 62, 66, 68, 70, 72 and 74. The frequencies used are yearly, 2-year and 4-year. In addition, we investigated yearly screening until age 80 (Table 1).
Table 1. List of screening policies by age, frequency, PSA threshold and PSA value or age dependent condition.
| Policy | Start/Stop Age | Frequencies | PSAt* | Condition |
|---|---|---|---|---|
| Basecase | ||||
|
| ||||
| 1 | 50-74 | yearly | 3 | |
|
| ||||
| Varying Start/Stop Age and Screen Frequencies | ||||
|
| ||||
| 2 | 50-62 | 2-,4-year, yearly | 3 | |
| 3 | 50-66 | 2-,4-year, yearly | 3 | |
| 4 | 50-68 | 2-year, yearly | 3 | |
| 5 | 50-70 | 2-,4-year, yearly | 3 | |
| 6 | 50-72 | 2-year, yearly | 3 | |
| 7 | 50-74 | 2-,4-year | 3 | |
| 8 | 54-62 | 2-,4-year, yearly | 3 | |
| 9 | 54-66 | 2-,4-year, yearly | 3 | |
| 10 | 54-68 | 2-year, yearly | 3 | |
| 11 | 54-70 | 2-,4-year, yearly | 3 | |
| 12 | 54-72 | 2-year, yearly | 3 | |
| 13 | 54-74 | 2-,4-year, yearly | 3 | |
| 14 | 58-66 | 2-,4-year, yearly | 3 | |
| 15 | 58-68 | 2-year, yearly | 3 | |
| 16 | 58-70 | 2-,4-year, yearly | 3 | |
| 17 | 58-72 | 2-year, yearly | 3 | |
| 18 | 58-74 | 2-,4-year, yearly | 3 | |
| 19 | 62-70 | 2-,4-year, yearly | 3 | |
| 20 | 62-74 | 2-,4-year, yearly | 3 | |
|
| ||||
| Higher PSAt by age | ||||
|
| ||||
| 21 | 50-70/72/74 | yearly | 4 | |
| 22 | 50-70/72/74 | yearly | 3 | if 66 ≤ age < 70, then PSAt = 4, if age ≥ 70 then PSAt = 5 |
| 23 | 50-70/72/74 | yearly | 4 | if 66 ≤ age < 70, then PSAt = 5, if age ≥ 70 then PSAt = 7 |
|
| ||||
| Screen Frequency and Stop Age dependent on PSA result (PSA based risk stratification) | ||||
|
| ||||
| 24 | 50-74 | yearly | 3 | if age ≥ 60 and PSA < 1 then Stop |
| 25 | 50-74 | yearly | 3 | if age ≥ 60 and PSA < 1 then frequency is 8-year |
| 26 | 50-74 | yearly | 3 | if age ≥ 60 and PSA < 1 then frequency is 4-year |
| 27 | 50-74 | yearly | 3 | if age ≥ 60 and PSA < 1 then frequency is 2-year |
| 28 | 50-74 | yearly | 3 | if age ≥ 65 and PSA < 1 then Stop |
| 29 | 50-74 | yearly | 3 | if age ≥ 65 and PSA < 1 then frequency is 4-year |
| 30 | 50-74 | yearly | 3 | if age ≥ 65 and PSA < 1 then frequency is 2-year |
| 31 | 50-74 | yearly | 3 | if age ≥ 70 and PSA < 1 then Stop |
|
| ||||
| Screening Men Older than 75 | ||||
|
| ||||
| 32 | 50-76/78/80 | yearly | 3 | |
| 33 | 50-76/78/80 | yearly | 3 | if age ≥ 70 then PSAt = 4 |
| 34 | 50-76/78/80 | yearly | 3 | if 66 ≤ age < 70, then PSAt = 4, if age ≥ 70 then PSAt = 5 |
| 35 | 50-76/78/80 | yearly | 4 | if 66 ≤ age < 70, then PSAt = 5, if age ≥ 70 then PSAt = 7 |
|
| ||||
| AUA 2013 guideline based policies | ||||
|
| ||||
| 36 | 55-69 | yearly | 4 | |
| 37 | 55-69 | 2-year, yearly | 3 | |
Vickers et al.12 and Roobol et al.13 suggest that using PSA to do risk stratification might help to improve outcomes of standard screening policies. Therefore, for a set of yearly screening policies, we compute the effects of changing the screening frequency based on the PSA value at a certain age (60, 65 and 70). Additionally, we also study whether using a higher PSAt for older age groups, might help to improve the harms and benefits trade-off.
Finally, we investigate strategies based on the 2013 AUA guideline. This guideline recommends to screen men between ages 55 and 69. As the recommended PSAt and screening frequency is not clear, we run this policy for PSAt's 3 and 4 ng/ml, yearly and every 2 years.3
We perform sensitivity analyses by running several scenarios for some of the best policies (PCM increase thresholds: -3%, 0%, 3% and 6%). We run four scenarios assuming a reduced screening efficacy: a screening attendance of 70% and 50%, a decrease of 20% in biopsy sensitivity and a 41% biopsy compliance combined with a 85% attendance as observed in the PLCO trial 22. We also vary the parameters that determine PSA growth by 20%, to get a range of possible screening outcomes.
Results
Model Validation
In Figure 1, we compare the predicted incidence by MISCAN compared to the observed incidence in the US SEER data between 1975 and 2009. The model reproduces the peak in prostate cancer incidence due to the introduction of PSA testing, but with slight over prediction. Beyond the calibration period, the predicted incidence is close to the observed incidence rate.
Figure 1. Incidence of prostate cancer in the US population, between 1975 and 2009, for age group 50-85. (Between the vertical dots is the calibration period, 1990-2002).

*Observed denotes the observed prostate cancer incidence rate in age group 50-84, in the US population based on SEER 1975-2009 data. Predicted denotes the predicted incidence by MISCAN, based on a sample of 10 million men representative of the US age distribution across time. The data used for calibration of PSA growth parameters were 1990-2002 SEER data. Before 1990, the model is similar to Wever et al. 14
In Table 2, the PSA distribution projected by MISCAN is close to the PSA distribution observed in the 1st round of the ERPSC trial. The maximum difference between predicted and observed is about 6 percentual points (For more details see Online Supplement PSA Growth Generator Section and Tables 1 and 2).
Table 2. Cumulative PSA distribution at 1st Screen (%).
| PSA | Observed (ERSPC) | Predicted (MISCAN) |
|---|---|---|
| 0.5 | 14.9 | 12.1 |
| 1 | 40.2 | 40.3 |
| 1.5 | 57.4 | 60.8 |
| 2 | 68.5 | 73.5 |
| 2.5 | 75.4 | 81.5 |
| 3 | 80.3 | 86.8 |
| 4 | 87.0 | 92.4 |
| 5 | 91.1 | 95.2 |
| 7 | 95.3 | 97.7 |
| 10 | 97.8 | 99.0 |
| 100 | 99.9 | 100.0 |
ERSPC stands for European Randomized Screening for Prostate Cancer Trial.
Data corresponding to the first round of screening was used.
Projections
In table 3, we show the outcomes of the reference strategy compared to stop screening in 2012. In the reference strategy the lifetime risk of prostate cancer detection is 14.0%. The lifetime risk of metastasis and PCM is, respectively, 0.7% and 2.4%, while if we stop screening after 2012, it becomes respectively, 1.7% and 2.8%. The PCM reduction due to screening is 19.4%, and the lifetime risk of overdiagnosis is 3.8% corresponding to 43.8% of the screen-detected cases.
Table 3. Basecase screening policy compared with stopping screening 2012.
| Lifetime Risk % | 50-74, 1y, PSAt=3 | Stop Screening 2012 |
|---|---|---|
| Prostate Cancer Mortality | 2.4 | 2.8 |
| Metastasis | 0.7 | 1.7 |
| Overdiagnosis | 3.8 | 0 |
| Detection | 14.0 | 9.7 |
|
| ||
| Performance | ||
|
| ||
| PCM Benefit % | 19.4 | - |
| Number Needed to Screen | 162 | - |
| Number Needed to Treat | 15 | - |
| Overdiagnosis (% of Screen Detected) | 43.8 | - |
| Metastasis (% of Detected) | 4.7 | 17.8 |
In the absence of screening (also prior to 2012) the lifetime risk of PCM is 3.0%.
PSAt stands for prostate-specific antigen threshold for biopsy referral.
In table 4 we show the lifetime risk of overdiagnosis and PCM, divided by several thresholds of PCM increase, due to reduced screening intensity, and ordered by overdiagnosis reduction. Increasing the start age of screening from 50 to 54, 58 and 62 has little effect on overdiagnosis. Starting screening at age 54 seems to be the best age of these four, as starting earlier has little effect on PCM (0.2% increase from age 50), while starting later increases PCM (0.8% for age 58 and 2.2% for age 62, in Table 4).
Table 4. Selected screening policies by PCM increase threshold, due to less intensive screening, relative to basecase (50-74, 1y, PSAt=3) and ordered by overdiagnosis reduction.
| Maximum PCM Increase Threshold | Screening Policy | Probability Overdx (- Overdx %) | Probability PCM (+ PCM %) |
|---|---|---|---|
| 0% | 50-74, 1y, PSAt = 3 | 3.80 (0.0) | 2.38 (0.0) |
|
| |||
| 1% | 50-74, 1y, PSAt = 3, if age > 65, PSAt < 1 then freq. = 4y | 3.58 (5.9) | 2.39 (0.7) |
| 58-74, 1y, PSAt = 3 | 3.81 (-0.1) | 2.38 (0.8) | |
| 54-74, 1y, PSAt = 3 | 3.81 (-0.2) | 2.40 (0.2) | |
|
| |||
| 2% | 50-72, 1y, PSAt = 3 | 3.12 (18.0) | 2.41 (1.6) |
| 50-74, 1y, PSAt = 3, if age > 65, PSAt < 1 then stop | 3.15 (17.1) | 2.42 (1.9) | |
| 50-74, 2y, PSAt = 3 | 3.51 (7.6) | 2.41 (1.6) | |
|
| |||
| 3% | 50-72, 2y, PSAt = 3 | 2.88 (24.3) | 2.45 (3.0) |
| 50-74, 1y, PSAt = 3, if 66 ≤ age < 70 then PSAt = 4, if age ≥ 70 then PSAt = 5 | 3.10 (18.6) | 2.43 (2.2) | |
| 50-74, 1y, PSAt = 4 | 3.31 (12.8) | 2.44 (2.6) | |
| 62-74, 1y, PSAt = 3 | 3.76 (1.1) | 2.43 (2.2) | |
|
| |||
| 4% | 50-70, 1y, PSAt = 3 | 2.51 (34.0) | 2.46 (3.2) |
| 50-74, 1y, PSAt = 3, if age > 60, PSAt < 1 then stop | 2.75 (27.6) | 2.47 (3.6) | |
| 50-74, 4y, PSAt = 3 | 3.07 (19.4) | 2.47 (3.8) | |
|
| |||
| 5% | 50-70, 1y, PSAt = 3, if age > 66 then PSAt = 4 | 2.15 (43.4) | 2.49 (4.5) |
| 55-69, 1y, PSAt = 3 | 2.24 (41.0) | 2.48 (4.4) | |
| 50-70, 2y, PSAt = 3 | 2.31 (39.2) | 2.49 (4.5) | |
| 50-74, 1y, PSAt = 4, 66 ≤ age < 70 then PSAt = 5, if age ≥ 70 then PSAt = 7 | 2.61 (31.2) | 2.49 (4.6) | |
|
| |||
| 6% | 50-68, 1y, PSAt = 3 | 1.97 (48.3) | 2.50 (5.1) |
| 55-69, 2y, PSAt = 3 | 2.08 (45.3) | 2.51 (5.4) | |
| 50-70, 1y, PSAt = 4 | 2.13 (43.9) | 2.51 (5.5) | |
|
| |||
| 7% | 50-66, 1y, PSAt = 3 | 1.48 (61.1) | 2.55 (6.9) |
| 50-70, 1y, PSAt = 4, 66 ≤ age < 70 then PSAt = 5, if age ≥ 70 then PSAt = 7 | 1.84 (51.6) | 2.54 (6.4) | |
| 55-69, 1y, PSAt = 4 | 1.88 (50.4) | 2.54 (6.3) | |
| 50-70, 4y, PSAt = 3 | 1.99 (47.5) | 2.53 (6.3) | |
|
| |||
| 17% | Stop Screening 2012 | 0.00 (100.0) | 2.83 (16.2) |
|
| |||
| Screening Men Older than 75 | |||
|
| |||
| -1% | 50-76, 1y, PSAt = 3 | 4.56 (-20.0) | 2.34 (-1.4) |
|
| |||
| -3% | 50-80, 1y, PSAt = 3 | 6.26 (-64.6) | 2.30 (-3.6) |
All other screening policies are shown in Online Supplement tables 3 (by screening frequency and start stop age) and 4 (PSA based risk stratification, PSAt dependent on age, screening men older than 75).
Reduction (-) or increase (+), in percentage, relative to base case (50-74, PSAt=3, yearly screening). Screening policies are ordered by overdiagnosis reduction.
PSAt stands for prostate-specific antigen threshold for biopsy referral, Overdx for Overdiagnosis, PCM for prostate cancer mortality.
Decreasing the stop age from 74 to an earlier age gives a profound effect. With yearly screening, stopping at 72, 70 or 68 reduces the lifetime risk of overdiagnosis, respectively, from 3.8% to 3.1% (18.0% reduction), 2.5% (34.0% reduction) and 2.0% (48.3% reduction). Correspondingly, PCM increases, due to less intensive screening, from 2.4% to 2.4% (1.6% increase), 2.5% (3.2% increase) and 2.5% (5.1% increase) only. Stopping screening at an earlier age than 68 can reduce overdiagnosis by more than 60%, but then PCM increases more than 6% in comparison with screening until age 74 (Table 4).
Keeping the stop age fixed, a reduction in the screening frequency from yearly to every 2 years or 4 years substantially reduces the amount of overdiagnosis (Table 4). However, in most cases, the effect of decreasing the stop age is more powerful than reducing the screen frequency. For instance, consider the policy where screen every two years between ages 50 and 72. The PCM increases from 2.4% to 2.5% (3.0% increase) and overdiagnosis decreases from 3.8% to 2.9% (24.3% reduction), while screening yearly between 50 and 70 increases PCM slightly more to 2.5% (3.2% reduction) but reduces overdiagnosis to 2.5% (34.0% reduction). Also see PCM increase thresholds 2%, 4%, 5% and 7% in Table 4.
Compared to the reference strategy, the three AUA inspired strategies (55-69 yearly with PSAt of 3 and PSAt of 4, 2-year with a PSAt of 3, respectively) reduce overdiagnosis from 3.8% to 2.2% (41.0% reduction), 1.9% (50.4% reduction) and 2.1% (45.3% reduction). PCM increases, respectively, from 2.4% to 2.5% (4.4% increase), 2.5% (6.3% reduction) and 2.5% (5.4% increase) (Table 4).
We also projected outcomes for policies where the frequency of screening changes according to the PSA value (Table 1). Stopping screening at ages 60 or 65 if the PSA is smaller than 1, reduces overdiagnosis from 3.8% to 2.8% (27.6% reduction) and 3.2% (17.1% reduction) but PCM increases from 2.4% to 2.5% (3.6% increase) and 2.4% (1.9% increase), respectively. This is a lower overdiagnosis reduction than other policies with similar PCM levels (Table 4).
A possible way to reduce overdiagnosis is to increase the PSAt (Table 1). The combination where we screen from age 50 with a PSAt of 3, increase to 4 after age 66, and 5 after age 70 has similar harms and benefits trade-off, as simple yearly screening strategy (Table 3). By contrast, most screening policies with an initial PSAt of 4 have a lower overdiagnosis reduction compared to other screening policies with similar PCM levels (See PCM increase thresholds 3%, 5%, 6% and 7% in Table 4).
Screening until age 76 or 80 decreases PCM from 2.4% to 2.3% (1.4% reduction) and 2.3% (3.6% reduction), respectively, and less metastasized cases. But this comes at a price of an overdiagnosis increase from 3.8% to 4.6% (20% increase) and 6.3% (64.6% increase), respectively (Table 4).
The policies that reduce overdiagnosis the most, for maximum PCM increases of 1%, 2%, 3%, 4% and 5% are, respectively, yearly screening 50-74 where, if PSA < 1 at age 65 or older, screening frequency changes to 4 years, yearly screening 50-72, 2-year screening 50-72, yearly screening 50-70 (all with a PSAt of 3) and yearly screening 50-70 with a PSAt of 3 for men younger than 66 and PSAt of 4 for men older than 66 (Figure 2 and Table 4).
Figure 2. The screening policies that reduce the overdiagnosis the most, for each prostate cancer mortality (PCM) threshold.
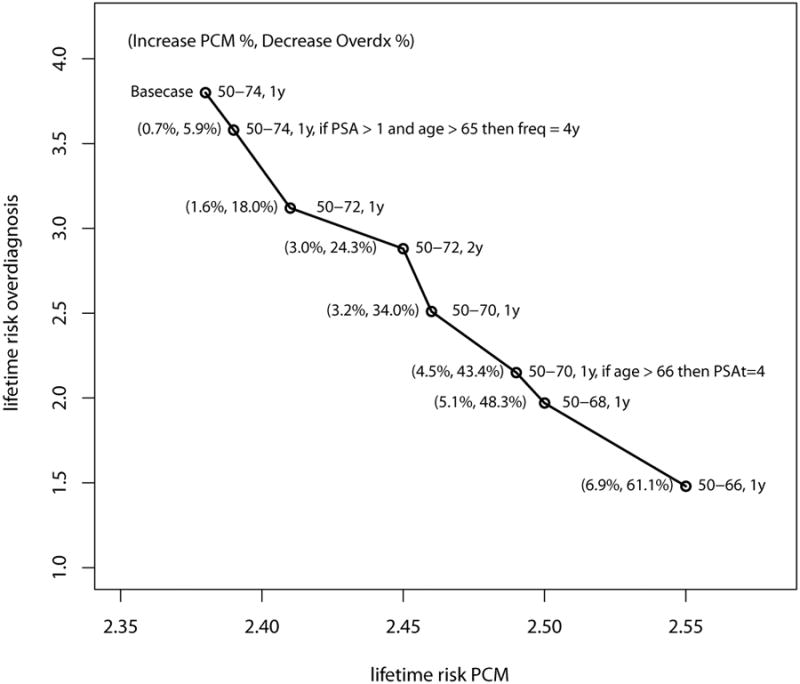
*All policies with a PSA threshold for biopsy referral of 3, unless stated otherwise. The numbers between brackets are relative to the base case screening policy (50-74, 1y, PSAt=3).
#PSAt stands for prostate-specific antigen threshold for biopsy referral, Overdx for Overdiagnosis, PCM for prostate cancer mortality.
Sensitivity Analyses
Varying the PSA growth parameters by 20%, lowering the sensitivity or the attendance does not seem to have a major impact in the results, resulting in the worst case in a slightly lower screening benefit. However, if we apply together the biopsy compliance and attendance observed in the PLCO trial, there is a significant reduction in screening benefit. The lifetime risk of PCM for 50-74 yearly screening at a PSAt of 3 is about 2.5%, which is close to stopping screening at age 68, under our initial assumption of 100% biopsy compliance. On the other hand, the risk of overdiagnosis is about 2.9% stopping at 74, with PLCO compliance compared to 2.0% with 68 as stop age and with 100% biopsy compliance. (Online Supplement Table 5 and 6).
Discussion
For the reference strategy of screening yearly between 50 and 74 with a PSAt of 3, we predict a lifetime risk of PCM of 2.4% (19.4% PCM reduction due to screening) and a corresponding 3.8% lifetime risk of overdiagnosis (43.8% of screen-detected cases).
Overdiagnosis estimates can diverge considerably, depending on the methods and population used 7-8. Based on ERSPC, Welch et al.23 estimated 60% of screen-detected cases are over diagnosed, while Draisma et al 17, used 3 simulation models and estimated a range between 23 and 42%. Gulati et al.11 found a lifetime risk of overdiagnosis and PCM of 3.3% and 2.2%, respectively, for a similar strategy of yearly screening between 50 and 74 with PSAt 4, which compares to 3.3% and 2.4%, in our model. Wu et al 24 estimated a 3.4% lifetime risk of overdiagnosis in Finland, for men screened between 55 and 67 every 4 years.
Ranking screening policies by harms and benefits is a difficult task. Usually we cannot reduce PCM without increasing overdiagnosis. Additionally, the weighting of harms and benefits is highly subjective. However, one could intuitively say, that if a screening strategy causes a small decrease in the benefit and a large decrease in the harms, one would prefer such a policy.
Following this principle and according to our model's predictions, it seems hard to justify screening for prostate cancer in average men older than 70. Namely, we predict that if one screens yearly from age 50 to 70, overdiagnosis reduces from 3.8% to 2.5% (34.0% reduction) and PCM from 2.4% to 2.5% (3.2% increase), compared to screening until 74.
It should be stressed however, that this conclusion is dependent on the particular individual's health and life expectancy. Additionally, our model represents an “ideal” screening environment, which contrasts with the 41% biopsy compliance observed in PLCO, and that more accurately represents the US reality 22. Screening yearly, with the biopsy compliance as in the PLCO between ages 50 and 74 gives a similar PCM level, as if we would have 100% biopsy compliance and stop at age 68. The overdiagnosis level of the latter though, is much lower, suggesting there could be a large efficiency gain by screening less, but enforcing a significantly higher biopsy compliance. In practice though, biopsy compliance is likely not random as in MISCAN. It could be dependent on life expectancy or variables which are also predictors of the severity of the disease like PSA value.
If we compare policies with similar levels of PCM, it seems that the effect of decreasing the stopping age on overdiagnosis reduction is larger than reducing the screening frequency or increasing the initial PSAt to 4. This can seem somewhat counterintuitive, as prostate cancer is a slow growing disease, but one should also notice that the probability of overdiagnosis is highly age dependent 25-27.
We also evaluated screening policies inspired by the 2013 AUA guideline. We find that screening between 55 and 69 is a reasonable way to go forward, as with later ages overdiagnosis increases substantially, and there is a very small difference in mortality between starting screening at age 50 and age 54. However, our predictions are more favourable for yearly screening with a PSA threshold for biopsy referral of 3, than screening every two years or with a PSAt of 4.
PSA based risk stratification reduces overdiagnosis. However, it seems that for a similar PCM increase, the overdiagnosis reduction is smaller than the effect of decreasing the stopping age. This could be the case since few men with PSA smaller than 1 at age 60 will develop the disease in our model. This is in accordance with the ERSPC trial, where the probability of having a PSA smaller than 1 at age 60 and a PSA larger than 3, in the next two rounds is only 2.3% (Online Supplement Table 2). A limitation of this analyses is that we did not vary the stop age. Also other ways of doing PSA based risk stratification could be considered.
Screening men older than 75 saves some lives, but each additional year of screening adds a large number of over diagnosed cases, about 20% for additional 2 yearly screening rounds, and it is therefore undesirable, at least for a person with average life expectancy.
Due to the high number of parameters in MISCAN it is not possible to do a (probabilistic) sensitivity analysis including all parameters and assumptions used to construct the model could have an influence in the projections. For instance, the results from Gulati et al.11 do not differ much from our own, but we verify that for similar screening strategies, the overdiagnosis level is similar but PCM is lower, thus their model is slightly more favourable to screening.
In this study we also did not model Active Surveillance (AS). This type of treatment can reduce the harms of screening, namely by delaying and in some cases avoiding the side-effects associated with radical treatment. On the other hand, its long term effects still needs to be investigated as most current AS observational cohorts have a small follow-up 28. Referring screened men to AS who are at low and perhaps intermediate risk could greatly reduce the harms of screening.
The inclusion of quality of life and costs associated with each disease state can potentially change the relationship between harms and benefits. For instance, Heijnsdijk et al.6 finds that adding quality of life estimates reduces the benefit of screening by 23%. Extrapolating that result to this study could mean that stopping screening earlier would be preferred. Also introducing costs could potentially favour stopping screening earlier.
In general we should screen men with a life expectancy higher than the expected duration from onset of the disease to a state where the prostate cancer is not curable. In most cases the patient's health status will give an idea about the life expectancy, but since the onset of the disease is not observed and there is considerable variation in its duration, it remains a difficult task, to predict which men may benefit of screening.
Our results support the view that screening men older than 70 yearly and indiscriminately can lead to a large increase of overdiagnosis. However, depending on the maximum tolerated level of PCM, earlier stopping ages could be considered.
Additionally we find that screening at lower frequencies than yearly and newly proposed screening protocols in which the frequency depends on PSA result 12,13 or where the PSAt increases with age, do not seem to improve much on simple yearly screening.
Supplementary Material
Novelty & Impact Statements.
The magnitude of the mortality benefit of PSA based prostate cancer screening is still controversial. Furthermore, a significant proportion of screen-detected cases are likely over diagnosed. In order to make PSA screening worthwhile, it is necessary to minimize overdiagnosis. We studied a wide range of alternative screening algorithms, but found no improvement on simple yearly screening. The recently proposed stop age of 69 is reasonable, but earlier ages could be considered.
Acknowledgments
We would like to thank Dr. Monique Roobol and the ERSPC investigators for allowing us access to ERSPC's PSA distribution data.
Funding: This work was supported by by Grant Number U01 CA157224 from the National Cancer Institute as part of the Cancer Intervention and Surveillance Modeling Network (CISNET). Its contents are solely the responsibility of the authors and do not necessarily represent the official views of the National Cancer Institute.
Footnotes
Conflicts of Interest: The department of public health of the Erasmus Medical Center received a research grant from Beckman-Coulter Inc. to study cost-effectiveness of Phi-testing.
References
- 1.Andriole GL, Crawford ED, Grubb RL, 3rd, Buys SS, Chia D, Church TR, Fouad MN, Isaacs C, Kvale PA, Reding DJ, Weissfeld JL, Yokochi LA, et al. Mortality Results after 13 years of Follow-up. Mortality results from a randomized prostate-cancer screening trial. N Engl J Med. 2009;360:1310–19. doi: 10.1056/NEJMoa0810696. [DOI] [PMC free article] [PubMed] [Google Scholar]
- 2.Schröder FH, Hugosson J, Roobol MJ, Tammela TL, Ciatto S, Nelen V, Kwiatkowski M, Lujan M, Lilja H, Zappa M, Denis LJ, Recker F, et al. Prostate-cancer mortality at 11 years of follow-up. N Engl J Med. 2012;366:981–90. doi: 10.1056/NEJMoa1113135. [DOI] [PMC free article] [PubMed] [Google Scholar]
- 3.Carter HB, Albertsen PC, Barry MJ, Etzioni R, Freedland SJ, Greene KL, Holmberg L, Kantoff P, Konety BR, Murad MH, Penson DF, Zietman ALMJ. Early Detection of prostate cancer: AUA guideline. [Accessed February 2014];American Urological Association. 2013 doi: 10.1016/j.juro.2013.04.119. http://www.auanet.org/education/guidelines/prostate-cancer-detection.cfm. [DOI] [PMC free article] [PubMed]
- 4.Roobol MJ, Carlsson SV. Risk stratification in prostate cancer screening. Nat Rev Urol. 2013;10:38–48. doi: 10.1038/nrurol.2012.225. [DOI] [PubMed] [Google Scholar]
- 5.Loeb S, Vellekoop A, Ahmed HU, Catto J, Emberton M, Nam R, Rosario DJ, Scattoni V, Lotan Y. Systematic review of complications of prostate biopsy. Eur Urol. 2013;64:876–92. doi: 10.1016/j.eururo.2013.05.049. [DOI] [PubMed] [Google Scholar]
- 6.Heijnsdijk EA, Wever EM, Auvinen A, Hugosson J, Ciatto S, Nelen V, Kwiatkowski M, Villers A, Páez A, Moss SM, Zappa M, Tammela TL, et al. Quality of Life Effects of Prostate Specific Antigen Screening. N Engl J Med. 2012;367:595–605. doi: 10.1056/NEJMoa1201637. [DOI] [PMC free article] [PubMed] [Google Scholar]
- 7.Etzioni R, Gulati R, Mallinger L, Mandelblatt J. Influence of study features and methods on overdiagnosis estimates in breast and prostate cancer screening. Ann Intern Med. 2013;158:831–8. doi: 10.7326/0003-4819-158-11-201306040-00008. [DOI] [PMC free article] [PubMed] [Google Scholar]
- 8.Loeb S, Bjurlin MA, Nicholson J, Tammela TL, Penson DF, Carter HB, Carroll P, Etzioni R. Overdiagnosis and Overtreatment of Prostate Cancer. Eur Urol. 2014;65:1046–55. doi: 10.1016/j.eururo.2013.12.062. [DOI] [PMC free article] [PubMed] [Google Scholar]
- 9.Nichol MB, Wu J, Huang J, Denham D, Frencher SK, Jacobsen SJ. Cost-effectiveness of Prostate Health Index for prostate cancer detection. BJU Int. 2007;110:353–62. doi: 10.1111/j.1464-410X.2011.10751.x. [DOI] [PubMed] [Google Scholar]
- 10.Kobayashi T, Goto R, Ito K, Mitsumori K. Prostate cancer screening strategies with re-screening interval determined by individual baseline prostate-specific antigen values are cost-effective. EJSO. 2007;33:783–89. doi: 10.1016/j.ejso.2007.02.015. [DOI] [PubMed] [Google Scholar]
- 11.Gulati R, Gore JL, Etzioni R. Comparative Effectiveness of Alternative Prostate-Specific Antigen–Based Prostate Cancer Screening Strategies. Ann Intern Med. 2013;158:145–53. doi: 10.7326/0003-4819-158-3-201302050-00003. [DOI] [PMC free article] [PubMed] [Google Scholar]
- 12.Vickers AJ, Lilja H. Predicting prostate cancer many years before diagnosis: how and why? World J Urol. 2012;30:131–35. doi: 10.1007/s00345-011-0795-8. [DOI] [PMC free article] [PubMed] [Google Scholar]
- 13.Roobol MJ, Roobol DW, Schroder FH. Is additional testing necessary in men with prostate-specific antigen levels of 1.0 ng/mL or less in population-based screening setting? Urology. 2005;65:343–46. doi: 10.1016/j.urology.2004.09.046. [DOI] [PubMed] [Google Scholar]
- 14.Grenabo Bergdahl A, Holmberg E, Moss S, Hugosson J. Incidence of Prostate Cancer After Termination of Screening in a Population-based Randomised Screening Trial. Eur Urol. 2013;64:703–09. doi: 10.1016/j.eururo.2013.05.024. [DOI] [PubMed] [Google Scholar]
- 15.Draisma G, Boer R, Otto SJ, van der Cruijsen IW, Damhuis RA, Schröder FH, de Koning HJ. Lead time and overdetection due to prostate-specific antigen screening: estimates from the European Randomized Study of Screening for Prostate Cancer. J Natl Cancer Inst. 2003;95:868–78. doi: 10.1093/jnci/95.12.868. [DOI] [PubMed] [Google Scholar]
- 16.Draisma G, Postma R, Schröder FH, van der Kwast TH, de Koning HJ. Gleason Score, age and screening: modelling dedifferentiation in prostate cancer. Int J Cancer. 2006;119:2366–71. doi: 10.1002/ijc.22158. [DOI] [PubMed] [Google Scholar]
- 17.Draisma G, Etzioni R, Tsodikov A, Mariotto A, Wever E, Gulati R, Feuer E, de Koning H. Lead Time and Overdiagnosis in Prostate-Specific Antigen Screening: Importance of Methods and Context. J Natl Cancer Inst. 2009;101:374–83. doi: 10.1093/jnci/djp001. [DOI] [PMC free article] [PubMed] [Google Scholar]
- 18.Etzioni R, Gulati R, Tsodikov A, Wever EM, Penson DF, Heijnsdijk EA, Katcher J, Draisma G, Feuer EJ, de Koning HJ, Mariotto AB. The prostate cancer conundrum revisited: treatment changes and prostate cancer mortality declines. Cancer. 2012;118:5955–63. doi: 10.1002/cncr.27594. [DOI] [PMC free article] [PubMed] [Google Scholar]
- 19.Wever EM, Draisma G, Heijnsdijk EA, de Koning HJ. How does early detection by screening affect disease progression?: Modelling estimated benefits in prostate cancer screening. Med Decis Making. 2011;31:550–58. doi: 10.1177/0272989X10396717. [DOI] [PMC free article] [PubMed] [Google Scholar]
- 20.Inoue LY, Etzioni R, Morrell C, Müller P. Modeling Disease Progression with Longitudinal Markers. J Am Stat Assoc. 2008;103:259–70. doi: 10.1198/016214507000000356. [DOI] [PMC free article] [PubMed] [Google Scholar]
- 21.Mariotto AB, Etzioni R, Krapcho M, Feuer EJ. Reconstructing PSA Testing Patterns Between Black and White Men in the US from Medicare Claims and the National Health Interview Survey. Cancer. 2007;109(9):1877–86. doi: 10.1002/cncr.22607. [DOI] [PubMed] [Google Scholar]
- 22.Pinsky PF, Andriole GL, Kramer BS, Hayes RB, Prorok PC, Gohagan JK Prostate, Lung, Colorectal and Ovarian Project Team. Prostate biopsy following a positive screen in the prostate, lung, colorectal and ovarian cancer screening trial. J Urol. 2005;173:746–50. doi: 10.1097/01.ju.0000152697.25708.71. [DOI] [PubMed] [Google Scholar]
- 23.Welch HG, Black WC. Overdiagnosis in Cancer. J Natl Cancer Inst. 2010;102:605–13. doi: 10.1093/jnci/djq099. [DOI] [PubMed] [Google Scholar]
- 24.Wu GH, Auvinen A, Määttänen L, Tammela TL, Stenman UH, Hakama M, Yen AM, Chen HH. Number of screens for overdetection as an indicator of absolute risk of overdiagnosis in prostate cancer screening. Int J Cancer. 2012;131:1367–75. doi: 10.1002/ijc.27340. [DOI] [PubMed] [Google Scholar]
- 25.Gulati R, Inoue LY, Gore JL, Katcher J, Etzioni R. Individualized estimates of overdiagnosis in screen-detected prostate cancer. J Natl Cancer Inst. 2014;106 doi: 10.1093/jnci/djt367. [DOI] [PMC free article] [PubMed] [Google Scholar]
- 26.Vickers AJ, Sjoberg DD, Ulmert D, Vertosick E, Roobol MJ, Thompson I, Heijnsdijk EA, De Koning H, Atoria-Swartz C, Scardino PT, Lilja H. Empirical estimates of prostate cancer overdiagnosis by age and prostate-specific antigen. BMC Med. 2014 Feb 11;12:26. doi: 10.1186/1741-7015-12-26. [DOI] [PMC free article] [PubMed] [Google Scholar]
- 27.Pashayan N, Duffy SW, Pharoah P, Greenberg D, Donovan J, Martin RM, Hamdy F, Neal DE. Mean sojourn time, overdiagnosis, and reduction in advanced stage prostate cancer due to screening with PSA: implications of sojourn time on screening. Br J Cancer. 2009;100:1198–204. doi: 10.1038/sj.bjc.6604973. [DOI] [PMC free article] [PubMed] [Google Scholar]
- 28.Cooperberg MR, Carroll PR, Klotz L. Active Surveillance for Prostate Cancer: Progress and Promise. J Clin Oncol. 2011;29:3669–76. doi: 10.1200/JCO.2011.34.9738. [DOI] [PubMed] [Google Scholar]
- 29.Vickers AJ, Ulmert D, Sjoberg DD, Bennette CJ, Björk T, Gerdtsson A, Manjer J, Nilsson PM, Dahlin A, Bjartell A, Scardino PT, Lilja H. Strategy for detection of prostate cancer based on relation between prostate specific antigen at age 40-55 and long term risk of metastasis: case-control study. BMJ. 2013;346:f2023. doi: 10.1136/bmj.f2023. [DOI] [PMC free article] [PubMed] [Google Scholar]
Associated Data
This section collects any data citations, data availability statements, or supplementary materials included in this article.