

Abstract
The microtubule cytoskeleton supports diverse cellular morphogenesis and migration processes during brain development. Mutations in tubulin genes are associated with severe human brain malformations known as ‘tubulinopathies’; however, it is not understood how molecular-level changes in microtubule subunits lead to brain malformations. In this study, we demonstrate that missense mutations affecting arginine at position 402 (R402) of TUBA1A α-tubulin selectively impair dynein motor activity and severely and dominantly disrupt cortical neuronal migration. TUBA1A is the most commonly affected tubulin gene in tubulinopathy patients, and mutations altering R402 account for 30% of all reported TUBA1A mutations. We show for the first time that ectopic expression of TUBA1A-R402C and TUBA1A-R402H patient alleles is sufficient to dominantly disrupt cortical neuronal migration in the developing mouse brain, strongly supporting a causal role in the pathology of brain malformation. To isolate the precise molecular impact of R402 mutations, we generated analogous R402C and R402H mutations in budding yeast α-tubulin, which exhibit a simplified microtubule cytoskeleton. We find that R402 mutant tubulins assemble into microtubules that support normal kinesin motor activity but fail to support the activity of dynein motors. Importantly, the level of dynein impairment scales with the expression level of the mutant in the cell, suggesting a ‘poisoning’ mechanism in which R402 mutant α-tubulin acts dominantly by populating microtubules with defective binding sites for dynein. Based on our results, we propose a new model for the molecular pathology of tubulinopathies that may also extend to other tubulin-related neuropathies.
Introduction
Tubulin genes have recently been implicated in severe and diverse neurodevelopmental defects in patients that can lead to intellectual deficits, epilepsy and even fatality. These disorders, collectively termed ‘tubulinopathies’, result from dominant, de novo, missense mutations in tubulin genes, but how these alterations to tubulin proteins cause wide-ranging neuronal defects is largely unknown. The most commonly affected gene in tubulinopathy patients is TUBA1A, the α1 tubulin that is selectively expressed in post-mitotic neurons but not in neuronal progenitor or glia cells (1–6). Patients with different TUBA1A mutations exhibit diverse brain malformations (1,7–15). The variability of patient phenotypes underscores the possibility that individual TUBA1A mutations may cause distinct defects in microtubule function, impacting brain development in different ways (1,16). However, we have little evidence of the molecular consequences of tubulin mutations or how changes to the microtubule network give rise to the observed brain phenotypes.
Microtubules are essential for neurite formation and outgrowth, migration, cargo transport and synapse generation (17–19). Patient-derived mutations can provide insight into how molecular level interactions impact each of these functions to dictate the stereotypical architecture of the brain. Many TUBA1A mutations are associated with lissencephaly (1,2,7,8,10–12,20–22). Lissencephaly is a neuronal migration disorder that is commonly associated with mutations that disrupt LIS1, which encodes a regulator of the microtubule motor dynein, and DCX, which encodes the microtubule-associated protein doublecortin (23). Together with mechanistic studies, these associations suggest that neuronal migration relies on the microtubule–dynein interaction (24–26).
Substitutions that affect conserved residue R402 represent 30% of TUBA1A mutations identified in patients, suggesting this site is essential for TUBA1A's role in brain development. These mutations result in the substitution of R402 to a cysteine (R402C), histidine (R402H) or leucine (R402L). R402C and R402H are the most common substitutions, with only two reported cases of R402L (11,22). All three substitutions at R402 observed in patients cause moderate to severe lissencephaly, corpus callosum defects, intellectual deficits and occasional microcephaly (1,7,8,11,12).
Genomic manipulation of single α-tubulin isotypes has presented a significant challenge because homology-directed repair techniques target the nearly identical α-tubulin genes, potentially disrupting α-tubulins that are required for cell division. While post-mitotic neurons selectively express TUBA1A during development, an essential and nearly identical isotype, TUBA1B, is expressed ubiquitously (5,27). Alternative model systems are used to circumvent this challenge and investigate the molecular consequences of tubulin mutations. For example, (28) used budding yeast to interrogate the molecular mechanism behind TUBB3 mutations that cause the ocular motility disorder CFEOM3 (28). Budding yeast provides a simplified eukaryotic system with only one β-tubulin and two α-tubulin genes. Tub1 is the major α-tubulin isotype expressed in yeast, comprising 90% of the total α-tubulin (29). In addition, yeast maintains many of the homologous microtubule-associated proteins present in mammalian cells. Using yeast to investigate the functional consequences of mutations identified in tubulinopathy patients provides an opportunity to determine how a substitution alters tubulin function: (1) does the mutant α-tubulin form functional tubulin heterodimers? (2) Can mutant heterodimers polymerize into microtubules? (3) Do mutant heterodimers alter binding of conserved microtubule-associated proteins to the microtubule network?
Here, we demonstrate that ectopic expression of TUBA1A-R402C and TUBA1A-R402H alleles disrupts cortical neuron migration in mice, suggesting that these changes are responsible for lissencephaly. We reveal that R402C/H substitutions specifically disrupt the microtubule–dynein interaction and that the disruption of dynein scales with the amount of mutant tubulin expressed. These findings suggest that R402 mutants cause lissencephaly by poisoning dynein activity in a setting when its function is crucial for neurodevelopment.
Results
Mutations to conserved residue R402 dominantly disrupt cortical migration
Numerous studies have described the lissencephaly spectrum phenotype observed in tubulinopathy patients harboring heterozygous TUBA1A-R402C and TUBA1A-R402H mutations (1,2,7,8,10–12,30), but whether these mutations alone are sufficient to dominantly disrupt cortical migration has not been established. To examine how TUBA1A-R402C and TUBA1A-R402H alleles impact neuronal migration, we performed in utero electroporation to introduce ectopic TUBA1A expression in the ventricular zone of C57Bl6 wild-type (WT) mice (Fig. 1). Two control plasmids express either cytoplasmic GFP alone (empty vector) or GFP along with WT TUBA1A. Two experimental constructs express GFP with either TUBA1A-R402C (R402C) or TUBA1A-R402H (R402H). Over-expression of the WT TUBA1A caused no alteration to migration compared to the empty vector control. In contrast, overexpression of either TUBA1A-R402C or TUBA1A-R402H alleles leads to a marked perturbation of cortical neuron migration, with only 24.3 ± 1.7% (mean ± standard error of the mean (SEM)) and 27.6 ± 2.5% of total green fluorescent protein (GFP) signal present in the cortical plate, respectively, compared to 56.7 ± 3.1% of the empty vector and 56.8 ± 3.2% for WT TUBA1A expression controls (Fig. 1A–C; WT t-test compared to empty vector, P = 0.99; R402C t-test, P < 0.0001; R402H t-test, P < 0.0001).
Figure 1.
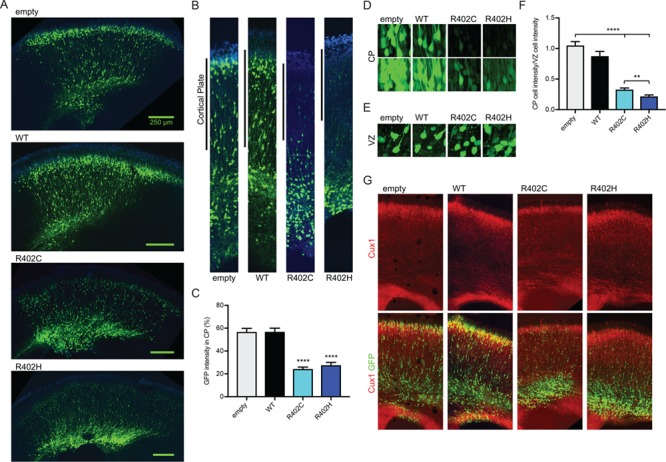
Tuba1a-R402C/H mutants dominantly disrupt neuronal migration in the developing mouse cortex. (A) Coronal sections from E18.5 mouse brain electroporated at E14.5 with pCIG2 vectors: empty vector (empty), WT TUBA1A (WT), TUBA1A-R402C (R402C) or TUBA1A-R402H (R402H). (B) Representative regions of cortex analyzed for cortical plate fluorescence. (C) Percentage of GFP signal in the cortical plate. For each condition, three coronal sections from at least four separate animals were analyzed. Data are represented as mean ± SEM. Quadruple asterisks indicate significant difference compared to WT, by t-test (P < 0.0001). (D) Representative images of cortical plate neurons for each condition, at two different exposures. (E) Representative images ventricular zone neurons for each condition. (F) Quantification of mean GFP intensity of cortical plate neurons normalized GFP intensity of ventricular zone neurons. Data are represented as mean ± SEM. At least 45 neurons for each condition were measured (Region of interest (ROI) = 200 μm2). Quadruple asterisks indicate significant difference compared to WT, by t-test (P < 0.0001). Double asterisks indicate significant difference compared to WT, by t-test (P < 0.01). (G) Cux1 staining of electroporated sections reveals position of upper layer cortical neurons.
We also examined migration defects at the level of individual cells. For empty vector control, cells that migrate to the cortical plate exhibit a similar level of cytosolic GFP intensity as cells in the ventricular zone, with a normalized intensity ratio of 1.05 ± 0.06 (mean GFP intensity per cortical plate cell/mean GFP intensity per ventricular zone cell ± SEM; Fig. 1D–F). TUBA1A WT controls also contain similar GFP intensities in the cortical plate and ventricular zone, with a normalized intensity ratio of 0.88 ± 0.077 (WT t-test compared to empty vector, P = 0.09; Fig. 1D–F). However, the TUBA1A-R402C/H-expressing neurons that reach the cortical plate exhibit significantly lower cytosolic GFP fluorescence with normalized intensity ratios of 0.33 ± 0.027 and 0.22 ± 0.024, respectively (Fig. 1D–F; Supplementary Material, Fig. S1B; R402C t-test compared to empty vector, P < 0.0001; R402H t-test, P < 0.0001). Thus, fewer neurons expressing TUBA1A-R402C/H migrate to the cortical plate, and those that do migrate exhibit lower expression of the introduced construct. In all conditions, including TUBA1A-R402C/H mutant expression, we observed neurons with long axons and visible leading processes based on cytosolic GFP (Supplementary Material, Fig. S1A–C), suggesting that migration failure is not accompanied by failure to send out axons or leading processes. Further, we show that while neurons expressing mutant TUBA1A do not appropriately migrate, non-electroporated neurons in the same sections reach upper cortical layers unperturbed, as shown by Cux1 staining (Fig. 1G). This suggests that the migration failure is intrinsic to the transfected neurons ectopically expressing the TUBA1A-R402C/H mutant alleles and not attributable to disruption of the radial glial cells. We conclude that expression of TUBA1A-R402C and TUBA1A-R402H alleles dominantly disrupt cortical neuron migration.
Ectopic expression of TUBA1A-R402C/H mutants does not significantly disrupt neuronal morphology in primary cortical culture
The developmental period when cortical neurons are born and migrate involves several microtubule-dependent functions: forming neurites, polarizing to contain one axon and the appropriate number of dendrites, trafficking cargoes to growth cones and migrating along radial glial cells to reach the correct cortical layer. We set out to discover whether defects in these microtubule-dependent functions might underlie the cortical migration defects observed with the expression of TUBA1A-R402C/H alleles.
We first interrogated how ectopic expression of TUBA1A mutant alleles impact neurite outgrowth and polarization. Using the same vectors employed for the in utero electroporation experiments in the developing cortex, we generated rat primary neuron cultures ectopically expressing these constructs via nucleofection in dissociated neurons before plating. Primary neurons ectopically expressing the R402 mutant alleles formed neurites indistinguishable from control neurons over all time points analyzed in vitro, with all conditions generating a similar number of neurites that extend appropriately (Fig. 2A–C; Supplementary Material, Table S1). Neuronal polarization was unaffected by ectopic expression of TUBA1A-R402C/H alleles, with DIV11 neurons exhibiting similar numbers of dendrites and only one axon under each condition (Fig. 2D–F; Supplementary Material, Table S1). Given these results, we conclude that ectopic expression of TUBA1A-R402C/H alleles is not sufficient to disrupt neuronal morphology in rat primary cortical neurons.
Figure 2.
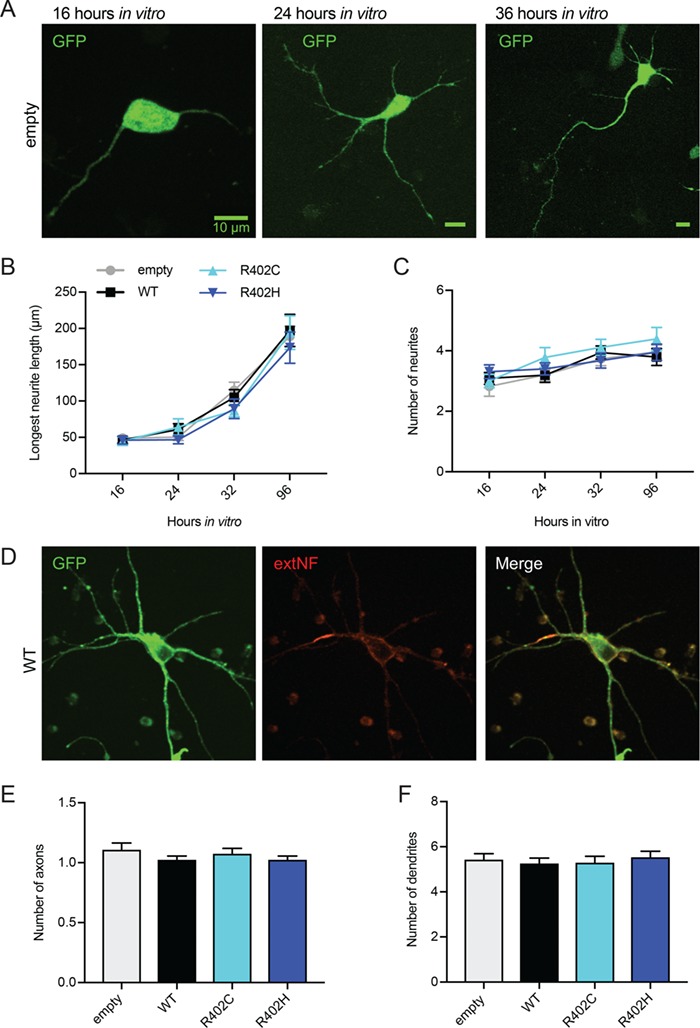
Neuron morphology is not significantly altered by ectopic expression of TUBA1A-R402C/H mutants. (A) Representative images of primary rat cortical neurons expressing pCIG2-ires-GFP at 16, 24 and 36 h in vitro. (B and C) Longest neurite length (B) or neurite number (C) tracked over 16 to 96 h in vitro from neurons expressing pCIG2 vectors. (D) DIV11 neuron expressing pCIG2-Tuba1a(WT)-ires-GFP stained with extNF to mark the AIS. (E and F) Number of axons (E) or dendrites (F) in neurons expressing pCIG2 vectors.
Ectopic expression of TUBA1A mutants is not sufficient to disrupt microtubule polymerization in primary cortical culture
In addition to neuronal process outgrowth and polarization, we tested the consequence of TUBA1A mutant ectopic expression on microtubule polymerization. For these experiments, we expressed TUBA1A-R402C or TUBA1A-R402H constructs, TUBA1A WT constructs or empty vectors in primary rat cortical neurons. We also assessed the impact of ectopically expressing TUBA1A-T349E mutant alleles, a potent α-tubulin mutant that blocks polymerization of tubulin heterodimers into microtubules that should act as a positive control (31). To visualize microtubule polymerization events, we constructed pCIG2 vectors that co-express the TUBA1A alleles with GFP-MACF43. MACF43 binds to EB proteins and tracks the plus ends of growing microtubules (32). Using this relatively inert plus end marker removes the complication of overexpressing labeled EB proteins that act as microtubule polymerization factors and can impact polymerization rates (33). We expressed these constructs via nucleofection in primary cortical neurons before plating and assessed the effect of ectopic TUBA1A mutant alleles on axonal microtubule dynamics. For consistency in this analysis, we measured microtubule polymerization in proximal axons of DIV11 neurons (50–200 μm from the soma), as determined by staining with axon initial segment (AIS) marker external neurofascin (extNF) (Fig. 3A). Using at least 15 cells from a minimum of 3 separate nucleofections and analyzing 213-498 individual polymerization events for each condition, we determined that ectopically expressing the TUBA1A mutant alleles in primary neurons is not sufficient to significantly alter axonal microtubule polymerization rates (Fig. 3B; Supplementary Material, Table S2). Throughout this experiment, we noticed a large variability in microtubule polymerization rates from cell to cell, which often varied with different primary neuron nucleofections. For example, for each condition (empty vector, WT control, T349E, R402C or R402H) we observed cells containing slowly polymerizing microtubules and other cells containing quickly polymerizing microtubules (Fig. 3C). Even neurons expressing the α-tubulin mutant that should cause drastic reduction in polymerization, TUBA1A-T349E, the range of microtubule polymerization rates observed is indistinguishable from empty vector controls (Fig. 3B and C). These negative data suggest that ectopic expression of TUBA1A mutant alleles is not sufficient to cause measurable disruption of axonal microtubule polymerization in primary cortical rat neurons and raises concerns about the validity of assessing microtubule-based functions under these experimental conditions.
Figure 3.
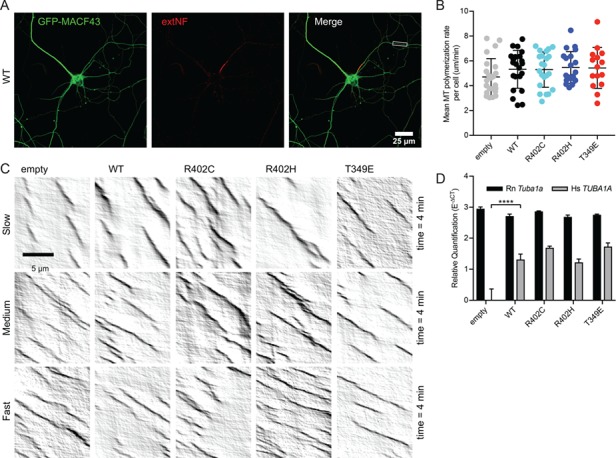
Ectopic expression of TUBA1A mutant alleles is not sufficient to disrupt axonal microtubule polymerization in primary neuronal culture. (A) Representative image of DIV11 primary rat cortical neuron expressing pCIG2-Tuba1a(WT)-ires-GFP-MACF43 and live-stained with extNF to reveal AIS. Inset reveals axonal segment selected for kymograph analysis. (B) Microtubule polymerization rate. Each data point represents cellular mean microtubule polymerization rate, with bars displaying mean ± SEM. No significant differences to empty vector or WT control, with significance determined as P < 0.05. (C) Representative kymographs from each condition displaying variation in microtubule polymerization rates observed across cells. (D) Relative quantification of endogenous, rat Tuba1a (Rn Tuba1a) and ectopic, human TUBA1A (Hs TUBA1A) mRNA levels using RT-qPCR on RNA isolated from GFP-positive neuron population after FACS. Data are represented as mean ± standard deviation. Quadruple asterisks indicate significant difference compared to WT, by t-test (P < 0.0001).
In addition to microtubule polymerization rate, we assessed axonal microtubule density and orientation (Supplementary Material, Fig. S2). Normally, axonal microtubules are uniformly oriented with plus ends toward the distal axon (34). We used live imaging of neurons stained with extNF to ask whether axonal microtubule polarity is disrupted by TUBA1A-R402C/H mutants. Similar to microtubule polymerization rate, microtubule density and percentage of retrograde microtubule polymerization events are not significantly altered by ectopic expression of TUBA1A-R402C or TUBA1A-R402H alleles (Supplementary Material, Fig. S2B–C). Additionally, we assessed how neurons ectopically expressing mutant TUBA1A-R402C/H traffic lysosomes to investigate whether the presence of mutant tubulin alters microtubule motor activity in axons. We determined no significant difference between lysosome anterograde and retrograde trafficking rates for any condition tested (Supplementary Material, Fig. S3A–D). The number of anterograde, retrograde and paused lysosome trafficking events was also not significantly altered by the presence of ectopic TUBA1A-R402C/H expression (Supplementary Material, Fig. S3E–F).
To confirm expression of ectopic human TUBA1A in rat primary cultured neurons, we compared the relative levels of ectopic TUBA1A mRNA to native Tuba1a mRNA in the Amaxa-nucleofected primary cortical neurons. To perform this analysis, we used fluorescent-activated cell sorting (FACS) to isolate the GFP-positive neuron population and determined the mRNA level of ectopic, human (Hs) TUBA1A mRNA compared to the endogenous, rat (Rn) Tuba1a mRNA using quantitative real time polymerase chain reaction (RT-qPCR). Expression of the ectopic TUBA1A allele was identified in all conditions containing the human TUBA1A coding sequence but was absent in the empty vector condition, as expected (Fig. 3D; empty vector t-test compared to WT, P < 0.0001). Based on relative quantification of Ct values normalized to reference genes Ywhaz and Arbp (35–38), ectopic TUBA1A is present at ~50% of endogenous Tuba1a mRNA in the cell with no significant difference of endogenous or ectopic levels observed between conditions containing ectopic WT TUBA1A, TUBA1A-R402C, TUBA1A-R402H and TUBA1A-T349E vectors (Fig. 3D). Thus, ectopic mutant TUBA1A is expressed in the neurons analyzed, albeit at levels less than the endogenous Tuba1a in the cell. We conclude that the primary neuron culture system is not adequate to assess changes caused by ectopic expression of mutant TUBA1A alleles at the time points assayed and under the conditions we employed. We put forth that the lack of phenotypes observed using this system does not reflect that TUBA1A-R402C and TUBA1A-R402H alleles are not disruptive to microtubule-based functions but instead reveal a limitation of ectopically expressing tubulin mutants in primary neuron culture. Therefore, we turned to budding yeast to assess the molecular consequences of endogenously expressing R402C and R402H patient mutations on tubulin function.
Mutations mimicking R402C/H in yeast α-tubulin lead to polymerization competent heterodimers
In principle, mutations to TUBA1A could alter α-tubulin function at the levels of the following: (1) tubulin heterodimer formation (Fig. 4A), (2) tubulin heterodimer polymerization to form microtubules (Fig. 4B), (3) MAP binding to polymerized microtubules (Fig. 4C) or a combination of these effects (16). To isolate the functional consequences of TUBA1A-R402C and TUBA1A-R402H substitutions on a molecular level, we made analogous mutations in budding yeast α-tubulin. Budding yeast is an ideal system to test specific molecular hypotheses about microtubule function because it contains fewer tubulin isotypes, mutations can be made at the endogenous chromosomal locus and single microtubules can be visualized by light microscopy. We introduced the mutations to the major yeast α-tubulin isotype TUB1 at the codon analogous to R402, generating tub1-R403C and tub1-R403H mutant stains (Fig. 4D). We first tested whether R403 mutants alter Tub1 protein levels by performing western blots on lysates from the integrated α-tubulin mutant yeast strains and probed with pan α-tubulin antibody and found no significant change to total α-tubulin levels in either mutant strain compared to WT (Fig. 4E).
Figure 4.
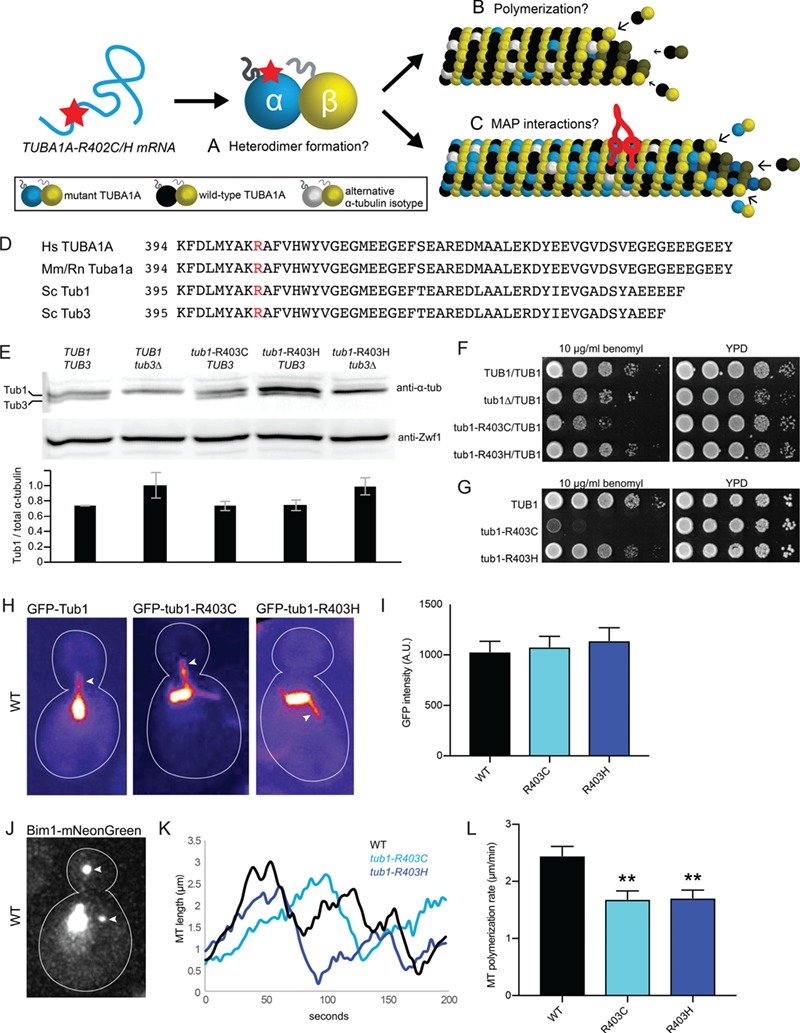
α-tubulin R402C/H mutants form polymerization-competent tubulin heterodimers in Saccharomyces cerevisiae. (A–C) Possible consequences of α-tubulin R402C/H mutants on tubulin function. R402C/H mutants may disrupt tubulin heterodimer formation (A), polymerization into microtubule lattice (B) and/or microtubule-associated-protein interactions (C). (D) Amino acid alignment of α-tubulin protein C-terminal region with conserved arginine of interest in red. Hs, Homo sapiens; Mm, Mus musculus; Rn, R. norvegicus; Sc, S. cerevisiae. (E) Western blot of α-tubulin protein in lysates from the indicated strains. Blots were also probed for Zwf1/G6PD as a loading control. Intensity of α-tubulin bands from three separate experiments, normalized to Zwf1 loading control. Data are represented as mean ± SEM. Strains: WT, yJM596; tub3∆, yJM0103; tub1-R403C, yJM2240, yJM2245; tub1-R403H, yJM2121, yJM2263; tub1-R403H tub3∆, yJM2533. (F) Growth assay for heterozygous diploid tub1-R403 mutants on rich media or rich media supplemented with the microtubule-destabilizing drug, benomyl, (10 μg/ml), incubated at 30°C. Strains: WT, yJM0091; tub1∆/TUB1, 0591; tub1-R403C/TUB1, yJM2364, yJM2365; tub1-R403H, yJM2366, yJM2367. (G) Growth assay for haploid tub1-R403 mutants grown on rich media or benomyl-supplemented rich media (10 μg/ml), incubated at 30°C. Strains: WT, yJM1839, yJM1840; tub1-R403C, yJM2120, yJM2239; tub1-R403H, yJM2121, yJM2122. (H) Images of microtubules labeled with GFP-Tub1, GFP-tub1-R403C or GFP-tub1-R403H. Arrows point to astral microtubules. (I) Quantification of GFP signal per micron of astral microtubule. At least 29 microtubules were measured for each strain. Data are represented as mean ± SEM. Strains: WT GFP-TUB1, yJM1237, yJM1887, yJM0562; GFP-tub1-R403C, yJM1872, yJM2112, yJM2113; GFP-tub1-R403H, yJM1873, yJM2114, yJM2115. (J) Image of a WT cell expressing Bim1-mNeonGreen. Arrows point to astral microtubule plus ends. (K) Representative life plots of astral microtubule dynamics in WT, tub1-R403C and tub1-R403H mutants. Astral microtubule length was measured over time as the distance between Bim1-mNeonGreen at the microtubule plus end and the minus end at the proximal spindle pole. (L) Mean polymerization rates. Data are represented as mean ± SEM. Double asterisks indicate significant difference compared to WT, by t-test (P < 0.01). Strains: WT, yJM2188, yJM2189; tub1-R403C, yJM2190, yJM2191; tub1-R403H, yJM2192, yJM2193.
In yeast, cell growth assays can be used as a measurement of the functionality of mutant tubulin. To further assess the competency of tub1-R403C/H protein, we tested the mutants for sensitivity to the microtubule-destabilizing drug, benomyl. We performed growth assays using heterozygous diploid yeast, which contain one copy of tub1-R403C/H and one copy of WT TUB1. We also used haploid yeast strains that contain a single copy of either the mutant tub1-R403C/H or WT TUB1 controls. The tub1-R403H mutant exhibits a level of growth and benomyl sensitivity that is similar to WT controls in both the diploid and haploid cells (Fig. 4F and G). This indicates that the R403H mutant can grossly rescue α-tubulin function in yeast. In contrast, the tub1-R403C mutant exhibits hypersensitivity to benomyl in both the haploid and heterozygous diploid cells (Fig. 4F and G). The growth disruption caused by the tub1-R403C mutant in heterozygous diploid cells is similar to tub1∆/TUB1 heterozygous null diploids, where one copy of TUB1 is ablated. These data suggest that R403C and R403H substitutions may lead to differing effects on microtubule function.
To determine whether tub1-R403C/H is sufficient to support α-tubulin function, we tested for viability in the absence of the other yeast α-tubulin isotype, TUB3. Here, we again observed a difference between tub1-R403C and tub1-R403H mutants. While we were able to generate a tub1-R403H tub3∆ double mutant haploid strain, tub1-R403C is lethal when combined with tub3∆ knockout (Table S3). This additional evidence suggests that tub1-R403C and tub1-R403H substitutions do not lead to the same functional consequences; the cysteine substitution may be more detrimental when required to support microtubule function.
We next tested whether the R403 mutants alter tubulin assembly activity in two separate assays: first by microtubule lattice incorporation and second by measuring microtubule dynamics in yeast strains expressing untagged Tub1-R403C/H mutants from the endogenous locus. We tested whether the mutant protein could assemble into microtubules by measuring the abundance of GFP-labeled WT Tub1, GFP-tub1-R403C or GFP-tub1-R403H present in single astral microtubules in yeast cells. Importantly, these cells also express WT, unlabeled Tub1 and Tub3 α-tubulin; therefore, the level of GFP signal per unit length of microtubule reflects a competition between GFP-labeled and unlabeled α-tubulin for assembly into the lattice. This competition analysis revealed that mutants GFP-tub1-R403C and GFP-tub1-R403H incorporate into microtubules at levels similar to WT GFP-Tub1, as the fluorescence intensity of single microtubules measured in mutant strains was indistinguishable from WT strains (Fig. 4H and I; R403C t-test compared to WT, P = 0.73; R403H t-test, P = 0.50). These data indicate that tub1-R403C and tub1-R403H support heterodimer formation and microtubule assembly. As an alternative approach, we assayed microtubule dynamics in strains containing untagged Tub1-R403C/H expressed from the endogenous locus. To determine how mutant R403C/H α-tubulin affects microtubule dynamics, we crossed tub1-R403C/H mutants with a strain that also expresses fluorescently labeled Bim1, the yeast homolog of microtubule plus-end binding protein EB. Bim1 binds to the plus ends of microtubules and allows visualization of both polymerization and depolymerization events (Fig. 4J and K). This analysis revealed that expression of both tub1-R403C and tub1-R403H leads to decreased microtubule polymerization rates of 1.69 ± 0.82 μm/min (mean ± SEM) and 1.71 ± 0.73 μm/min, respectively, compared to the WT polymerization rate of 2.45 ± 1.1 μm/min (Fig. 4K and L; Supplementary Material, Table S4; R403C t-test compared to WT, P = 0.0014; R403H t-test, P = 0.0018). Therefore, our results indicate that while tub1-R403C/H mutants are competent at assembling into microtubules, they polymerize more slowly than WT Tub1.
tub1-R403C/H mutations perturb dynein function in yeast
Dynein's interaction with microtubules is essential for migration of cortical neurons. To investigate whether the histidine and cysteine substitutions at R402 perturb dynein function, we analyzed the activity of dynein in tub1-R403H or tub1-R403C mutant yeast. Unlike in neurons, where dynein performs many important tasks, yeast dynein performs the single, important role of generating pulling forces on astral microtubules to move the nucleus and mitotic spindle across the nascent plane of cytokinesis.
To determine how tub1-R403C/H mutants affect dynein activity, we imaged mitotic spindle movement in strains simultaneously expressing GFP-tub1-R403C/H mutant and unlabeled tub1-R403C/H from the endogenous locus, so that all Tub1 protein in the cell contains the mutation. To isolate dynein-mediated spindle sliding events and prevent spindle elongation at anaphase, we treated the cells with hydroxyurea (HU) to arrest in S phase. Under these conditions, dynein moves the spindle by promoting ‘sliding events’, where growing astral microtubules collide with the cell cortex, dynein attaches to a receptor at the cortex, and dynein motor activity slides the microtubule and attached spindle toward the anchored motor (Fig. 5A; Supplementary Material, Video S1; 39,40). The frequency of sliding events was calculated as the number of sliding events divided by the total number of microtubule–cortex collisions observed in the 10 min imaging period, displayed as a percentage. The frequency of dynein sliding events decreased from 13.9 ± 2.39% in WT cells to 6.47 ± 1.24% in tub1-R403C and 5.74 ± 1.07% in tub1-R403H (Fig. 5B and C; Supplementary Material, Video S1–3; R403C t-test compared to WT, P = 0.0042; R403H t-test, P = 0.0012). When sliding events did occur in the mutant cells, the distance moved by the mitotic spindle was significantly decreased, from the WT average sliding distance of 1.15 ± 0.08 μm to 0.73 ± 0.15 μm in tub1-R403C and 0.77 ± 0.09 μm in R403H, respectively (Fig. 5D; R403C t-test compared to WT, P = 0.0078; R403H t-test, P = 0.0047). These data indicate that when tub1-R403C/H mutant microtubules hit the cortex, they rarely initiate a dynein sliding event. Additionally, when a rare sliding event does occur, the presence of tub1-R403C/H mutants limits the extent of spindle movement. Therefore, dynein function is diminished in tub1-R403C/H mutants but not completely ablated (Supplementary Material, Video S1–4).
Figure 5.
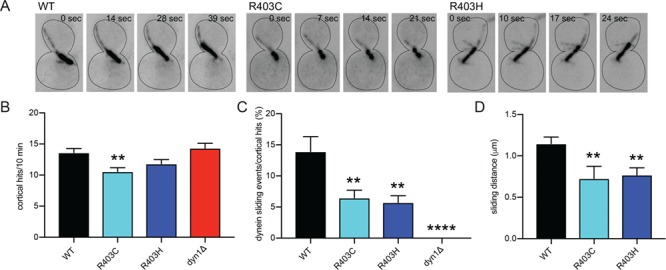
α-tubulin R402C/H mutants disrupt dynein activity in S. cerevisiae. (A) Time-lapse images of WT, tub1-R403C or tub1-R403H cells labeled with GFP-Tub1, GFP-tub1-R403C or GFP-tub1-R403H, respectively, to illustrate representative dynein sliding events. Dynein sliding is defined by spindle translocation initiated by a microtubule–cortex interaction. (B) Quantification of microtubule–cortical hits in a 10 min period. (C) Percent of microtubule–cortex hits that become dynein sliding events in a 10 min period. (D) Quantification of average sliding distance, measured by spindle translocation during sliding event (μm). At least 34 cells were analyzed for each strain. Data are represented as mean ± SEM. Double asterisks indicate significant difference compared to WT, by t-test (P < 0.01). Quadruple asterisks indicate significant difference compared to WT, by t-test (P < 0.0001). Strains: WT, yJM1887; dyn1∆, 1023; tub1-R403C, yJM2216; tub1-R403H, yJM2218.
We also assessed dynein function in tub1-R403C/H cells using a genetic assay. When dynein function is disrupted, yeast cells position the mitotic spindle through a compensatory pathway involving Bim1 and myosin-trafficking along F-actin cables. Therefore, yeast cells can divide when one pathway is compromised but are inviable when both pathways are blocked. To genetically test whether the tub1-R403C/H mutants are acting to disrupt the dynein pathway, we generated double mutant strains combining tub1-R403C/H mutants with dyn1∆ or bim1∆ null mutations by meiotic cross (Supplementary Material, Table S3). Double mutants combining tub1-R403C or tub1-R403H mutations with bim1∆ exhibit significantly impaired growth (Fig. 6A and B), consistent with tub1-R403C/H mutants disrupting dynein-mediated spindle positioning. Importantly, the phenotypes of tub1-R403C/H mutants in this assay are less severe than complete loss of dynein, as combining dyn1∆ with bim1∆ almost always led to inviability (Supplementary Material, Table S3). In addition, we found that double mutants combining tub1-R403C or tub1-R403H mutations with dyn1∆ do not exhibit growth defects that are more severe than the individual mutants alone (Fig. 6C and D). This confirms that R403C/H mutants disrupt but do not completely ablate dynein function.
Figure 6.
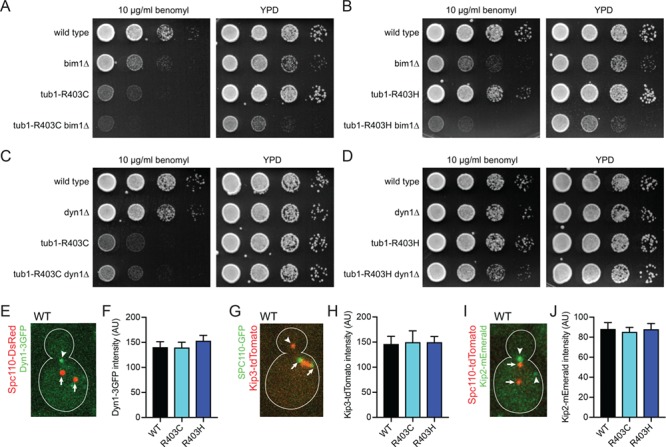
α-tubulin R402C/H mutants in S. cerevisiae act in the dynein spindle positioning pathway. (A and B) Genetic interaction test of tub1-R403C (A) and tub1-R403H (B) mutants with bim1∆, a member of the compensatory spindle positioning pathway. Indicated strains were grown on rich media or rich media supplemented with benomyl (10 μg/ml), incubated at 30°C. Strains: WT, yJM2243, yJM2252; bim1∆, yJM2246, yJM2249; tub1-R403C, yJM2245; tub1-R403C bim1∆, yJM2244; tub1-R403H, yJM2251; tub1-R403H bim1∆, yJM2250. (C and D) Genetic interaction test of tub1-R403C (C) and tub1-R403H (D) mutants with dyn1∆. Indicated strains were grown on rich media or rich media supplemented with benomyl (10 μg/ml), incubated at 30°C. Strains: WT, yJM2256, yJM2261; dyn1∆, yJM2255, yJM2264; tub1-R403C, yJM2258; tub1-R403C dyn1∆, yJM2257; tub1-R403H, yJM2263; tub1-R403H dyn1∆, yJM2262. (E) Image of a WT cell expressing Dyn1-3GFP and spindle pole marker Spc110-DsRed. Arrowhead points to dynein localized to astral microtubule plus end. Arrows point to spindle pole bodies. (F) Quantification of GFP signal at microtubule plus ends. At least 39 dynein-plus-end foci were measured for each strain. Error bars are SEM. Strains: WT, yJM0307, yJM0308; tub1-R403C, yJM2202, yJM2203; tub1-R403H, yJM2204. (G) Image of a WT cell expressing Kip3-tdTomato and Spc110-GFP. Arrowhead points to Kip3 accumulated at astral microtubule plus end. Arrows point to spindle pole bodies. (H) Quantification of tdTomato signal at plus ends. At least 20 Kip3-plus-end foci were measured for each strain. Data are represented as mean ± SEM. Strains: WT, yJM2696, yJM2716; tub1-R403C, yJM2698, yJM2718; tub1-R403H, yJM2697, yJM2717. (I) Image of a WT cell expressing Kip2-mEmerald and Spc110-tdTomato. Arrowheads point to Kip2 accumulated at astral microtubule plus end. Arrows point to spindle pole bodies. (J) Quantification of mEmerald signal at plus ends. 40 Kip2-plus-end foci were measured for each strain. Data are represented as mean ± SEM. Strains: WT, yJM2693, yJM3177; tub1-R403C, yJM2694, yJM3178; tub1-R403H, yJM2695, yJM2715.
The disruption of dynein activity could be caused by a failure of dynein to be recruited to the microtubule plus end. Dynein is recruited through interactions with binding partners, independent of its own microtubule-binding activity (41–43). We assessed dynein recruitment by measuring the intensity of GFP-tagged dynein on the plus ends of microtubules (Fig. 6E and F). We find that dynein localization is not altered in the tub1-R403C/H cells and that the GFP signal intensity is not significantly different in either mutant condition (R403C t-test compared to WT, P = 0.96; R403H t-test, P = 0.38; Fig. 6F). Therefore, the dynein defect observed in tub1-R403H and tub1-403C mutants is not likely to be caused by a failure to recruit dynein to microtubule plus ends.
Dynein and kinesin bind to nearby regions of the microtubule surface (44). We asked whether tub1-R403C/H mutants also disrupt the activities of kinesins. We measured the intensity of the kinesin-8 motor Kip3 labeled with tdTomato and the kinesin Kip2 labeled with mEmerald in tub1-R403C/H yeast strains (Fig. 6G–J). Both Kip3 and Kip2 motor proteins walk processively along microtubules and accumulate at plus ends to influence microtubule dynamics (41,45). We observed no significant difference in the intensity of Kip3-tdTomato or Kip2-mEmerald on microtubule plus ends in either mutant condition compared to WT, indicating that Kip3 and Kip2 binding and plus-end motility are not altered by tub1-R403C/H (Fig. 6H; R403C t-test compared to WT, P = 0.90; R403H t-test, P = 0.86; Fig. 6J; R403C t-test compared to WT, P = 0.70; R403H t-test, P = 0.98). This suggests that R403C and R403H substitutions disrupt dynein but do not lead to wide-spread interference with interactions between microtubules and all motors.
Dynein activity disruption scales with Tub1-R403H mutant alleles present in cells
Finally, we asked whether the dynein defect scales with the abundance of mutant α-tubulin in microtubules. Our results show that dynein activity is significantly disrupted in tub1-R403C/H haploid cells that also express the WT TUB3α-tubulin isotype (Figs 5A–D and 6A–D). We sought to analyze dynein activity in cells expressing only mutant α-tubulin, by generating haploid cells that contain tub1-R403H α-tubulin but lack the minor α-tubulin isotype TUB3 (tub1-R403H tub3∆). tub1-R403H is viable as the only copy of α-tubulin, but tub1-R403C mutant cells do not survive in the absence of TUB3 (Supplementary Material, Table S3). Microtubules in tub1-R403H tub3∆ mutant cells collide with the cortex less frequently than in tub1-R403H with a WT TUB3 (Fig. 7A). Even taking this into consideration, the tub1-R403H tub3∆ mutant cells exhibit a more severe loss of dynein phenotype than cells expressing tub1-R403H in combination with WT TUB3 (Fig. 7B). This indicates that the presence of some WT α-tubulin in tub1-R403H mutant cells partially supports dynein function. As a second approach, we assayed diploid yeast strains that were either homozygous for WT TUB1, heterozygous for tub1-R403H or homozygous for tub1-R403H. In this experiment, all the genotypes analyzed include two copies of WT TUB3. Of these diploid strains, the homozygous tub1-R403H mutant exhibits the most severe disruption of dynein activity (Fig. 7C). The heterozygous mutant strain shows a slight, but not significant, defect in dynein activity compared to WT. Therefore, our results demonstrate that dynein disruption by tub1-R403H increases with the relative abundance of mutant α-tubulin in the cell.
Figure 7.
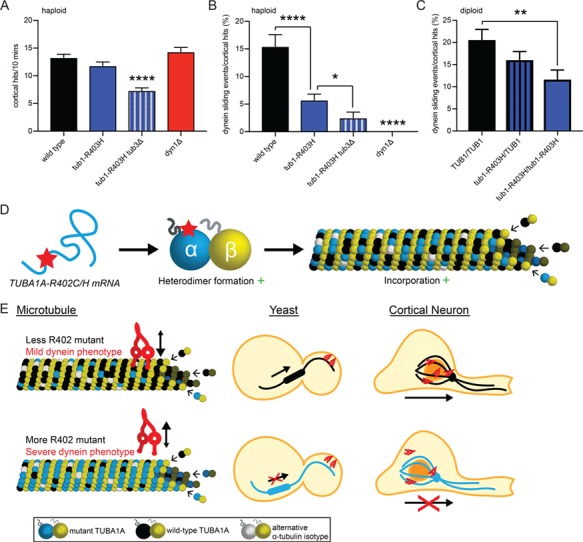
Dynein activity disruption scales with abundance of α-tubulin R402 mutant. (A) Quantification of microtubule–cortical hits in a 10 min period for the indicated strains. (B) Quantification of dynein sliding events normalized to microtubule–cortical hits in haploid cells with varying levels of tub1-R403H mutant, displayed as percentage. At least 27 cells were analyzed for each strain. Data are represented as mean ± SEM. Single asterisks indicate significant difference compared to WT, by t-test (P < 0.05). Quadruple asterisks indicate significant difference compared to WT, by t-test (P < 0.0001). Strains: WT, yJM1887, yJM1237; tub1-R403H, yJM2218; tub1-R403H tub3∆, yJM2654; dyn1∆, 1023. (C) Quantification of dynein sliding events normalized to microtubule–cortical hits in diploid cells with varying levels of tub1-R403H mutant, displayed as percentage. At least 30 cells were analyzed for each strain. Data are represented as mean ± SEM. Strains: WT, yJM2711; tub1-R403H/TUB1, yJM2655, yJM2656; tub1-R403H/tub1-R403H, yJM2712. (D–F) Model of α-tubulin R402C and R402H mechanism of action. (D) R402C/H mutants form appropriate tubulin heterodimers that incorporate into microtubules. (E) Disruption of dynein–microtubule interaction scales with abundance of R402C/H mutant in the microtubule. With less R402C/H mutant incorporation, dynein actively slides microtubules to orient the mitotic spindle in yeast cells and neurons can migrate in the developing cortex. With more R402C/H mutant incorporation, dynein cannot appropriately orient the mitotic spindle in yeast cells and neurons fail to migrate out of the ventricular zone.
Discussion
Our finding that ectopic expression of TUBA1A-R402C/H alleles in the developing mouse cortex causes neuronal migration defects supports a causal role of human TUBA1A mutations in lissencephaly. We provide insights into how TUBA1A substitutions at conserved residue R402 impact molecular level interactions with dynein. Consistent with previous findings that tub1-R403A ablates dynein binding in vitro (46), we discovered that tub1-R403C/H patient-derived mutants lead to significant disruption of dynein activity in live cells. Our results indicate that TUBA1A-R402C and TUBA1A-R402H act dominantly to disrupt microtubule function, rather than leading to haploinsufficiency as predicted for other previously described TUBA1A mutations identified in mouse models (7,47,48). Based on the marked defect in cortical migration (Fig. 1; Supplementary Material, Fig. S1) and the inhibition of dynein activity by tub1-R403 mutant yeast cells (Figs 5A–D and 6A–D), we propose a model in which TUBA1A-R402C/H mutants are assembled into microtubules and ‘poison’ the lattice by failing to support dynein activity, and this dynein impairment ultimately leads to migration failure during brain development (Fig. 7D and E).
The molecular consequences of TUBA1A mutations have been speculated upon, but few studies have sought to address this important issue. Previous data have provided evidence that many identified TUBA1A mutations may lead to haploinsufficiency, resulting in fewer stable tubulin heterodimers for neurons to use for important microtubule functions (12,21). Whether R402 mutants in patients deplete the pool of functional heterodimers or assemble into microtubules and disrupt important functions of the microtubule network is a point of controversy. Our results suggest that TUBA1A-R402C and TUBA1A-R402H mutant tubulin acts in a dominant fashion, forming tubulin heterodimers that incorporate into microtubules to disrupt neuronal migration even when appropriate levels of WT TUBA1A are present (Fig. 7D and E). Our results reveal that R402C/H α-tubulin mutants are sufficient to cause strong dynein activity perturbations and lead to subtle but significant changes in microtubule polymerization. Both molecular-level consequences may contribute to the dominant cortical neuron migration phenotype.
Our findings suggest that TUBA1A-R402C/H mutants act dominantly by appropriately incorporating into microtubules and disrupting dynein function. It is important to note that in our neuronal migration studies, cortical neurons contain two endogenous copies of WT Tuba1a. If the TUBA1A-R402C/H alleles identified in patients acted only to diminish the amount of functional tubulin heterodimer within a cell, then ectopic expression of mutant alleles would not be predicted to alter cortical formation in this system. On the contrary, we find that ectopic expression of TUBA1A-R402C/H mutants dominantly disrupts neuron migration, causing neurons with high GFP expression to be trapped in the ventricular zone. In budding yeast, greater interference of dynein activity is observed with increased expression of mutant α-tubulin in the cell. Increasing the relative abundance of tub1-R403H α-tubulin in the cell leads to more severe reduction of dynein sliding events (Fig. 7B and C). Dynein-mediated sliding activity is diminished in haploid tub1-R403C/H cells and decreases even further in haploid tub1-R403H mutant cells lacking the alternative α-tubulin isotype TUB3. Similarly, in diploid cells, the heterozygous mutant tub1-R403H/TUB1 trends toward decreased dynein sliding frequency, but the decrease does not become significant until both TUB1 genes harbor the R403H substitution. Additionally, our data reveal that neuronal migration disruption is more severe in cells exhibiting high GFP expression. While we are unable to directly measure mutant tubulin levels in high- and low-GFP neurons, these results hint that neurons expressing lower levels of the TUBA1A-R402C or TUBA1A-R402H vectors escape the ventricular zone to populate the cortical plate (Fig. 1D–F; Supplementary Material, Fig. S1B). This may indicate that neurons can overcome the dynein-inhibitory effect of the TUBA1A-R402C/H mutants if they contain a high enough ratio of WT Tuba1a:TUBA1A-R402C/H protein, as our yeast results support. Interestingly, the TUBA1A-R402H neurons that reached the cortical plate exhibited significantly less GFP fluorescence than TUBA1A-R402C expressing neurons in the cortical plate (Fig. 1F; R402C t-test compared to R402H, P = 0.0049), suggesting that TUBA1A-R402H may be more detrimental to neuronal migration than TUBA1A-R402C. These data are consistent with published patient data in which patients with TUBA1A-R402H mutations tend to display more severe lissencephaly phenotypes than patients with TUBA1A-R402C mutations (1,7,8,10–12,30). Together, these data predict that the tubulin composition in the developing brains of patients, especially the levels of mutant TUBA1A compared to WT α-tubulin, can contribute greatly to the severity of brain malformation observed.
Why might these specific molecular perturbations to TUBA1A be uniquely detrimental to cortical development? Expression of α-tubulin isotypes is tightly regulated both by cell type and through developmental time. TUBA1A is highly upregulated in post-mitotic neurons during development but is not found in neuronal progenitors, glia cells or other organ systems, excepting one report of low TUBA1A mRNA levels in the testes and lungs (3–6,16,27). The tight restriction of TUBA1A expression to developing post-mitotic neurons accounts for the human phenotypes being limited to the nervous system, with cortical malformation as the hallmark of TUBA1A disorders. TUBA1A is not the only tubulin isotype to have been linked to tubulinopathies, as mutations have been identified in β-tubulin isotypes TUBB2B, TUBB3 and TUBB5, but TUBA1A is the only α-tubulin isotype found to associate with human disorders. This suggests that either (1) mutations to other α-tubulin isotypes may not lead to dominant phenotypes during brain development; or (2) mutations to other more ubiquitously expressed α-tubulin isotypes may disrupt development so severely, perhaps by perturbing mitotic division, that they are not compatible with life. The restriction of disease-causing mutations to TUBA1A points to this isotype being particularly important for neurodevelopment.
Given the strong disruption of TUBA1A-R402C/H mutants on cortical migration, we were surprised by the lack of microtubule function disruption in primary neuronal cultures ectopically expressing mutant alleles, despite using the same expression vector scheme for both sets of experiments. Most strikingly, neurons containing microtubule polymerization-blocking mutant T349E did not exhibit decreases in axonal microtubule polymerization rates (Fig. 3B and C). Additionally, despite the dynein phenotype associated with R403C/H mutants in the yeast system, the cultured neurons containing ectopic TUBA1A-R402C/H vectors did not exhibit dynein disruption as measured by retrograde lysosome trafficking (Supplementary Material, Fig. S3). Our experiments were designed to minimize potential sources of variability between conditions. In our system, we express untagged TUBA1A alleles and fluorescently tagged MACF43 from the same vector. We selected GFP-MACF43 to mark the growing plus ends of microtubules instead of introducing fluorescently tagged EB proteins. While the addition of EB1 increases microtubule polymerization rate (33), MACF43 acts as a more insert marker by interacting with endogenous EB1 to track microtubule tips (49). Thus, our microtubule polymerization rates are slower than previous reports utilizing an ectopic TUBA1A expression system with tagged EB proteins (21,47) and are consistent with rates observed in mammalian neuronal systems using GFP-MACF43 (32). We controlled for the neuronal environment that we sampled, analyzing only anterograde microtubules polymerizing in DIV11 axons a consistent distance from the soma. Importantly, we conducted multiple sets of experiments encompassing numerous primary neuron preparations and vector nucleofection. Over the course of the experiments, we observed a large spread in microtubule polymerization rate data (Fig. 3B and C). We observed cells with slow polymerization and cells with fast polymerization in each condition, with cells from the same neuronal preparation exhibiting similar rates. This suggests that there is inherent variability between primary neuron preparations that must be taken into consideration when analyzing microtubule polymerization events. Based on these data, we conclude that even when evaluating mutants that should form stable heterodimers and drastically disrupt microtubule polymerization (Fig. 3B and C) (31), ectopic expression of TUBA1A mutant alleles is not sufficient to disrupt the axonal microtubule network in primary cortical cultures. Accordingly, we propose that the reported negative data does not reflect the physiological consequences of TUBA1A-R402C/H in tubulinopathy patients. Tubulinopathy patients express heterozygous TUBA1A mutations; therefore, approximately half of the available TUBA1A in patients is mutant TUBA1A. In contrast, the primary rat cortical neurons analyzed in this study express exogenous TUBA1A mutants from a plasmid in addition to the two endogenous WT Tuba1a copies present. RT-qPCR analysis on RNA isolated from the nucleofected, GFP-positive neuronal population suggests that the ectopic TUBA1A mRNA is present at ~50% of the endogenous Tuba1a expressed in the cell. Because our results manipulating yeast α-tubulin alleles suggest that mutant phenotypes can be greatly influenced by the amount of mutant α-tubulin present in the cell (Fig. 7C), it is possible that the level of mutant tubulin expressed in the primary neuronal system is not sufficient to impact microtubule dynamics or disrupt dynein motors to the extent where a lysosome trafficking phenotype is discernable. Therefore, it may be prudent for researchers to consider novel methods for studying tubulin mutants under endogenous expression to assess complex neuronal phenotypes.
The disruption of dynein activity by tub1-R403 mutants in yeast is likely to produce similar effects to TUBA1A-R402C/H in the mammalian system. Although mammalian dynein exhibits important functional differences compared to yeast dynein, including regulation by adaptor proteins that alter motility and cargo selectivity for diverse functions (50–52), the interface between the microtubule-binding domain of dynein heavy chain and its tubulin substrate is strongly conserved across species (46,53). Arginine 402/403 of α-tubulin is part of this interface and is invariant from yeast to mammals (Fig. 4D). Furthermore, it is well established that dynein heavy chain from budding yeast is an active motor on microtubules assembled from mammalian brain tubulin (54). Since the function of the dynein–microtubule interface appears to be conserved, mutations that disrupt tubulin residues within this interface would be expected to impact dyneins across species. Although our study is the first to identify a pathological tubulin mutation that disrupts dynein, pathological mutants in β-tubulin have been shown to disrupt kinesin, and this disruption is confirmed for yeast and mammalian kinesins (28,55).
The drastic disruption to cortical migration by ectopic expression of TUBA1A-R402C/H mutant alleles, but not to primary cortical neuron function, suggests that newly-born, migrating neurons are uniquely sensitive to perturbation of the TUBA1A–dynein interaction. In primary culture, we assessed retrograde lysosome trafficking and axonal microtubule orientation, processes that are also dependent on dynein activity (56–59), but found no significant disruption to lysosome movement or microtubule polarity in axons of neurons ectopically expressing TUBA1A-R402C/H alleles (Supplementary Material, Figs S2 and S3). As discussed above, these negative results may be attributable to the failure of the primary neuron system to capture sensitive phenotypes associated with ectopic expression of mutant tubulins. Specifically, there may be differences in the levels of mutant TUBA1A-R402C/H relative to WT Tuba1a in these systems, with a higher ratio of WT Tuba1a able to mask the consequences of the TUBA1A-R402C/H mutants in the primary neurons that originate from early postnatal cortex but not in newly born migrating neurons in the developing cortex. This notion is consistent with our finding that levels of mutant tubulin may determine the severity of the phenotype (Figs 1D–F, 7B and C). Alternatively, the difference in sensitivity of these two systems may be due to dynein's critical role in neuronal migration, an important stage of cortical development that is not observed in neuronal culture.
Mutations that alter the same residue of TUBA1A but lead to different side-chain substitutions have been identified in tubulinopathy patients, but the molecular consequence of the different substitutions remains unclear. While both the spectrum of lissencephaly phenotypes observed in patients and the cortical migration phenotypes caused by the two substitutions, TUBA1A-R402C and TUBA1A-R402H, are nearly indistinguishable (Fig. 1; Supplementary Material, Fig. S1), we find that replacing the native arginine with cysteine or histidine leads to distinct molecular consequences for α-tubulin function. Whereas replacing the native arginine with histidine, another basic amino acid, mainly leads to dynein disruption with no other obvious phenotypes seen in yeast (Figs 5 and 6), replacing arginine with cysteine, a neutral, nucleophilic residue, not only disrupts dynein but also leads to additional phenotypes in yeast growth and genetic assays (Figs 4F and G, 6A–D; Supplementary Material, Table S3). tub1-R403C, but not tub1-R403H, leads to a drastic reduction of yeast growth when cells are stressed with the microtubule-destabilizing drug, benomyl, and is not viable as the sole copy of α-tubulin (Figs 4F and G, 6A and C; Supplementary Material, Table S3). This difference may be due to the positively charged arginine providing important intra-tubulin stabilization by forming a salt bridge with E416 on the negatively charged surface of α-tubulin, which has been proposed based on structural data (46). The neutral cysteine substitution may disrupt this salt bridge while the basic histidine supports it. This suggests that tubulinopathy phenotypes arise not only merely from the loss of the native residue, but also from the gain of the substituted side chain. This is important when considering several other patient-derived TUBA1A mutants that affect the same residues but lead to the introduction of different side chains.
In conclusion, patient mutations identified in TUBA1A at residue R402 disrupt dynein activity and dominantly cause a pronounced cortical neuron migration defect. Our results demonstrate that the TUBA1A-R402 mutants are causal for the lissencephaly phenotype observed in patients and that the amount of TUBA1A-R402C/H in the microtubule network contributes to the severity of the phenotype. This work reveals that patient-derived mutations to tubulin genes can provide important insight into diverse roles of microtubules in appropriate brain development. Future studies into additional mutations may shed light on other important microtubule-mediated functions in neurodevelopment.
Materials and Methods
Neuronal expression vectors
Expression constructs used in this study are listed in Supplementary Material, Table S7. The coding region of human TUBA1A from the Mammalian Genome Collection (clone ID:LIFESEQ6302156) was cloned into the multiple cloning site of pCIG2 plasmids using sticky-end cloning with XhoI and PstI. QuikChange Lightning Site-Directed Mutagenesis Kit (Agilent Technologies, Santa Clara, CA) was used to introduce the p.R402C or p.R402H substitution to TUBA1A. Mutations were confirmed by sequencing across the complete TUBA1A coding region. For experiments measuring microtubule polymerization in cells expressing TUBA1A mutants, GFP-MACF43 was cloned into the pCIG2-TUBA1A constructs. GFP-MACF43 construct was generously gifted by Casper Hoogenraad and Laura Ann Lowry, and we used these to create GFP-MACF43-expressing pCIG2 plasmids using sticky-end cloning to place MACF43 after the encoded GFP with BsrGI and NotI. To assess axonal trafficking, an mNeonGreen-Lysosomes-20 [Rattus norvegicus lysosomal membrane glycoprotein 1 (LAMP1; NM_012857.1)] fusion was obtained from Allele Biotechnology and Pharmaceuticals (San Diego, CA), Inc. (60) and cloned into pCIG2 using NEB Gibson Assembly Cloning Kit (NEB #E2611) to replace cytosolic GFP. Oligos used for plasmid construction are listed in Supplementary Material, Table S7. The same pCIG2 constructs were used for both the in vivo migration assay and the primary neuronal culture morphology assay, with neurons producing cytosolic GFP and mutant, WT or no additional TUBA1A under the same expression regulation.
In utero electroporation
In utero electroporation was performed on E14.5 embryos from timed pregnant mice. Endotoxin-free plasmid DNA (see ‘Neuronal expression vectors’ section, above) was prepared with fast green dye (1% stock) to a concentration of 1 μg/μl in TE buffer (10mm Tris base, 1mm EDTA Solution, pH 8.0). Plasmid DNA was injected into the lateral ventricles of the exposed embryos and electroporated with 5 pulses at 40 V separated by 900 ms. Embryos were returned and allowed to develop to E18.5, at which point their brains were dissected and fixed in 4% paraformaldehyde overnight at 4°C. Brains were sectioned coronally with a vibrating microtome (VT1200S; Leica, Buffalo Grove, IL) at 50 um thick sections. Sections were then mounted, imaged on a Nikon (Minato, Tokyo, Japan) spinning disc confocal microscope with a 0.3 Numerical Aperture (NA) 10× Plan Fluor objective and analyzed to assess migration of electroporated cells. Analysis includes at least four animals for each condition.
Primary cortical cultures
For primary cortical neuronal cultures, the frontal cortex was dissected from postnatal days 0–2 male and female neonatal Sprague Dawley rats. Frontal cortex was dissociated at room temperature for 1 h using digestion with papain solution containing 20 units/ml papain (Worthington, Columbus, OH, LS003126), 1.5 mm CaCl2 (Sigma-Aldrich, St. Louis, MO, 223506), 0.5 mm EDTA (Fisher Scientific, Waltham, MA, BP118-500), 1 mm NaOH (Fisher Scientific, BP359-500O) and 0.2 mg/ml cysteine (Sigma-Aldrich, C6852) in 10 ml dissection saline. After removing papain solution with six washes with Minimum Essential Media (MEM) (Life Technologies, Carlsbad, CA, 11090-081), cells were gently dissociated first with a wide-bore fire-polished pipette, then with a narrow-bore polished pipette. Plasmid DNA was introduced to 4 × 10⁶ neurons using Amaxa rat nucleofector kit (Lonza Bioscience, Basel, Switzerland, VPG-1003), and then 500 000 Amaxa-treated neurons were plated per poly-D-lysine-coated glass bottom dish (WillCo Wells, HBST-3522) in MEM supplemented with 10% Fetal Bovine Serum (FBS) (Sigma-Aldrich), 1% penicillin/streptomycin (Gibco, 15070-063) and 25 μm L-glutamine (Gibco, 25030081). After 2 h, media was replaced with fresh, supplemented MEM. After 24 h, media was replaced with Neurobasal-A (NBA; Life technologies, 10888-022) supplemented with 2% B27 (10 ml vial in 500 ml NBA; Gibco, 17504-044) and 10 μm mitotic inhibitors (uridine/fluoro-deoxyuridine; Sigma-Aldrich, U3003/F0503). Neurons were maintained in a humidified incubator at 37°C with 5% CO2. Cells were then fed with supplemented NBA on DIV7. Neurons were imaged and analyzed on DIV11.
Neuron immunocytochemistry
Primary cortical neuronal cultures were prepared as described above. On DIV11, neurons were washed twice with 1× phosphate-buffered saline (PBS), fixed with 4% paraformaldehyde for 10 min at room temperature. Cells were then washed 3 times with 1× PBS, for 5 min each. Permeabilization was performed with 0.1% Triton/PBS for 10 min at room temperature, agitated and then washed with PBS. The cells were blocked in 5% Bovine Serum Albumin (BSA)/PBS for 30 min at room temperature, with agitation. Immunostaining was performed using antibodies to SMI-312 (BioLegend, #837904) and MAP2 (Novus Biologicals, #NB300-213) at concentrations of 1 μg/ml and 1:2000, respectively, for 2 h in a humidified chamber. After primary antibody staining, cells were washed 3× with PBS. Secondary antibody staining with Alexa Flour 568 donkey anti-mouse IgG (H+L) (Life technologies, #A10037) and Cy5 goat anti-chicken IgY H&L (Abcam, #ab97147) in 1% Normal Goat Serum (NGS)/PBS was performed for 1 h in a dark, humidified chamber. After washes, cells were mounted with Vectashield (Vector Laboratories, #H-1200) and imaged on a Nikon spinning disc confocal microscope with a 40× oil objective.
Time-lapse microscopy and analysis of neurons
Primary cortical neuronal cultures were prepared as described above, with relevant plasmid DNA introduced with Amaxa rat nucleofector kit (Lonza Bioscience, Basel, Switzerland). At DIV11, live primary cultured neurons were treated with an antibody to extNF [anti-pan-neurofascin (external), NeuroMab clone A12/18] as previously described (63) to label the AIS. Briefly, cells were treated with 50:50 conditioned media: fresh NBA with 50 μm (2R)-amino-5-phosphonopentanoate (APV) (Tocris Bioscience, Bristol, UK) to protect against cell death (64). Cells were then placed in primary antibody solution (extNF, 1:200) diluted in NBA-APV for 5 min at 37°C. After 3 washes in NBA-APV, cells were placed in secondary antibody solution (donkey anti-mouse A568, 1:500; Life technologies, #A10037) for 30 s at room temperature, followed by 3 washes with NBA-APV. Artificial Cerebral Spinal Fluid (ACSF) imaging media supplemented with 2 mm CaCl2 and 1 mm MgCl2 was added to the neurons, which were imaged on a Nikon spinning disc confocal microscope with a 1.3 NA 40× Plan Fluor oil objective. Cells were kept at 37°C during image acquisition. Axons were identified by presence of high extNF and were imaged for 4 min at 2.25 s intervals (to track GFP-MACF43 comets) using a 0.4 μm Z-step to cover the depth of the imaged axon or 4 min at 0.32 s intervals at 1 Z-plane (to observe Lyso-20-mNeon trafficking). The max-projected (if applicable) time-lapse videos were analyzed in ImageJ using the kymograph feature. GFP-MACF43 polymerization rates and Lyso-20-mNeon trafficking rates were determined from the slope of the line on the kymographs.
FACS sorting, RT-qPCR and expressional analysis
To isolate Amaxa-nucleofected, GFP-positive neurons for analysis, neurons were cultured as described above and removed from substrate using papain solution. Cells were reconstituted in 0.5 ml FACS buffer containing 25 mm HEPES pH 7.4 (Sigma-Aldrich, H0887), 1% BSA and Ca2+/Mg2+-free Hank's Balances Salt Solution (HBSS) (Gibco, 14175103). Prior to FACS analysis, DAPI was added at a final concentration of 1 μg/ml to select for live cells. Cells were sorted using a MoFlo XDP100 flow cytometer (Beckman Coulter). The side population and non-side population were distinguished and sorted based on the GFP profile compared to a non-nucleofected, GFP-negative control sample. GFP-positive cells were sorted directly into 350 μl RLT buffer (Qiagen, Venlo, Netherlands) for RNA isolation. RNA was isolated using the RNeasy Micro Kit (Qiagen, 74004). cDNA synthesis was performed using the iScript™ Reverse Transcription Supermix for RT-qPCR (Bio-Rad Laboratories, 1708841) with total isolated RNA for each sample. To assess transcript levels of endogenous rat Tuba1a and ectopic human TUBA1A, qRT-PCR was performed according to the SYBR Green (Bio-Rad Laboratories) protocol using the Bio-Rad CFX96 Real-Time PCR Detection System. Ywhaz and Arbp transcript levels were assessed to provide internal reference gene controls. Relative quantification analysis was performed using the equation RQ = E-∆Ct (RQ, relative quantification; E, primer efficiency value; ∆Ct, difference between cycle threshold value for gene of interest and cycle threshold value for reference gene index). Primer sequences are provided in Supplementary Material, Table S7.
Yeast strains and manipulation
General yeast manipulation, media and transformation were performed by standard methods (65). Strains are provided in Supplementary Material, Table S6. TUB1-R403C and TUB1-R403H mutant alleles were generated at the endogenous TUB1 locus using methods described by (66). The selectable marker URA3 was inserted at the TUB1 locus following the 3′UTR. An amplicon including TUB1, 3′UTR and URA3 marker was then amplified from genomic DNA by PCR, using mutagenic oligos to introduce R403C or R403H mutations, and transformed into a WT strain background. Mutations were confirmed by sequencing over the complete TUB1 genomic locus. GFP-Tub1 fusions were under the TUB1 promoter and integrated at the LEU2 locus and expressed ectopically, in addition to the native, untagged TUB1 (67). Kip3-tdTomato, Kip2-mEmerald and Bim1-mNeonGreen fusion were generated by PCR-mediated tagging at the native loci (68). The mNeonGreen plasmid DNA was originally acquired from Allele Biotechnology and Pharmaceuticals, Inc. (60). Dyn1-3GFP was generated at the native DYN1 locus using an integrating plasmid (42). TUB3 was deleted by replacing the native coding sequence with the kanMX6 marker, using conventional PCR-mediated methods (61). DYN1 and BIM1 were knocked out using the same method but replaced with HIS3MX6. Oligos used for plasmid and yeast strain construction are listed in Supplementary Material, Table S7.
Yeast growth assays
Cells were grown to saturation at 30°C in 4 ml YPD (yeast extract, peptone, dextrose; rich media) and then a 10-fold dilution series of each strain was spotted to a YPD plate and a YPD plate supplemented with 10 μg/ml benomyl (Sigma-Aldrich, #381586). YPD plates were incubated at 30°C for 3 days, and benomyl supplemented plates were grown at 30°C for 4 days.
Western blots of α-tubulin levels in yeast
Cell cultures were grown shaking at 30°C until log phase in 5 ml YPD. Cells were then resuspended in chilled lysis buffer (6 mm Na2HPO4, 4 mm NaH2PO4, 1% NP40, 150 mm NaCl, 2 mm EDTA, 50 mm NaF, 4 μg/μl leupeptin and 0.1 mm Na3VO4) with 1× fungal protease inhibitor cocktail (Sigma-Aldrich, #P8215) and lysed by 5 cycles of bead beating at 4°C. Cells were centrifuged to obtain the clarified lysate. Total protein concentration was determined by Bradford assay and all samples were normalized to 1.2 μg/μl. Samples were prepared with Laemmli sample buffer and β-mercaptoethanol, and then 24 μg of each lysate was loaded per lane onto a 10% SDS-PAGE gel. After running the gels, the samples were transferred to a PVDF membrane and blocked in Odyssey (LI-COR Biosciences,, Lincoln, NE, #927-40000) buffer overnight at 4°C. Membranes were probed with mouse-anti-α-tubulin (4A1; AB_2732839; 1:100; (69)) and rabbit-anti-Zwf1 (Sigma-Aldrich, A9521; AB_258454; 1:10 000), followed by secondary antibodies goat-anti-mouse-680 (LI-COR Biosciences, #926-68070; 1:15 000) and goat-anti-rabbit-800 (LI-COR Biosciences, #926-32211; 1:15 000) and imaged on an Odyssey Imager (LI-COR Biosciences). α-tubulin band intensity was analyzed in ImageJ, and the intensity of the slower migrating Tub1 isotype was compared to the amount of total α-tubulin.
Yeast microscopy and image analysis
For time-lapse imaging of microtubule dynamics and sliding, living cells were grown asynchronously at 30°C to early log phase in non-fluorescent medium, mounted on coverslips coated with concanavalin A (2 mg/ml; Sigma-Aldrich, #C2010) and sealed with VALAP (vasoline:lanolin:paraffin at 1:1:1) (62). Imaging was performed on a Nikon Ti-E microscope equipped with a 1.45 NA 100× CFI Plan Apo objective; piezoelectric stage (Physik Instrumente, Auburn, MA); spinning disc confocal scanner unit (CSU10; Yokogawa Electric Corporation, Musashino, Tokyo, Japan); 405, 488, 561 and 640 nm lasers (Agilent Technologies); and an Electron Multiplying Charge Coupled Device (EMCCD) camera (iXon Ultra 897; Andor Technology, Belfast, UK) using NIS Elements software (Nikon) (hereafter referred to as Nikon spinning disc confocal microscope). During acquisition, stage temperature was 25°C. Images were analyzed using ImageJ (National Institutes of Health, downloaded from https://imagej.nih.gov).
Yeast microtubule dynamics analysis
Microtubule dynamics were analyzed as described in (62). The lengths of astral microtubules were determined by the localization of the plus-end tracking protein Bim1-mNeonGreen, imaged at 4 or 5 s intervals for 10 min. Only astral microtubules from pre-anaphase cells were measured for this analysis. Polymerization and depolymerization events were defined as at least 3 contiguous data points that produced a length change of ≥0.5 μm with a coefficient of determination of ≥0.8. Microtubule dynamicity was calculated by the total change in length divided by the change in time and expressed in tubulin subunits changed per second (70). At least 15 astral microtubules were analyzed for each genotype. Dynamics measurements for individual microtubules were pooled by genotype and then compared with pooled data for different genotypes using a Student's t-test to assess whether the mean values for different data sets were significantly different.
Analysis of microtubule–cortex interactions and microtubule sliding
Cells expressing an integrated fusion of GFP to the N-terminus of α-tubulin (GFP-Tub1) were treated with HU, imaged and analyzed as described previously (39). Briefly, cells were arrested with HU for 2 h and imaged in time-lapse Z-series for 10 min with 4 s time interval between frames. Microtubule–cortex interactions were identified in max projections of Z-series images by the microtubule touching the cell cortex, which was identified by signal of free GFP-Tub1 subunits in the cytoplasm. Dynein sliding events were defined as spindle translocation coinciding with microtubule–cortex interaction, and the total distance and time of the spindle movement were measured.
Localization of dynein, kinesin-8/Kip3 and Kip2
Two-color images of cells expressing either Dyn1-3GFP and Spc110-DsRed, Kip3-tdTomato and Spc110-GFP, or Kip2-mEmerald and Spc110-tdTomato were collected in time-lapse, full-cell Z-series separated by 0.4 μm. Only pre-anaphase cells were used for this analysis. Z-series were collapsed into maximum intensity projections and analyzed in ImageJ. We identified the astral microtubule plus end as foci of Dyn1-3GFP or Kip3-tdTomato that were separate from the spindle pole bodies and rapidly changed position over time, since plus ends will move over time with dynamic microtubules. In contrast, cortical foci of Dyn1-3GFP were stationary in time-lapse imaging. Intensities of Dyn1-3GFP or Kip3-tdTomato signals were measured within a 397 nm2 region (630 × 630 nm). These values were adjusted for background signal by taking a background fluorescence intensity measurement of the same size adjacent to the plus end of the microtubule and then subtracting that value from the value measured at the plus end.
Supplementary Material
Acknowledgements
We are grateful to Santos Franco (University of Colorado School of Medicine) for aiding with in utero mouse cortical electroporations. We thank Matthew Kennedy and Mark del Acqua (University of Colorado School of Medicine) for providing P0-2 rat cortex. We thank Matthew Kennedy for gifting us the pCIG2 vector and Laura Anne Lowery (Boston College) and Casper Hoogenraad (Utrecht University) for sharing the GFP-MACF43 vector.
Conflict of Interest statement. None declared.
Funding
National Science Foundation Graduate Research Fellowship (1553798 to J.A.); National Institutes of Health (5R01GM112893-04 to J.K.M.); Department of Cell and Developmental Biology, University of Colorado Denver, Anschutz Medical Campus (J.K.M.).
References
- 1. Bahi-Buisson N., Poirier K., Fourniol F., Saillour Y., Valence S., Lebrun N., Hully M., Bianco C.F., Boddaert N., Elie C. et al. (2014) The wide spectrum of tubulinopathies: what are the key features for the diagnosis. Brain, 137, 1676–1700. [DOI] [PubMed] [Google Scholar]
- 2. Fallet-Bianco C., Laquerrière A., Poirier K., Razavi F., Guimiot F., Dias P., Loeuillet L., Lascelles K., Beldjord C., Carion N. et al. (2014) Mutations in tubulin genes are frequent causes of various foetal malformations of cortical development including microlissencephaly. Acta Neuropathol. Commun., 2, 69. [DOI] [PMC free article] [PubMed] [Google Scholar]
- 3. Gloster A., Wu W., Speelman A., Weiss S., Causing C., Pozniak C., Reynolds B., Chang E., Toma J.G. and Miller F.D. (1994) The T alpha 1 alpha-tubulin promoter specifies gene expression as a function of neuronal growth and regeneration in transgenic mice. J. Neurosci., 14, 7319–7330. [DOI] [PMC free article] [PubMed] [Google Scholar]
- 4. Coksaygan T., Magnus T., Cai J., Mughal M., Lepore A., Xue H., Fischer I. and Rao M.S. (2006) Neurogenesis in Talpha-1 tubulin transgenic mice during development and after injury. Exp. Neurol., 197, 475–485. [DOI] [PubMed] [Google Scholar]
- 5. Lewis S.A., Lee M.G.S. and Cowan N.J. (1985) Five mouse tubulin isotypes and their regulated expression during development. J. Cell Biol., 101, 852–861. [DOI] [PMC free article] [PubMed] [Google Scholar]
- 6. Gloster A., El-Bizri H., Bamji S.X., Rogers D. and Miller F.D. (1999) Early induction of Talpha1 alpha-tubulin transcription in neurons of the developing nervous system. J. Comp. Neurol., 405, 45–60. [DOI] [PubMed] [Google Scholar]
- 7. Keays D.A., Tian G., Poirier K., Huang G.-J., Siebold C., Cleak J., Oliver P.L., Fray M., Harvey R.J., Molnár Z. et al. (2007) Mutations in alpha-tubulin cause abnormal neuronal migration in mice and lissencephaly in humans. Cell, 128, 45–57. [DOI] [PMC free article] [PubMed] [Google Scholar]
- 8. Poirier K., Keays D.A., Francis F., Saillour Y., Bahi N., Manouvrier S., Fallet-Bianco C., Pasquier L., Toutain A., Tuy F.P.D. et al. (2007) Large spectrum of lissencephaly and pachygyria phenotypes resulting from de novo missense mutations in tubulin alpha 1A (TUBA1A). Hum. Mutat., 28, 1055–1064. [DOI] [PubMed] [Google Scholar]
- 9. Bahi-Buisson N., Poirier K., Boddaert N., Saillour Y., Castelnau L., Philip N., Buyse G., Villard L., Joriot S., Marret S. et al. (2008) Refinement of cortical dysgeneses spectrum associated with TUBA1A mutations. J. Med. Genet., 45, 647–653. [DOI] [PubMed] [Google Scholar]
- 10. Fallet-Bianco C., Loeuillet L., Poirier K., Loget P., Chapon F., Pasquier L., Saillour Y., Beldjord C., Chelly J. and Francis F. (2008) Neuropathological phenotype of a distinct form of lissencephaly associated with mutations in TUBA1A. Brain, 131, 2304–2320. [DOI] [PubMed] [Google Scholar]
- 11. Morris-Rosendahl D.J., Najm J., Lachmeijer A.M.A., Sztriha L., Martins M., Kuechler A., Haug V., Zeschnigk C., Martin P., Santos M. et al. (2008) Refining the phenotype of alpha-1a tubulin (TUBA1A) mutation in patients with classical lissencephaly. Clin. Genet., 74, 425–433. [DOI] [PubMed] [Google Scholar]
- 12. Kumar R.A., Pilz D.T., Babatz T.D., Cushion T.D., Harvey K., Topf M., Yates L., Robb S., Uyanik G., Mancini G.M.S. et al. (2010) TUBA1A mutations cause wide spectrum lissencephaly (smooth brain) and suggest that multiple neuronal migration pathways converge on alpha tubulins. Hum. Mol. Genet., 19, 2817–2827. [DOI] [PMC free article] [PubMed] [Google Scholar]
- 13. Lecourtois M., Poirier K., Friocourt G., Jaglin X., Goldenberg A., Saugier-Veber P., Chelly J. and Laquerrière A. (2010) Human lissencephaly with cerebellar hypoplasia due to mutations in TUBA1A: expansion of the foetal neuropathological phenotype. Acta Neuropathol., 119, 779–789. [DOI] [PubMed] [Google Scholar]
- 14. Poirier K., Saillour Y., Fourniol F., Francis F., Souville I., Valence S., Desguerre I., Marie Lepage J., Boddaert N., Line Jacquemont M. et al. (2013) Expanding the spectrum of TUBA1A-related cortical dysgenesis to polymicrogyria. Eur. J. Hum. Genet., 21, 381–385. [DOI] [PMC free article] [PubMed] [Google Scholar]
- 15. Cushion T.D., Dobyns W.B., Mullins J.G.L., Stoodley N., Chung S.K., Fry A.E., Hehr U., Gunny R., Aylsworth A.S., Prabhakar P. et al. (2013) Overlapping cortical malformations and mutations in TUBB2B and TUBA1A. Brain, 136, 536–548. [DOI] [PubMed] [Google Scholar]
- 16. Aiken J., Buscaglia G., Bates E.A. and Moore J.K. (2017) The α-tubulin gene TUBA1A in brain development: a key ingredient in the neuronal isotype blend. J. Dev. Biol., 5, 8. [DOI] [PMC free article] [PubMed] [Google Scholar]
- 17. Dent E.W. and Kalil K. (2001) Axon branching requires interactions between dynamic microtubules and actin filaments. J. Neurosci., 21, 9757–9769. [DOI] [PMC free article] [PubMed] [Google Scholar]
- 18. Hu J., Bai X., Bowen J.R., Dolat L., Korobova F., Yu W., Baas P.W., Svitkina T., Gallo G. and Spiliotis E.T. (2012) Septin-driven coordination of actin and microtubule remodeling regulates the collateral branching of axons. Curr. Biol., 22, 1109–1115. [DOI] [PMC free article] [PubMed] [Google Scholar]
- 19. Lin S., Liu M., Mozgova O.I., Yu W.Q. and Baas P.W. (2012) Mitotic motors coregulate microtubule patterns in axons and dendrites. J. Neurosci., 32, 14033–14049. [DOI] [PMC free article] [PubMed] [Google Scholar]
- 20. Stratton R.F., Dobyns W.B., Airhart S.D. and Ledbetter D.H. (1984) New chromosomal syndrome: Miller–Dieker syndrome and monosomy 17p13. Hum. Genet., 67, 193–200. [DOI] [PubMed] [Google Scholar]
- 21. Tian G., Jaglin X.H., Keays D.A., Francis F., Chelly J. and Cowan N.J. (2010) Disease-associated mutations in TUBA1A result in a spectrum of defects in the tubulin folding and heterodimer assembly pathway. Hum. Mol. Genet., 19, 3599–3613. [DOI] [PMC free article] [PubMed] [Google Scholar]
- 22. Sohal A.P.S., Montgomery T., Mitra D. and Ramesh V. (2012) TUBA1A mutation-associated lissencephaly: case report and review of the literature. Pediatr. Neurol., 46, 127–131. [DOI] [PubMed] [Google Scholar]
- 23. Fry A.E., Cushion T.D. and Pilz D.T. (2014) The genetics of lissencephaly. Am. J. Med. Genet. C Semin. Med. Genet., 166, 198–210. [DOI] [PubMed] [Google Scholar]
- 24. Tsai J.-W., Bremner K.H. and Vallee R.B. (2007) Dual subcellular roles for LIS1 and dynein in radial neuronal migration in live brain tissue. Nat. Neurosci., 10, 970–979. [DOI] [PubMed] [Google Scholar]
- 25. Tanaka T., Serneo F.F., Higgins C., Gambello M.J., Wynshaw-Boris A. and Gleeson J.G. (2004) Lis1 and doublecortin function with dynein to mediate coupling of the nucleus to the centrosome in neuronal migration. J. Cell Biol., 165, 709–721. [DOI] [PMC free article] [PubMed] [Google Scholar]
- 26. Moon H.M. and Wynshaw-Boris A. (2014) Cytoskeleton in action: lissencephaly, a neuronal migration disorder. Wiley Interdiscip. Rev. Dev. Biol., 2, 229–245. [DOI] [PMC free article] [PubMed] [Google Scholar]
- 27. Miller F.D., Naus C.C., Durand M., Bloom F.E. and Milner R.J. (1987) Isotypes of alpha-tubulin are differentially regulated during neuronal maturation. J. Cell Biol., 105, 3065–3073. [DOI] [PMC free article] [PubMed] [Google Scholar]
- 28. Tischfield M.A., Baris H.N., Wu C., Rudolph G., Van Maldergem L., He W., Chan W.-M., Andrews C., Demer J.L., Robertson R.L. et al. (2010) Human TUBB3 mutations perturb microtubule dynamics, kinesin interactions, and axon guidance. Cell, 140, 74–87. [DOI] [PMC free article] [PubMed] [Google Scholar]
- 29. Schatz P.J. and Botstein D. (1986) Genetically essential and nonessential alpha-tubulin genes specify functionally interchangeable proteins. Mol. Cell. Biol., 6, 3722–3733. [DOI] [PMC free article] [PubMed] [Google Scholar]
- 30. Kamiya K., Tanaka F., Ikeno M., Okumura A. and Aoki S. (2014) DTI tractography of lissencephaly caused by TUBA1A mutation. Neurol. Sci., 35, 801–803. [DOI] [PMC free article] [PubMed] [Google Scholar]
- 31. Johnson V., Ayaz P., Huddleston P. and Rice L.M. (2011) Design, overexpression, and purification of polymerization-blocked yeast αβ-tubulin mutants. Biochemistry, 50, 8636–8644. [DOI] [PubMed] [Google Scholar]
- 32. Yau K.W., Scha X.P., Tortosa E., Ste X., Holtmaat A., Kapitein L.C. and Hoogenraad C.C. (2016) Dendrites in vitro and in vivo contain microtubules of opposite polarity and axon formation correlates with uniform plus-end-out microtubule orientation. J. Neurosci., 36, 1071–1085. [DOI] [PMC free article] [PubMed] [Google Scholar]
- 33. Vitre B., Coquelle F.M., Heichette C., Garnier C., Chrétien D. and Arnal I. (2008) EB1 regulates microtubule dynamics and tubulin sheet closure in vitro. Nat. Cell Biol., 10, 415–421. [DOI] [PubMed] [Google Scholar]
- 34. Baas P.W., Deitch J.S., Black M.M. and Banker G.A. (1988) Polarity orientation of microtubules in hippocampal neurons: uniformity in the axon and nonuniformity in the dendrite. Proc. Natl. Acad. Sci. U. S. A., 85, 8335–8339. [DOI] [PMC free article] [PubMed] [Google Scholar]
- 35. Nelissen K., Smeets K., Mulder M., Hendriks J.J.A. and Ameloot M. (2010) Selection of reference genes for gene expression studies in rat oligodendrocytes using quantitative real time PCR. J. Neurosci. Methods, 187, 78–83. [DOI] [PubMed] [Google Scholar]
- 36. Zhao C., Zha Y., Wu X., Chen L., Shi J. and Cui L. (2011) The quantification of ADAMTS4 and 8 expression and selection of reference genes for quantitative real-time PCR analysis in myocardial infarction. Biomed. Pharmacother., 65, 555–559. [DOI] [PubMed] [Google Scholar]
- 37. Zhang L., Liu S., Zhang L., You H., Huang R., Sun L., He P., Chen S., Zhang H. and Xie P. (2014) Real-time qPCR identifies suitable reference genes for Borna disease virus-infected rat cortical neurons. Int. J. Mol. Sci., 15, 21825–21839. [DOI] [PMC free article] [PubMed] [Google Scholar]
- 38. Langnaese K., John R., Schweizer H., Ebmeyer U. and Keilhoff G. (2008) Selection of reference genes for quantitative real-time PCR in a rat asphyxial cardiac arrest model. BMC Mol. Biol., 9, 1–15. [DOI] [PMC free article] [PubMed] [Google Scholar]
- 39. Estrem C., Fees C.P. and Moore J.K. (2017) Dynein is regulated by the stability of its microtubule track. J. Cell Biol., 216, 2047–2058. [DOI] [PMC free article] [PubMed] [Google Scholar]
- 40. Carminati J.L. and Stearns T. (1997) Microtubules orient the mitotic spindle in yeast through dynein-dependent interactions with the cell cortex. J. Cell Biol., 138, 629–641. [DOI] [PMC free article] [PubMed] [Google Scholar]
- 41. Carvalho P., Gupta M.L., Hoyt M.A. and Pellman D. (2004) Cell cycle control of kinesin-mediated transport of Bik1 (CLIP-170) regulates microtubule stability and dynein activation. Dev. Cell, 6, 815–829. [DOI] [PubMed] [Google Scholar]
- 42. Lee W.L., Oberle J.R. and Cooper J.A. (2003) The role of the lissencephaly protein Pac1 during nuclear migration in budding yeast. J. Cell Biol., 160, 355–364. [DOI] [PMC free article] [PubMed] [Google Scholar]
- 43. Markus S.M., Punch J.J. and Lee W.-L. (2009) Motor- and tail-dependent targeting of dynein to microtubule plus ends and the cell cortex. Curr. Biol., 19, 196–205. [DOI] [PMC free article] [PubMed] [Google Scholar]
- 44. Mizuno N., Toba S., Edamatsu M., Watai-Nishii J., Hirokawa N., Toyoshima Y.Y. and Kikkawa M. (2004) Dynein and kinesin share an overlapping microtubule-binding site. EMBO J., 23, 2459–2467. [DOI] [PMC free article] [PubMed] [Google Scholar]
- 45. Gupta M.L., Carvalho P., Roof D.M. and Pellman D. (2006) Plus end-specific depolymerase activity of Kip3, a kinesin-8 protein, explains its role in positioning the yeast mitotic spindle. Nat. Cell Biol., 8, 913–923. [DOI] [PubMed] [Google Scholar]
- 46. Uchimura S., Fujii T., Takazaki H., Ayukawa R., Nishikawa Y., Minoura I., Hachikubo Y., Kurisu G., Sutoh K., Kon T. et al. (2015) A flipped ion pair at the dynein-microtubule interface is critical for dynein motility and ATPase activation. J. Cell Biol., 208, 211–222. [DOI] [PMC free article] [PubMed] [Google Scholar]
- 47. Belvindrah R., Natarajan K., Shabajee P., Bruel-Jungerman E., Bernard J., Goutierre M., Moutkine I., Jaglin X.H., Savariradjane M., Irinopoulou T. et al. (2017) Mutation of the α-tubulin Tuba1a leads to straighter microtubules and perturbs neuronal migration. J. Cell Biol., 216, 2443–2461. [DOI] [PMC free article] [PubMed] [Google Scholar]
- 48. Gartz Hanson M., Aiken J., Sietsema D.V., Sept D., Bates E.A., Niswander L. and Moore J.K. (2016) Novel α-tubulin mutation disrupts neural development and tubulin proteostasis. Dev. Biol., 409, 406–419. [DOI] [PMC free article] [PubMed] [Google Scholar]
- 49. Honnappa S., Gouveia S.M., Weisbrich A., Damberger F.F., Bhavesh N.S., Jawhari H., Grigoriev I., Rijssel F.J.A., Buey R.M., Lawera A. et al. . (2009) An EB1-binding motif acts as a microtubule tip localization signal. Cell, 138, 366–376. [DOI] [PubMed] [Google Scholar]
- 50. McKenney R.J., Huynh W., Tanenbaum M.E., Bhabha G. and Vale R.D. (2014) Activation of cytoplasmic dynein motility by dynactin-cargo adapter complexes. Science, 345, 337–341. [DOI] [PMC free article] [PubMed] [Google Scholar]
- 51. Schlager M.A., Hoang H.T., Urnavicius L., Bullock S.L. and Carter A.P. (2014) In vitro reconstitution of a highly processive recombinant human dynein complex. EMBO J., 33, 1855–1868. [DOI] [PMC free article] [PubMed] [Google Scholar]
- 52. Redwine W.B., DeSantis M.E., Hollyer I., Htet Z.M., Tran P.T., Swanson S.K., Florens L., Washburn M.P. and Reck-Peterson S.L. (2017) The human cytoplasmic dynein interactome reveals novel activators of motility. Elife, 6, 1–27. [DOI] [PMC free article] [PubMed] [Google Scholar]
- 53. Redwine W.B., Hernandez-Lopez R., Zou S., Huang J., Reck-Peterson S.L. and Leschziner A.E. (2012) Structural basis for microtubule binding and release by dynein. Science, 337, 1532–1536. [DOI] [PMC free article] [PubMed] [Google Scholar]
- 54. Reck-Peterson S.L., Yildiz A., Carter A.P., Gennerich A., Zhang N. and Vale R.D. (2006) Single-molecule analysis of dynein processivity and stepping behavior. Cell, 126, 335–348. [DOI] [PMC free article] [PubMed] [Google Scholar]
- 55. Minoura I., Takazaki H., Ayukawa R., Saruta C., Hachikubo Y., Uchimura S., Hida T., Kamiguchi H., Shimogori T. and Muto E. (2016) Reversal of axonal growth defects in an extraocular fibrosis model by engineering the kinesin-microtubule interface. Nat. Commun., 7, 1–11. [DOI] [PMC free article] [PubMed] [Google Scholar]
- 56. Arthur A.L., Yang S.Z., Abellaneda A.M. and Wildonger J. (2015) Dendrite arborization requires the dynein cofactor NudE. J. Cell Sci., 128, 2191–2201. [DOI] [PMC free article] [PubMed] [Google Scholar]
- 57. Castillo U., Winding M., Lu W. and Gelfand V.I. (2015) Interplay between kinesin-1 and cortical dynein during axonal outgrowth and microtubule organization in Drosophila neurons. Elife, 4, 1–20. [DOI] [PMC free article] [PubMed] [Google Scholar]
- 58. Rao A.N., Patil A., Black M.M., Craig E.M., Myers K.A., Yeung H.T. and Baas P.W. (2017) Cytoplasmic dynein transports axonal microtubules in a polarity-sorting manner. Cell Rep., 19, 2210–2219. [DOI] [PMC free article] [PubMed] [Google Scholar]
- 59. Schnapp B.J. and Reese T.S. (1989) Dynein is the motor for retrograde axonal transport of organelles. Proc. Natl. Acad. Sci. U. S. A., 86, 1548–1552. [DOI] [PMC free article] [PubMed] [Google Scholar]
- 60. Shaner N.C., Lambert G.G., Chammas A., Ni Y., Cranfill P.J., Baird M.A., Sell B.R., Allen J.R., Day R.N., Israelsson M. et al. (2013) A bright monomeric green fluorescent protein derived from Branchiostoma lanceolatum. Nat. Methods, 10, 407–409. [DOI] [PMC free article] [PubMed] [Google Scholar]
- 61. Petracek M.E. and Longtine M.S. (2002) PCR-based engineering of yeast genome. Methods Enzymol., 350, 445–469. [DOI] [PubMed] [Google Scholar]
- 62. Fees C.P., Estrem C. and Moore J.K. (2017) High-resolution imaging and analysis of individual astral microtubule dynamics in budding yeast. J. Vis. Exp., 1–7. [DOI] [PMC free article] [PubMed] [Google Scholar]
- 63. Dumitrescu A.S., Evans M.D. and Grubb M.S. (2016) Evaluating Tools for Live Imaging of Structural Plasticity at the Axon Initial. Segment. Front. Cell. Neurosci., 10, 268. [DOI] [PMC free article] [PubMed] [Google Scholar]
- 64. Hogins J., Crawford D.C., Zorumski C.F. and Mennerick S. (2011) Excitotoxicity triggered by neurobasal culture medium. PLoS One, 6, 1–7. [DOI] [PMC free article] [PubMed] [Google Scholar]
- 65. Amberg D.C., Burke D.J. and Strathern J.N. (2005) Methods in Yeast Genetics: A Cold Spring Harbor Laboratory Course Manual. Cold Spring Harbor Laboratory (ed), CSHL Press; 2005. [Google Scholar]
- 66. Toulmay A. and Schneiter R. (2006) A two-step method for the introduction of single or multiple defined point mutations into the genome of Saccharomyces cerevisiae. Yeast, 23, 825–831. [DOI] [PubMed] [Google Scholar]
- 67. Song S. and Lee K.S. (2001) A novel function of Saccharomyces cerevisiae CDC5 in cytokinesis. J. Cell Biol., 152, 451–469. [DOI] [PMC free article] [PubMed] [Google Scholar]
- 68. Sheff M.A. and Thorn K.S. (2004) Optimized cassettes for fluorescent protein tagging in Saccharomyces cerevisiae. Yeast, 21, 661–670. [DOI] [PubMed] [Google Scholar]
- 69. Piperno G. and Fuller M.T. (1985) Monoclonal antibodies specific for an acetylated form of alpha-tubulin recognize the antigen in cilia and flagella from a variety of organisms. J. Cell Biol., 101, 2085–2094. [DOI] [PMC free article] [PubMed] [Google Scholar]
- 70. Toso R.J., Jordan M.A., Farrell K.W., Matsumoto B. and Wilson L. (1993) Kinetic stabilization of microtubule dynamic instability in vitro by vinblastine. Biochemistry, 32, 1285–1293. [DOI] [PubMed] [Google Scholar]
Associated Data
This section collects any data citations, data availability statements, or supplementary materials included in this article.