Abstract
The nucleolus is a membraneless organelle embedded in chromatin solution inside the cell nucleus. By analyzing surface dynamics and fusion kinetics of human nucleoli in vivo, we find that the nucleolar surface exhibits subtle, but measurable, shape fluctuations and that the radius of the neck connecting two fusing nucleoli grows in time as r(t) ∼ t1/2. This is consistent with liquid droplets with low surface tension ∼ 10−6 Nm−1 coalescing within an outside fluid of high viscosity ∼ 103 Pas. Our study presents a noninvasive approach of using natural probes and their dynamics to investigate material properties of the cell and its constituents.
Material properties of the cell nucleus and its constituents are critical for all cellular processes, directly impacting the central dogma of biology [1, 2]. For example, the rheological behavior of the nucleoplasm affects the length and time scales of molecular and organelle transport inside the nucleus, yet its measurement proves nontrivial. Microrheology gave us a rare glimpse into the physical properties of the nucleoplasm [3–5], however, such approaches are invasive, requiring an injection of foreign particles into the nucleus, which only a few cells survive. Moreover, injected nuclei are in distress that can change their physical properties.
In this work, we present an alternative strategy of using physiological dynamics and events inside the human cell nucleus to infer material properties of the nucleus and its constituents in live cells. Such an approach employing natural probes is completely noninvasive. Specifically, we investigate surface fluctuations and fusion of nucleoli, the largest structures inside the nucleus, which not only reveal that nucleoli behave as liquid droplets in human cells, but also inform on the rheological behavior of the surrounding nucleoplasm.
The nucleolus is a site of ribosomal biogenesis and plays a key role in cell cycle progression and stress response [6–8]. Strikingly, the nucleolus lacks a membrane to define its boundary, yet in general it has a sphere-like shape. Although its constituents, RNA and proteins, are known, it is unclear how they hold together. Elucidating material properties of the nucleolus could provide an insight. Pioneering work in frog X. laevis oocytes found that such nucleoli are liquid-like both in vivo and reconstituted in vitro [9, 10]. However, given the many differences between the frog egg and a typical eukaryotic cell, the physical nature of the nucleolus in cells other than frog eggs remains an open question.
Elucidating nucleolar dynamics could not only help to answer this question, but also provide insight into the material properties of the nucleoplasm. While nucleolar surface fluctuations report on physical properties of the nucleolus-nucleoplasm interface, inspecting kinetics of the nucleolar fusion might resolve whether nucleoli aggregate like solid particles or coalesce like liquid droplets, as well as inform on the nucleoplasm material properties. Such knowledge is presently missing as capturing a fusion presents a major experimental challenge. This is mainly due to low nucleolar count (2–3) in human cells [11–13], a lack of biological or physical indicators of when and where a fusion will occur, and the sensitivity of cells to light preventing continuous monitoring over longer times [14]. Considering that human nucleoli change their shape and size in many diseases (e.g. cancer, Alzheimer’s and Parkinson’s disease) and aging [15–18], illuminating their material properties could help to understand the nucleolus and nucleus in both health and disease.
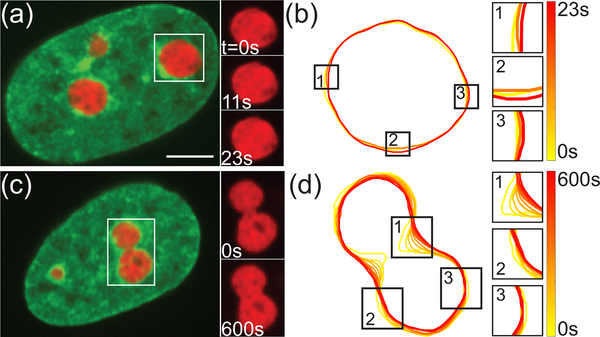
Here, we investigate the naturally occurring dynamics of: (i) the interface between nucleoli and the surrounding nucleoplasm (Fig. 1a-b), and (ii) nucleolar fusion (Fig. 1c-d), both in human HeLa cells with fluorescently labeled chromatin (H2B-GFP) and nucleoli (NPM-mApple) using spinning disc confocal microscopy (see Supplemental Material [19]).
FIG. 1.
Nucleolar dynamics in live human cells. (a) Micrograph of HeLa cell nucleus with fluorescently labeled chromatin (green, H2B-GFP) and nucleoli (red, NPM-mApple). Inset shows an enlarged view of boxed nucleolus at t = 0, 11, 23 s. (b) Contours of nucleolus from (a) at t = 0, 11, 23 s. Insets 1–3 show a zoomed in view of nucleolar surface fluctuations. (c) Micrograph of HeLa cell nucleus with fluorescently labeled chromatin (green, H2B-GFP) and two fusing nucleoli (red, NPM-mApple). Inset shows an enlarged view of boxed fusion event at t = 0 and 600 s. (d) Contours of nucleolus from (c) in 60 s intervals. Insets 1–3 show a zoomed in view of local shape changes of fusing nucleoli. Scale bar, 5 μm.
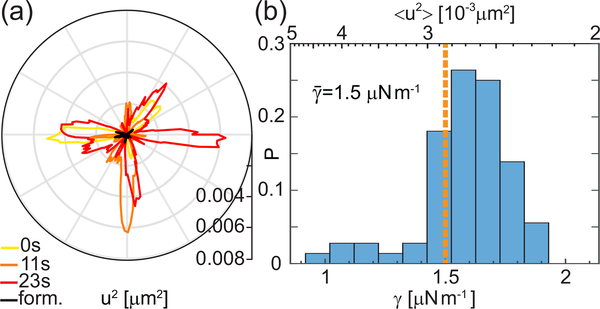
First, we observe the behavior of the nucleolus-chromatin interface at short times. We find that the nucleoli exhibit subtle, but measurable, surface shape fluctuations, consistent with a behavior of a liquid-liquid interface with a low surface tension. Specifically, we recorded high-resolution streams of live cells for 25 s with temporal resolution of 250 ms (Fig. 1a). Using custom written Matlab (Mathworks) routines we detected the nucleolar contour at each time point t (Fig. 1b). We calculated the surface fluctuations u, as deviation of the instantaneous contour r(ϕ,t) from the average contour r0(ϕ), by u(ϕ, t) = r(ϕ,t) − r0(ϕ). Fig. 2a shows u2 as a function of polar angle ϕ at three different time points, demonstrating lively dynamics of the nucleolar surface. As a negative control, we measured u2 for the cells fixed with formaldehyde showing that our measurements are well above the noise floor (black line, Fig. 2a) [20]. We obtained contours at 100 time points for 72 nucleoli from 48 cells and found u in both directions equally likely.
FIG. 2.
Nucleolar surface fluctuations in vivo. (a) Fluctuations u2 measured for the contours from Fig. 1b and a nucleolus fixed with formaldehyde (black). (b) Histogram of 〈u2〉 (top axis) and γ (bottom axis) over 72 nucleoli. For each nucleolus, γ was determined from γ = kBT/〈u2〉.
Assuming that such shape fluctuations are thermally driven, using the equipartition theorem we can estimate the surface tension as γ = kBT/〈u2〉 [21, 22]. For each nucleolus we average all u2 above the noise floor over time and polar angle to obtain 〈u2〉, from which we compute γ. Fig. 2b shows the distributions of 〈u2〉 (top axis) and γ (bottom axis) over all nucleoli, yielding an average value of . In fact, even if the shape fluctuations were actively driven and we were considering an effective temperature of ∼ 300°C measured for the nucleoplasm [23], our estimate for γ would only change by a factor of 2. Similar values of γ have been previously reported for colloid/polymer solutions [21] and frog oocyte nucleoli [9, 10].
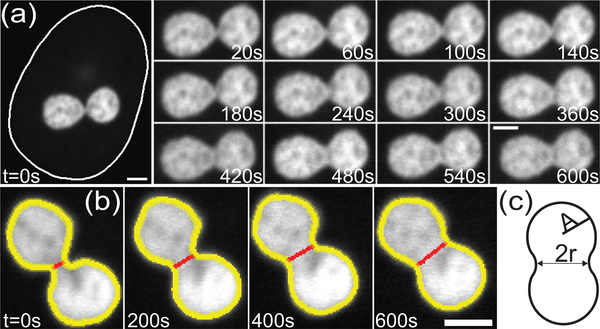
Next, we focus on the naturally occurring fusion of nucleoli, to further illuminate their rheological behavior. As described earlier, studies of nucleolar fusion dynamics are missing in cultured cells, mainly due to extremely low occurrence of fusion. Moreover, with nucleolar size of ∼1 μm and nuclear size of ∼15 μm, fusion can occur at different locations and spatial orientations throughout the cell nucleus with a discernable neck between two nucleoli formed only for a few minutes. Here, we developed an experimental procedure that allows for the first time to detect and monitor these rare events (Fig. 1c). First, we have identified cells where nucleoli appeared to be located close to each other, thus more likely to fuse, and followed them for two hours imaging every 5 min. After we detected a fusion event, we recorded a time lapse for 10 min with a time step of 20 s, which was carefully chosen to minimize photobleaching and phototoxicity, while maximizing the time resolution with which we monitor the nucleolar shape. Moreover, we selected for fusion events happening in the x-y imaging plane to use the highest spatial resolution of our imaging system (∼ 65 nm) and avoid any artifacts during analysis. At all times we recorded signals for both chromatin (H2B-GFP) and nucleolus (NPM-mApple), in order to monitor the nuclear and nucleolar shape. Fig. 3a shows an example of such a fusion event illustrating the shape evolution of two fusing nucleoli. The first frame in Fig. 3a shows the nuclear contour and the nucleolar signal. Our experiments scanned through ∼ 104 cells, where we identified ∼ 150 cells with nucleoli in close proximity in the x-y plane, which led to 14 nucleolar fusion events in total.
FIG. 3.
Timelapse of nucleolar coalescence. (a) The first frame, t = 0 s, includes the nucleolar signal and the nuclear contour (solid white outline). The later frames, 20 – 600 s, show the progress of the nucleolar fusion. Scale bar, 2μm. (b) Nucleolar contour (yellow line) and neck (red line) determined from nucleolar shape (white signal, NPM-mApple) as a function of time. Scale bar, 2 μm. (c) A cartoon illustrating measured variables: neck diameter, 2r, and average radius of the two nucleoli before fusion, A. A = (A1+A2)/2, where A1 and A2 are the radii of the two nucleoli before fusion.
To analyze the nucleolar shape during a fusion, we first obtained nucleolar contours at every time point (Fig. 3b). Nucleolar contours allow us to measure the temporal evolution of the radius r(t) of the neck between two fusing nucleoli by finding the minimum distance between two points along the contour on opposite sides (Fig. 3b). Thus, we obtain r(t) as well as A, the average radius of the two fusing nucleoli before fusion as illustrated in Fig. 3c. Our data shows that a well defined neck disappears after 10 – 15 min, while it takes ∼ 120 min for the newly formed nucleolus to become close to spherical. This suggests that while surface tension γ drives the fusion, it is rather low, which is consistent with obtained from the measurement of the nucleolar surface fluctuations.
Further, we analyze the growth dynamics of the neck radius and investigate the application of existing coalescence theories to the observed nucleolar fusion. Current models describing coalescence of liquid droplets rely on a balance of capillary forces with either viscous or inertial forces [24–28]. The viscosity of the nucleoplasm μnp, which refers to the content of the nuclear interior outside the nucleoli, i.e. chromatin solution, was previously measured by microrheology approaches to be 25 – 1000 Pas [3–5]. This is up to three orders of magnitude larger than the viscosity of nucleoli reconstituted in vitro from purified nucleolar protein nucleophosmin (NPM) and rRNA [10]. Therefore, it is conceivable that the viscous forces of the nucleoplasm provide the dominant resistance to the nucleolar coalescence. In this case, the neck radius r(t) would follow [28]:
| (1) |
where the constant C ≈ 1, γ is the surface tension, μnp is the viscosity of the outer fluid, here nucleoplasm, and A is the average radius of the droplets before fusion.
Figure 4a shows the growth of the neck radius r(t) for 14 fusion events observed. Since we initiate our measurement after a neck has formed, at that moment an unknown time t0 ≠ 0 has passed since the initial contact of the two nucleoli. Thus, to compare the nucleolar coalescence in highly viscous nucleoplasm against Eq. 1, we compute a fit r(t) = B(t + t0)1/2 for each fusion event. Since C ≈ 1, our fitting parameter with τviscous = μnpA/γ. We find t0 to vary from 20 – 310 s, which is consistent with our experimental procedure, i.e. the time between identifying the beginning of fusion and setting up the measurement. Thus we shift the measured r(t) in time by t0 to account for the delay in our measurement. After we rescale r(t + t0) by A and (t + t0) by τviscous, the data of all measured fusion events collapse on one curve ∼ t1/2 as shown in Fig. 4b. This rules out the case of nucleolus being a viscid droplet in a low viscosity fluid, as the neck radius would then follow r(t) ∼ t [26, 27]. Instead, our data suggests that while the surface tension drives the nucleolar coalescence, the high nucleoplasm viscosity slows down its kinetics.
FIG. 4.
Analysis of nucleolar coalescence data. (a) Neck radius r(t) for 14 fusion events (markers). (b) Rescaled neck radius r/A as a function of rescaled time (t + t0)/τviscous, where τviscous is a fitting parameter. Solid line represents t1/2. (c) Histogram of μnp/γ (bottom axis) and μnp (top axis) over all fusion events. For each fusion event, μnp/γ was determined from τviscous = μnpA/γ, μnp is calculated using .
Since we obtained τviscous from our measurements, we can determine the ratio μnp/γ. Using from our surface fluctuation measurements, we can compute viscosity of the nucleoplasm μnp. Fig. 4c shows a histogram of the measured values of μnp/γ (bottom axis) as well as the inferred values of μnp (top axis) ranging from 900 – 10,000 Pas, with an average value of Pas, which is in good agreement with μnp obtained by microrheology approaches [3–5]. The large range of measured μnp is likely due to the heterogeneity of the nucleoplasm. Remarkably, observing natural dynamic processes in live cells, such as nucleolar surface fluctuations and nucleolar coalescence, allows for noninvasive measurements of both γ and μnp.
It is noteworthy that nucleolar coalescence in human cells probes the coalescence theories at extreme values of Reynolds (Re) and Ohnesorge (Oh) numbers: low Re = ρvL/μnp ~ 10−15 and high , with characteristic quantities: density ρ ∼ 103 kgm−3, slow velocity v ∼ 10−9 ms−1, small length scale L ∼ 10−6 m, low γ ∼ 10−6 Nm−1 and high μnp ∼ 103 Pas. This is not only the first coalescence in live cells, but also the smallest coalescence (droplet size ∼ 1 μm), to which the existing theories have ever been applied. We find the established theories to hold also in these extreme regimes.
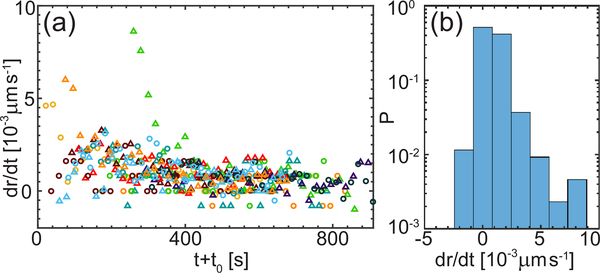
Furthermore, we evaluated the temporal evolution of the nucleolar contour by calculating the time derivative of the neck radius dr/dt. Fig. 1d shows contours for 11 time points 60 s apart with time color-coded from yellow to red. The contours were shifted to have the same center of mass to correct for the movement of the nucleolus. We measure velocities dr/dt ∼ 10−3 μms−1, which tend to decrease with progressing coalescence as depicted in Fig. 5a, while Fig. 5b shows the distribution of velocities independent of time. As mentioned earlier, nucleoli coalesce embedded in chromatin (Fig. 1c), which exhibits ATP-dependent active dynamics that is coherent over 3–5 μm [29]. Strikingly, the measured velocities for the nucleolar neck radius growth dr/dt are on the order of 10−3 μms−1, which is intriguingly similar to velocities previously measured for interphase chromatin in human cells in vivo [29].
FIG. 5.
Analysis of nucleolar neck velocity during coalescence. (a) Time derivative of neck radius dr/dt for data from Fig. 4. (b) Histogram of dr/dt, where P is the probability.
Surprisingly, nucleolar coalescence occurs in an active fluid (chromatin solution), yet it can be explained by coalescence theory for passive liquid droplets surrounded by a highly viscous passive liquid [28]. This suggests that the active chromatin solution in live cells can be effectively described by an apparent viscosity μnp of a passive fluid. This is supported by the evidence that the values of μnp that we obtain by monitoring the nucleolar coalescence are in agreement with those obtained by microrheology [3–5]. Similarly, the surface tension γ might also be an effective quantity.
We hypothesize that because the coalescence of nucleoli in vivo is slow, it is not likely to interfere with nucleolar biochemical processes, specifically, the rDNA transcription. A typical length of rDNA is ∼ 7 kbp, thus at a transcription rate of 40–80 nucleotidess−1, it takes ∼ 100 s to transcribe [6, 30]. If coalescence would happen at time scales of seconds, as it does in vitro [10], it could disrupt rDNA transcription, while at times scales of ∼ 103 s, as it happens in vivo, these processes might remain unaffected. Indeed, nucleolar integrity is closely linked to active rDNA transcription: nucleoli dissolve when this activity ceases [31].
In conclusion, using natural probes such as nucleoli and their spontaneous dynamics (coalescence, surface fluctuations) allows for noninvasive measurement of material properties of the nucleus and its constituents in live cells. Moreover, elucidating dynamics of physiological processes, such as nucleolar fusion, might allow us to gain insight into the nonequilibrium physics of live active matter.
Supplementary Material
Acknowledgments
Authors would like to thank Steven Ionov for NPM-mApple plasmid and Alexander Grosberg for critical reading of the manuscript. This research was supported by the National Institutes of Health Grant R00-GM104152 and by National Science Foundation CAREER Grant PHY-1554880.
References
- [1].Crick FH, Symp. Soc. Exp. Biol 12, 138 (1958). [PubMed] [Google Scholar]
- [2].Crick F, Nature 227, 561 (1970). [DOI] [PubMed] [Google Scholar]
- [3].Tseng Y, Lee JS, Kole TP, Jiang I, and Wirtz D, J. Cell Sci 117, 2159 (2004). [DOI] [PubMed] [Google Scholar]
- [4].de Vries AH, Krenn BE, van Driel R, Subramaniam V, and Kanger JS, Nano Lett. 7, 1424 (2007). [DOI] [PubMed] [Google Scholar]
- [5].Celedon A, Hale CM, and Wirtz D, Biophys. J. 101, 1880 (2011). [DOI] [PMC free article] [PubMed] [Google Scholar]
- [6].Alberts B, Johnson A, Lewis J, Morgan D, Raff M, Roberts K, and Walter P, Molecular biology of the cell. (Garland Science, 2014). [Google Scholar]
- [7].Montanaro L, Treré D, and Derenzini M, Am. J. Pathol. 173, 301 (2008). [DOI] [PMC free article] [PubMed] [Google Scholar]
- [8].Boulon S, Westman BJ, Hutten S, Boisvert F-M, and Lamond AI, Mol. Cell 40, 216 (2010). [DOI] [PMC free article] [PubMed] [Google Scholar]
- [9].Brangwynne CP, Mitchison TJ, and Hyman AA, Proc. Natl. Acad. Sci. U.S.A 108, 4334 (2011). [DOI] [PMC free article] [PubMed] [Google Scholar]
- [10].Feric M, Vaidya N, Harmon TS, Mitrea DM, Zhu L, Richardson TM, Kriwacki RW, Pappu RV, and Brangwynne CP, Cell 165, 1686 (2016). [DOI] [PMC free article] [PubMed] [Google Scholar]
- [11].Anastassova-Kristeva M, Cell Sci J. 25, 103 (1977). [DOI] [PubMed] [Google Scholar]
- [12].Wachtler F, Schwarzacher H, and Ellinger A, Cell Tissue Res. 225, 155 (1982). [DOI] [PubMed] [Google Scholar]
- [13].Savino TM, Gébrane-Younès J, De Mey J, Sibarita J-B, and Hernandez-Verdun D, J. Cell Biol 153, 1097 (2001). [DOI] [PMC free article] [PubMed] [Google Scholar]
- [14].Magidson V and Khodjakov A, in Methods Cell Biol, Vol. 114 (Elsevier, 2013) pp. 545–560. [DOI] [PMC free article] [PubMed] [Google Scholar]
- [15].Hannan K, Sanij E, Rothblum L, Hannan R, and Pearson RB, Biochim. Biophys. Acta Gene Regul. Mech 1829, 342 (2013). [DOI] [PMC free article] [PubMed] [Google Scholar]
- [16].Tsai RY and Pederson T, FASEB J. 28, 3290 (2014). [DOI] [PubMed] [Google Scholar]
- [17].Núñez Villacís L, Wong MS, Ferguson LL, Hein N, George AJ, and Hannan KM, BioEssays, 1700233 (2018). [DOI] [PubMed] [Google Scholar]
- [18].Tiku V and Antebi A, Trends Cell Biol. 28, 662 (2018). [DOI] [PubMed] [Google Scholar]
- [19].See Supplemental Material at url which includes experimental protocols for cell culture, microscopy and data analysis, as well as references [32, 33].
- [20].The noise floor was determined as the amplitude that captured 99% of nucleolar surface fluctuations in fixed cells.
- [21].Aarts DG, Schmidt M, and Lekkerkerker HN, Science 304, 847 (2004). [DOI] [PubMed] [Google Scholar]
- [22].Hennequin Y, Aarts D, van der Wiel J, Wegdam G, Eggers J, Lekkerkerker H, and Bonn D, Phys. Rev. Lett 97, 244502 (2006). [DOI] [PubMed] [Google Scholar]
- [23].Chu F-Y, Haley SC, and Zidovska A, Proc. Natl. Acad. Sci. U.S.A 114, 10338 (2017). [DOI] [PMC free article] [PubMed] [Google Scholar]
- [24].Eggers J, Lister JR, and Stone HA, J. Fluid Mech 401, 293 (1999). [Google Scholar]
- [25].Duchemin L, Eggers J, and Josserand C, J. Fluid Mech 487, 167 (2003). [Google Scholar]
- [26].Aarts DG, Lekkerkerker HN, Guo H, Wegdam GH, and Bonn D, Phys. Rev. Lett 95, 164503 (2005). [DOI] [PubMed] [Google Scholar]
- [27].Paulsen JD, Burton JC, and Nagel SR, Phys. Rev. Lett 106, 114501 (2011). [DOI] [PubMed] [Google Scholar]
- [28].Paulsen JD, Carmigniani R, Kannan A, Burton JC, and Nagel SR, Nat. Commun 5, 3182 (2014). [DOI] [PubMed] [Google Scholar]
- [29].Zidovska A, Weitz DA, and Mitchison TJ, Proc. Natl. Acad. Sci. U.S.A 110, 15555 (2013). [DOI] [PMC free article] [PubMed] [Google Scholar]
- [30].Milo R and Phillips R, Cell biology by the numbers (Garland Science, 2015). [Google Scholar]
- [31].Grob A, Colleran C, and McStay B, Genes Dev. 28, 220 (2014). [DOI] [PMC free article] [PubMed] [Google Scholar]
- [32].Wang W, Budhu A, Forgues M, and Wang XW, Nat. Cell Biol 7, 823 (2005). [DOI] [PubMed] [Google Scholar]
- [33].Kremers G-J, Hazelwood KL, Murphy CS, Davidson MW, and Piston DW, Nat. Methods 6, 355 (2009). [DOI] [PMC free article] [PubMed] [Google Scholar]
Associated Data
This section collects any data citations, data availability statements, or supplementary materials included in this article.


