Abstract
Introduction
Step counting can be used to estimate the activity level of people in daily life; however, commercially available accelerometer-based step counters have shown inaccuracies in detection of low-speed walking steps (<2.2 km/h), and thus are not suitable for older adults who usually walk at low speeds. This proof-of-concept study explores the feasibility of using force myography recorded at the ankle to detect low-speed steps.
Methods
Eight young healthy participants walked on a treadmill at three speeds (1, 1.5, and 2.0 km/h) while their force myography signals were recorded at the ankle using a customized strap embedded with an array of eight force-sensing resistors. A K-nearest neighbour model was trained and tested with the recorded data. Additional three mainstream machine learning algorithms were also employed to evaluate the performance of force myography band as a pedometer.
Results
Results showed a low error rate of the step detection (<1.5%) at all three walking speeds.
Conclusions
This study demonstrates not only the feasibility of the proposed approach but also the potential of the investigated technology to reliably monitor low-speed step counting.
Keywords: Force myography, force-sensing resistor band, pedometer, older adults, gait analysis
Introduction
Regularly performing physical activities is important for people to keep a healthy condition, especially for older adults with mobility limitations.1,2 The beneficial effects include reducing health risks associated, for instance, with diabetes, cardiovascular diseases, depression and anxiety.1,2 Walking is one of the most common lower extremity physical activities that is conducted by the majority of the population including seniors. Step detection and counting provide a basic but robust measurement of individual’s physical activity level.3 Objective and accurate monitoring and feedback of step counts would provide an assessment of physical activity level that might further motivate people to exercise more.
A number of wearable step-count devices, such as pedometers based on accelerometers, have been developed to monitor walking and other activities, and many are currently commercially available.4,5 Most of these devices are based on accelerometers and inertial measurement units, which separate the gait cycles according to the changes of acceleration signals to count steps.6 These inertial-based step-count devices are accurate for detecting moderate and fast walking steps.4–6 However, when the walking speed is low, as in the case of the older adults, their accuracy can be unsatisfactory.7–9 Specifically, the step-count accuracy drops significantly from >97% at speeds between 2.9 and 3.2 km/h to about 56% at a speed of 1.4 km/h using a pedometer attached to healthy volunteers’ hips.5 Melanson et al. also found that the pedometer accuracy decreased with increasing age, which is possibly due to decreased walking speed. Foster et al.4 examined the accuracy of the commercially available pedometers Omron (Kyoto, Japan) and Accusplit (Pleasanton, USA) worn on the ankle and found a similar result, that is pedometers are accurate at high walking speed (>98% at 4.7 km/h) but inaccurate at low speed (<65% at 1.4 km/h). Lisa et al.8 investigated the effect on the accuracy of wearing a commercially available step-count device (Fitbit, San Francisco, California, United States) in two different body positions in older adults. Forty-two senior participants (average of 73 years) walked at seven different speeds (1.0–3.0 km/h) following a pacesetter, wearing the device on their ankle and waist. The authors found that accuracies of the step counter on both ankle and waist positions decreased from high speed to slow speed. Interestingly, the step counter on the ankle achieved significantly higher accuracy than that on the waist.
In this exploratory work, the use of force myography (FMG) is investigated as an alternative solution to accelerometry for step counting. FMG is a muscle activity-sensing technology that has recently been investigated primarily for upper extremity gesture recognition and prosthesis control.10–14 FMG is often recorded by using force-sensing resistors (FSRs) surrounding a limb to register the volumetric changes of the underlying musculotendinous complex during muscle activities. FSRs are thin and inexpensive polymer film devices which exhibit a decrease in resistance when an increase in force is applied to its sensing region.15 FSRs have been used in shoes and insoles to monitor gait activities through the estimation of foot pressure distribution on the ground.16,17 Steps can be robustly derived from gait gestures recorded by shoes and insoles, with each step starting from heel-stride and ending by toe-off. Although these step counters are accurate, their use is often impractical for seniors to use at home as insoles must be adjusted to each different pair of shoes (e.g. not suitable for most slippers) and shoes must be instrumented. Additionally, this approach cannot be used for counting steps when individuals walk with bare feet, which is often the case of seniors walking at home (e.g. in North America).
Inspired by the successes of detecting upper extremity activities using FSR bands on the forearm or the wrist,10,11,14,18 we intend to examine whether the FMG worn on the ankle is able to detect steps accurately, especially for low-speed walking. During a stance, such as a foot-flat stance, the extensors of the lower extremity muscle group contract to maintain the stance to counter the weight of the body exerted on the foot; whereas during a swing phase, flexors of the lower extremity are mostly involved.19,20 The contraction and relaxation of the extensors during the flat-foot stance and flexors during swing phases would exert different force distributions on the FSR band resulting in distinctive FMG patterns. We hypothesize that the FSR band on the ankle will be able to detect slow steps accurately.
This research explores the feasibility of using an FSR band, worn on the distal end of the leg, to detect steps. Eight participants walked on a treadmill at three different speeds (1.0, 1.5, and 2.0 km/h) with the FMG signals recorded using a custom-made wireless band containing eight FSRs. Two external FSRs were attached to the heel and toe to record the movements of heel-stride and toe-off for true step data. The signals were then used to train and test K-nearest neighbour (KNN), support vector machine (SVM), neural network (NN), and linear discriminant analysis (LDA) classifiers.21–23 The results demonstrate a feasibility of using FMG on the ankle for low-speed step counting.
Experiment set-up
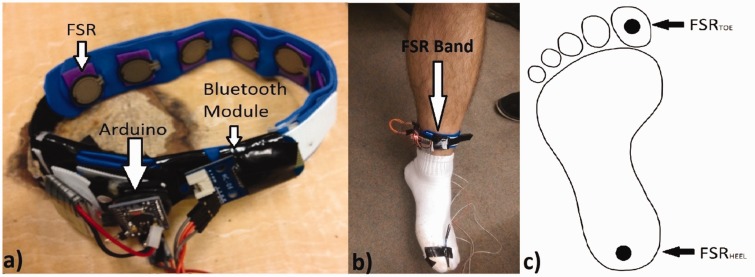
The FSR band, shown in Figure 1(a), is the main device in the experiment, which contains an array of eight FSRs. A FSR is composed of a conductive polymer that undergoes a change in resistance when a force is applied to it. When applying no pressure on the sensor, the voltage reading will be zero because of high resistance; if a force is applied, then the sensor’s resistance decreases, causing an increased voltage reading. The InterLink 402 FSRs (InterLink Electronics Inc., Camarillo, California, United States), with a diameter of 18.3 mm and force sensitivity range from 0.1 to 10 N,15 was chosen for the study. As shown in Figure 1(b), the FSRs were placed approximately 3.2 cm apart on a thin layer of plastic sheet, with a total length of 32 cm, to provide a firm back support. A Velcro tape was attached to the end of the band allowing it to be easily and firmly tied around the subject’s lower limb. The FSR band used a microcontroller, Arduino pro mini (Arduino, Somerville, MA, United States), to measure the pressure and send the raw data back to the host computer using a Bluetooth module. The system was powered by a 3.2 V battery. As shown in Figure 1(c), a labelling system, which consists of two FSRs, was built for sensing foot pressures against the ground to determine the stance and swing periods as true class labels. A LabVIEW (National Instruments Inc., Austin, Texas, United States) interface was programmed to record the raw data from both the band and the two labelling FSRs.
Figure 1.
Experiment set-up. (a) The FSR band composed of a Bluetooth module, Arduino pro mini, 3.5 V battery and eight FSRs, (b) the FSR band mounted firmly at the ankle position, and (c) two FSRs attached on the bottom of heel and toe for labelling when the foot is in the air or the ground. FSR: force-sensing resistor.
Participants
Eight healthy adult participants (seven males and one female, age 23–45) were recruited for the data collection. All the participants were able-bodied and self-reported to be 100% functional with their feet. All the participants read and signed the consent form before entering the study. The ethics form for the study had been previously approved by the Office of Research Ethics of Simon Fraser University (Study Number 2014s0590).
Protocol and procedure
The participants walked in their usual gait style on the treadmill while wearing the FSR band on their left leg, 2 in. above the ankle. Two labelling FSRs (FSRheel and FSRtoe) were attached on the heel and toe of the same foot, respectively, using an electrical tap. The strap was tightened comfortably around the ankle position ensuring that the pressure of the strap would not restrict the subject’s movement during the experiment; but at the same time, all sensors on the band were able to cover as much the skin of the ankle as possible. For consistency across subjects, the band was kept in a constant position (∼2 in. above the ankle) by keeping the circuit board at the inner side of the leg. Subjects were asked to walk for five trials; in each trial, participants walked at three different speeds, which were 1.0 km/h (speed 1), 1.5 km/h (speed 2), and 2.0 km/h (speed 3), respectively, for 42 s each. The three speeds were selected from the interface of the treadmill because the literature indicated that the extremely slow human walking speed is about 1 km/h24 and the preferred human walking speed at treadmill is about 4 km/h.25 The 42 s data collection was selected as it was noticed that this would allow collecting about 20–30 steps at all three speeds. The sampling frequency of the FSR band was 10 Hz. The FSR band was not removed throughout the experiment. The execution order of the speed of each trial was arranged in a counterbalance measure design between subjects.
The detailed data collection procedure is described as follows. The subjects took their shoes off, and the FSR band was donned on the left leg. The other two sensors were positioned and taped on the down side of subject’s heel and toe, respectively, for labelling purpose. Before data collection, the participant was asked to walk on the treadmill for about 1 min to familiarize with the treadmill; none of them reported that the wearing of the band affected their walking on the treadmill. Before each trial’s data collection, the treadmill was turned on and set to one of the three target speeds and the participant started walking on the treadmill for a few seconds to ensure the data were not affected by the acceleration of the treadmill. Then the experimenter hit the ‘Record’ button on the LabVIEW interface to initialize the data recording. Each trial with one speed lasted for 42 s and the experimenter terminated the speed trial’s recording and saved the data (420 samples) into a speed-trial file for offline analysis. A total of 15 speed-trial files (three speeds each for five trials) data for each subject were collected. Between each trial, the subject could choose to rest if they needed, and the experimenter checked the band to make sure it was not loose nor significantly slipped out of position.
Data analysis
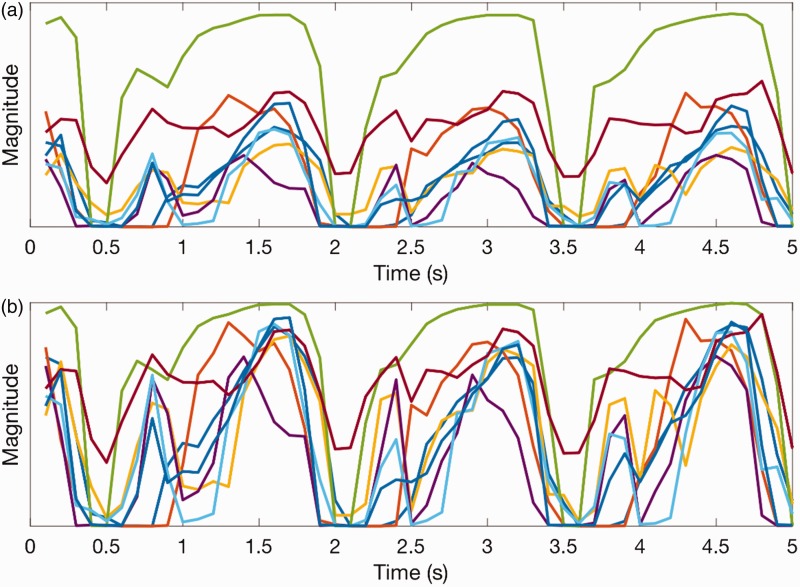
The collected data were stored and analysed offline using MATLAB. Figure 2(a) shows the raw data obtained from the FSR band for one subject during one trial at one speed.
Figure 2.
Examples of raw and normalized FSR signals. (a) A segment of four-step raw FSR signal from subject 1, trial 4, speed 2 and (b) the normalized FSR signal from the same segment signal of panel A, where each trial was normalized using the maximum and minimum values of signals of the trial. FSR: force-sensing resistor.
KNN algorithm was used to determine the performance of the system with the collected data. This simple yet very effective machine learning technique has been used in different gait analysis research, such as classifying patients with respect to balance disorders,26 predicting falls,27 and recognizing human gait events.21 In addition, when compared to more complex machine learning algorithms, such as SVM and NN, KNN is able to be trained faster and achieve high accuracies.22
KNN is a non-parametric method in which the predicted label is determined by the majority votes of the class of its neighbours within a determined distance,28 which is computed by Euclidean distance. It is defined as29
| (1) |
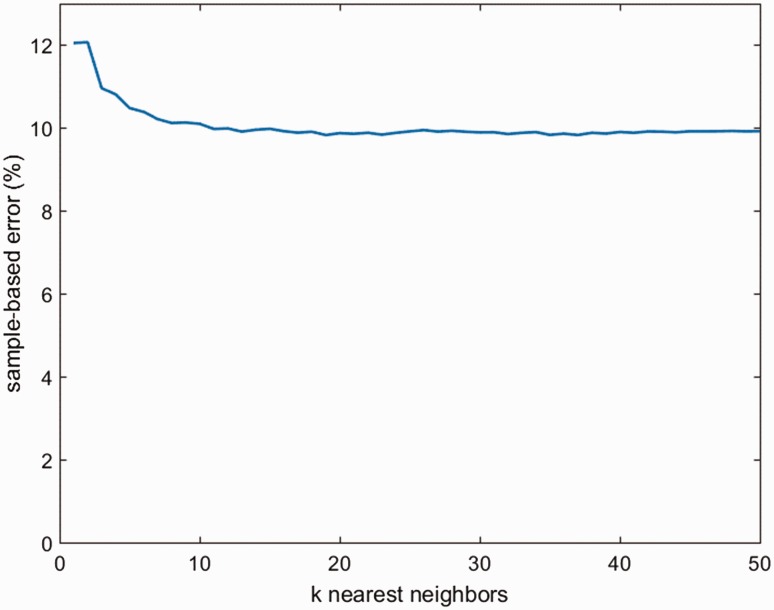
where x and y are two points. Inside the boundary of the distance, k closest neighbours from the target data point are chosen to predict the output label. To investigate the best performance of the KNN classifier, the optimal value of k was investigated by assessing the effect of the number of nearest neighbours that varied from 1 to 50 on the performance of step counting. The KNN classifier used for the study was from MATLAB Statistic and Machine Learning Toolbox.
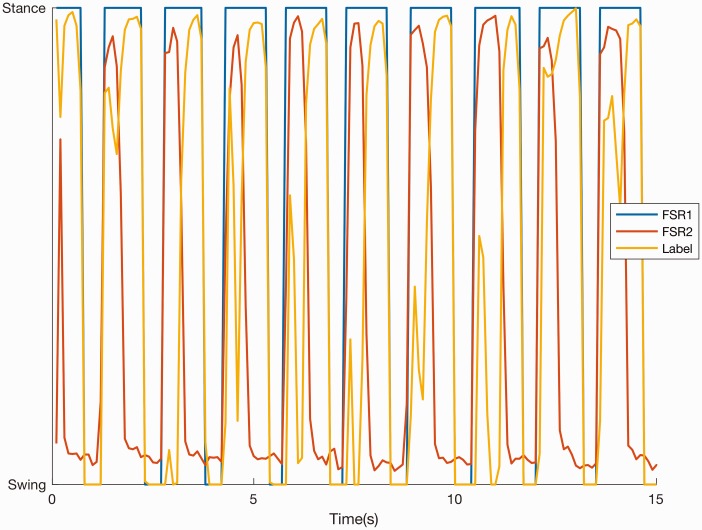
Before applying KNN, the raw data were labelled into stance or swing phases according to the signals recorded from the underfoot labelling FSRs. The start of a stance phase was defined when the heel strode the ground, and the end of a stance phase (the start of swing phase) was when the toe left the ground. The start of a stance phase was determined when the value of the FSR on the heel increased to a threshold, and the end of the stance phase was identified when the value of the toe FSR increased to its maximum and the value of the FSR on the heel decreased to under a threshold. The threshold in this study was empirically set to 30% of the maximum label FSR signal amplitude. Figure 3 shows the raw data from the two labelling FSRs and the labels after applying the threshold. The labelled FSR data were then used for training and testing the machine learning model.
Figure 3.
The FSR signal from the two labelling FSRs (FSRheel and FSRtoe) and the labels (orange) (subject 1, trial 4, speed 2) after applying threshold. FSR: force-sensing resistor.
To evaluate the performance of the proposed FSR band, a five-fold cross-trial validation method was implemented. Data were divided into testing data and training data. The testing data used one trial out of the five trials and the rest of the four trials were used as training data. This process was repeated until all five trials were used as testing data. The data, both training data set and testing data set, were normalized using maximum and minimum values from the training data set.
All data points from FSR signals were normalized using the maximum and minimum values of the signals according to the following equation
| (2) |
where is the original signal, is the normalized signal, and are the minimum and maximum values in the training signal, respectively. The normalized data from FSR band is shown in Figure 2(b).
The KNN model was trained using the normalized training data and testing data. To evaluate the device’s performance, we compared each of the predicted sample labels (stance and swing) to the true sample labels derived from the underfoot FSR signal. The sample-based error for each speed trial was determined by the percentage of the incorrectly predicted labels compared to true labels. The sample-based accuracy of each speed for a subject was the average of the sample accuracies of the five trials.
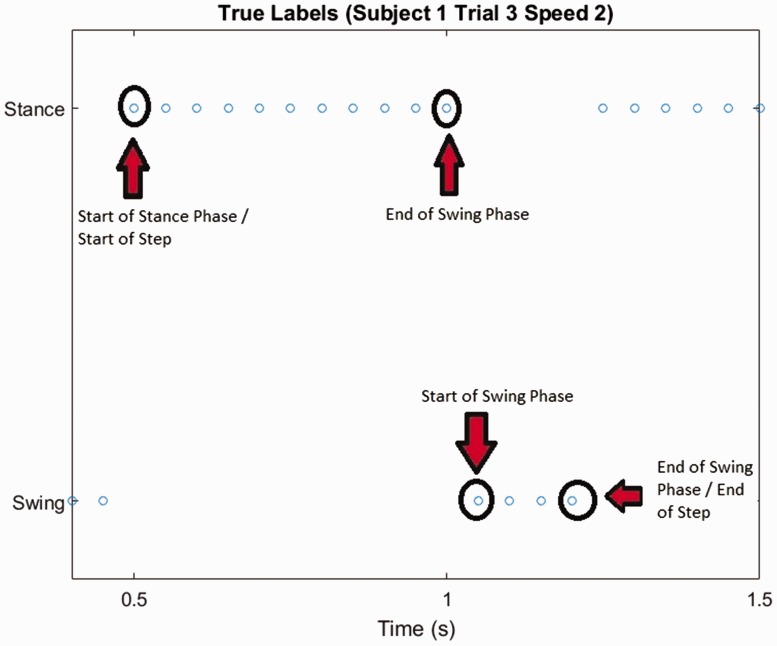
As the performance of FSR band as a pedometer is the main interest of this paper, we further evaluated the step-count error based on the sample-based classification. The step-count error is calculated by comparing the number of steps counted from the true sample labels of the testing data set with the number of steps counted from the sample labels predicted by the classifier. A step includes a stance phase and a swing phase in a continuous sequence, which are defined in the ‘Data analysis’ section, and are measured from the signals from the underfoot labelling FSRs, as shown in Figure 4.
Figure 4.
Definition of the start and end of swing/stance phase (step). A step includes a stance phase and a swing phase. The light-blue circles are the threshold labels indicating the data in swing or stance phases, which are measured from the signals from the underfoot labelling FSRs.
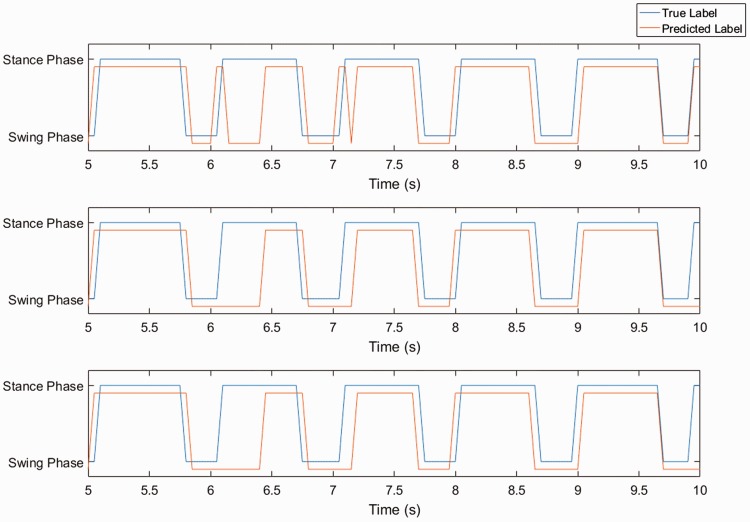
Before calculating step-count error rate, filtering was applied to the predicted steps to remove small steps that were generated by the incorrectly predicted samples. As shown in Figure 5(a) there are seven small ‘Swing’ spikes and 1 small ‘Stance’ spike, which should not be considered as steps. The method used applied a simple threshold filtering on the stance phase and swing phase. If the width of the current phase had a smaller value than the threshold, then it would become the opposite phase. The threshold value for the stance phase was four samples, and the value for swing phase was two samples. The stance phase used a higher threshold value because, in a step, the duration of stance phase took longer than the swing phase. Swing phase was filtered after the filtering of the stance phase. As shown in Figure 5(c), the small steps were smoothed after applying the filtering. The first and last steps were also removed because the first and last step potentially could be counted as uncompleted steps.
Figure 5.
Step filtering process to remove noisy steps. (a) Predicted label – without filtering (subject 8, trial 1, speed 2) shows the unfiltered steps, (b) Predicted label – with stance filtering shows the result using a four-sample threshold, and (c) Predicted label – with swing filtering shows the result using a two-sample threshold.
The following equation was used to calculate the step-count error by calculating the percentage difference of the true step number and the predicted step number
| (3) |
where StepNTrue is the number of true steps calculated from the labelling system and StepNpredicted is the number of predicted steps calculated from the KNN classifier.
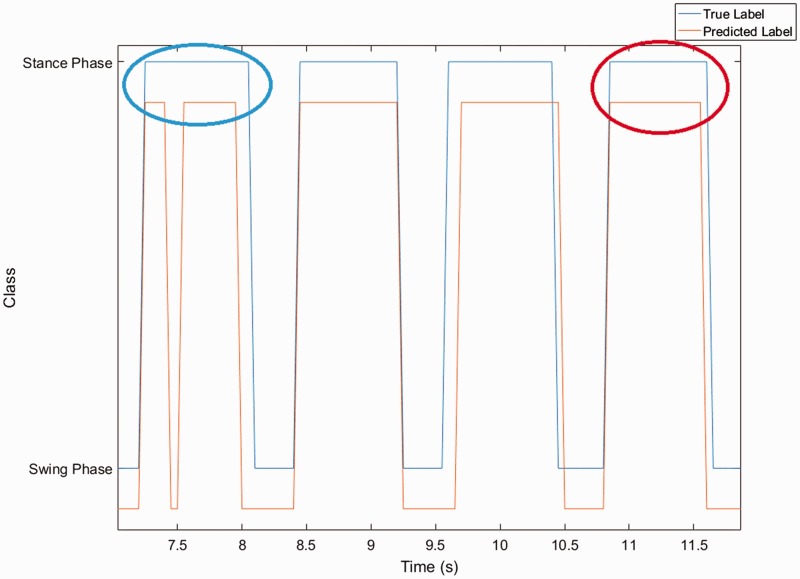
The step-count error rate calculated by equation (3) might not reflect the real accuracy of the step counter since it is possible for a step counter to predict both false positive and false negative steps in a trial resulting in a higher accuracy compared to the actual accuracy. Thus, the true positive rate of the step count was further verified by only using the calculated percentage of true positive steps over all true steps (equation (4)). In Figure 6, the blue circle shows the predicted steps are false positive, while the red one shows the predicted step is correctly predicted. To determine the correct predicted steps (true positives), the start and end of each predicted step were used for assigning the predicted step to the closest labelled true step. For analysis, the number of each true step, which was assigned by the predicted step, was counted. The predicted step was truly positive only if one predicted step was assigned to one true step. If there were two predicted steps assigned to a true step, then it would not be counted as true positive. After finding all the correctly predicted step counts, the following equation was used to compute the corrected step-count accuracy
| (4) |
Figure 6.
Example of true and predicted step labels (subject 7, trial 3, speed 2). The blue circle shows one true step is predicted as two steps (false positive) and the red circle shows a true positive step.
To further explore whether the FMG band was valid using general machine learning algorithms, three additional mainstream supervised learning algorithms including SVM, NN, and LDA were employed to evaluate the performance of the step counting in a way similar as KNN. A performance comparison of KNN, SVM, NN, and LDA is summarized in Table 1, according to MathWorks.30 For the detailed description for these learning algorithms, see Chen and Wang.23 The SVM, NN, and LDA were implemented using the corresponding functions from MATLAB Statistics and Machine Learning Toolbox. The parameters (gamma and alpha) for SVM were optimized based on the training data,12 and the number of layers of NN and the number of neurons in each hidden layer were set to default of 1 and 10, respectively. The discriminant type of LDA was pseudolinear and the linear coefficient threshold was set to a default of 0.
Table 1.
Performance comparison of KNN, SVM, NN, and LDA.
| Learning method | Prediction speed | Memory usage | Interpretability |
|---|---|---|---|
| KNN | Medium | Medium | Hard |
| SVM | Slow | Large | Hard |
| NN | Slow | Medium | Hard |
| LDA | Fast | Small | Easy |
KNN: K-nearest neighbour; LDA: linear discriminant analysis; NN: neural network; SVM: support vector machine.
A two-way analysis of variance (ANOVA) was employed to examine whether there were significant differences of step-counting accuracies between different algorithms and the walking speeds, in terms of sample-based and step-based error rates, respectively. Post Hoc pair comparison (Tukey HSD) was further conducted if there was any significant effect of the variables on the accuracy. The significance level was set to p-value = .05.
Results
A total of 40 trials from eight subjects (each subject performed five trials at three different speeds) were collected. Three trials have been removed (two trials had unsynchronized data and one uncompleted trial), leaving only 37 trials used for analysis.
Classification errors using KNN
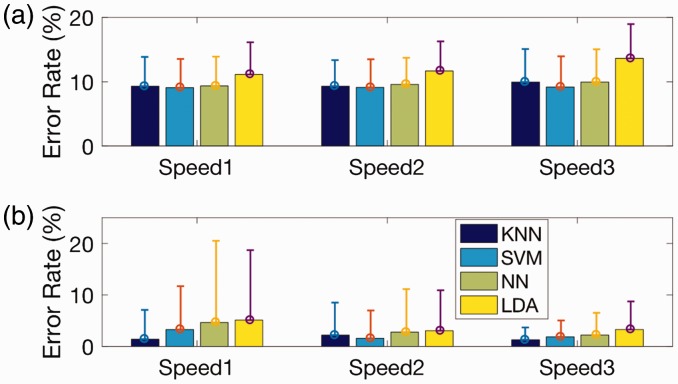
The sample-based accuracy was calculated from the correctly predicted number of samples in stances and swing states over the number of total samples in each speed trial for each subject, by comparing to the ground truth samples labelled by the two FSRs on the heel and toe. The mean sample-based error over three speeds for all eight subjects was 9.9 ± 0.1%a using KNN, with very similar error rates among the three speeds of 9.8 ± 1.1, 10.0 ± 1.7, and 9.8 ± 0.5%, as shown in Figure 7(a), respectively.
Figure 7.
(a) Sample-based error and (b) step-count error rates for all three speeds across eight subjects. The error bars are 1 standard deviation. KNN: K-nearest neighbour; LDA: linear discriminant analysis; NN: neural network; SVM: support vector machine.
The system achieved a very low mean step-count error of 1.4 ± 2.6, 1.4 ± 3.5, and 1.2 ± 0.4% at the walking speeds 1.0, 1.5, and 2.0 km/h, respectively, as shown in Figure 7(b). The mean step-count error rates were calculated according to equation (3). By further looking into the error rate of individual subjects, the device captured less steps than the actual step number at all three speeds for most of the subjects, except subject 1 captured 3% more steps at speed 1 and subject 7 captured 4% more steps at speed 2.
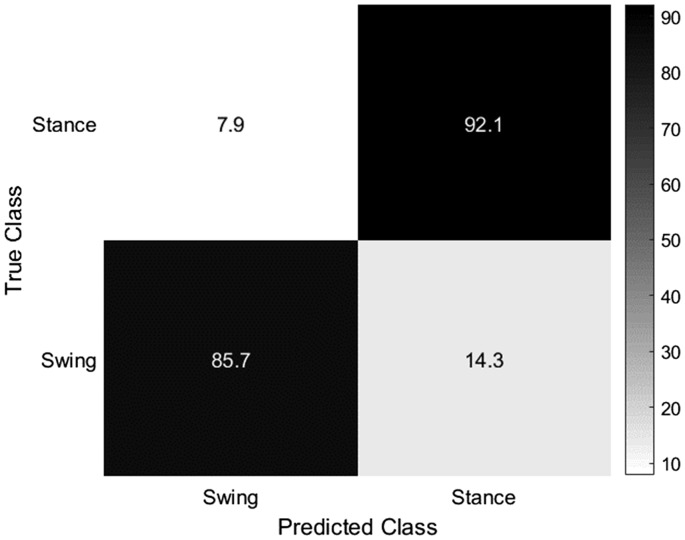
Figure 8 shows the confusion matrix of the sample-based accuracy for all three speeds across the eight participants using KNN. The figure shows that the stance phase samples are better classified than swing samples (accuracy of 92% versus 86%).
Verification of the step-count error
Figure 8.
The confusion matrix of all 15 trials showing the sample-based error using the KNN classifier. The darkness of each cell in the matrix is the percentage of true samples (in y-axis) that had been predicted as the class in x-axis.
As mentioned in the ‘Data analysis’ section, the step-count rates calculated by equation (3) do not necessarily show the step counts were correct; therefore, we verified the step-count error by calculating the true positive rate. The mean true positive step-count accuracies across the eight subjects are of 98.5 ± 2.6, 98.6 ± 3.5, and 98.8 ± 0.4% at the three walking speeds 1.0, 1.5, and 2.0 km/h, respectively, using KNN. The very high true positive rates validate the step-count rates calculated by equation (3) were correct.
Optimal value for KNNs
Figure 9 shows that the averaged sample-based error corresponds to the number of nearest neighbours across all eight subjects when the number of nearest neighbours (k) changed from 1 to 50. From the plot, the sample-based error decreased and a stable situation was achieved when the value of k reached near 20.
Classification errors using SVM, NN, and LDA
Figure 9.
The averaged sample-based error corresponds to the number of nearest neighbours across all eight subjects. KNN: K-nearest neighbour.
SVM and NN achieved similar sample-based errors as those of KNN for three speeds but lower than that of LDA (Figure 7(a)). For the step-based error rates (Figure 7(b)), KNN achieved the lowest error rates among the four algorithms in speed 1 and 3, but SVM performed the best at speed 2. The main classification results of the machine learning algorithms are summarized in Table 2.
Table 2.
Classification error of KNN, SVM, NN, and LDA.
| Learning method | Speed 1 |
Speed 2 |
Speed 3 |
|||
|---|---|---|---|---|---|---|
| Sample based (%) | Step based (%) | Sample based (%) | Step based (%) | Sample based (%) | Step based (%) | |
| KNN | 9.4 ± 2.8 | −0.3 ± 2.7 | 9.5 ± 3.8 | 2.4 ± 4.5 | 10.3 ± 4.7 | 1.3 ± 1.5 |
| SVM | 9.2 ± 3.0 | 2.8 ± 3.5 | 9.3 ± 3.9 | 1.7 ± 3.2 | 9.5 ± 4.2 | 1.9 ± 1.7 |
| NN | 9.5 ± 2.9 | 4.7 ± 7.3 | 9.8 ± 3.5 | 3.0 ± 4.8 | 10.3 ± 4.0 | 2.3 ± 2.0 |
| LDA | 11.4 ± 3.6 | 3.7 ± 8.8 | 11.8 ± 4.1 | 0.7 ± 3.3 | 13.9 ± 4.2 | 3.0 ± 3.1 |
KNN: K-nearest neighbour; LDA: linear discriminant analysis; NN: neural network; SVM: support vector machine.
The results of two-way ANOVA showed that there was a significant effect of classification algorithm to the sample-based error rates (F3,84 = 3.23, p < .05), but there was no significant effect of speed. There was no significant interaction effect between the classification algorithm and speed to the sample-based error rates. The Post Hoc test (Tukey HSD) showed that the error rate of LDA was significantly higher (p < .05) than that of SVM, but there was no significant difference between any other pairs of algorithms. There was neither significant effect of speed nor algorithm to the step-based error rates.
Discussion
Two groups of muscles, namely flexor and extensor muscles, are involved in the gait movements at the ankle position: the extensors of the lower extremity muscle group (tibialis anterior and extensor digitorum longus) contract to maintain the stance gestures to counter the weight of the body exerted on the foot, and the flexors of the lower extremity (gastrocnemius and soleus) act to maintain a swing.19,20 The contraction and relaxation of the extensors and flexors during gait phases alters the pressure distribution resulting in distinctive FMG patterns sensed by the FSR strap. In this study, four machine learning algorithms were employed to evaluate the performance of FMG band as a pedometer. The results prove our hypothesis that a low error rate of the predicted steps compared to the true step numbers derived from the underfoot FSR sensors, with less than 1.5% error across three speeds could be achieved by using the FSR band. The high true positive rates validate the step-count error rates.
Accelerometer-based step counters are severely affected by low walking speed, showing step-count accuracy <65%4,5,8 at lower speeds. This is because they rely on the thresholds of acceleration changes between swings and stances for the steps detection; whereas, the acceleration is usually not sufficient for distinguishing a step when the walking speed is very low. In contrast, the present FSR-based step detection system is not affected by the low walking speed, instead achieving a low error rate of 1.4% at 1.0 km/h. This exceptional high performance of step detection at low walking speed is the result of the distinctive FMG patterns sensed by the FSR strap. In other words, during a stance of slow walking including freezing steps, the sustained contraction of the flexor muscles results in a very distinguishable FMG pattern to that of swing step.
Limitation and future work
This preliminary study explores the feasibility of employing the FSR strap on the ankle to specifically determine the accuracy for low-speed step detection at the speed range of 1.0 to 2.0 km/h on a treadmill. In the future, it is planned to test the device at a wider ranges of walking speeds and walking styles including walking in free daily activities. In the present study, a small sample of healthy volunteers participated. In the future, it would be recommended to increase the sample size for computing the mean and standard deviation of errors, which may be more revealing with regards to the overall performance of the FSR strap; this to be improved sample set should be with balanced age and gender and also include older adults and individuals with mobility deficit. Future research should also improve the usability of the FSR band, including improving the machine learning model to tolerate band displacement, inter-wearing (taking off and reattaching), and intersubject variations without retraining the band.
Conclusion
This paper presents a new wearable step detection system using FMG. An array of eight FSRs was embedded into a strap, which was designed to be worn on the ankle position. Eight participants walked on a treadmill at three different walking speeds of 1.0, 1.5, and 2.0 km/h, respectively. At the same time, two extra FSRs were attached to the heel and toe to record true step labels. A supervised learning technique (KNN) as well as SVM and NN and LDA were employed to test the performance of the strap. The system achieved a low error rate of <1.5% at all three speeds using KNN. The results suggest that it is feasible to use the FSR strap on the ankle to detect steps taken at low speeds.
Note
Mean ± standard deviation.
Declaration of conflicting interests
The author(s) declared no potential conflicts of interest with respect to the research, authorship, and/or publication of this article.
Funding
The author(s) disclosed receipt of the following financial support for the research, authorship, and/or publication of this article: This research was supported by the Natural Sciences and Engineering Research Council of Canada (NSERC), the Canadian Institutes of Health Research (CIHR), and the Michael Smith Foundation for Health Research (MSFHR).
Guarantor
CM
Contributorship
KC, XJ and CM designed the experiment. KC and XJ conducted the experiment, collected and analyzed the data. KC and XJ drafted and wrote the manuscript. XJ and CM substantially revised the manuscript. CM was responsible for funding. All authors have read and approved the final manuscript.
References
- 1.CDC. Physical activity and health: a report of the surgeon general. Centers for Disease Control and Prevention, Atlanta, GA, USA.
- 2.Warburton DER, Nicol CW, Bredin SSD. Health benefits of physical activity: the evidence. Can Med Assoc J 2006; 174: 801–809. [DOI] [PMC free article] [PubMed] [Google Scholar]
- 3.Pillay JD, Kolbe-Alexander TL, Proper KI, et al. Steps that count!: the development of a pedometer-based health promotion intervention in an employed, health insured South African population. BMC Public Health 2012; 12: 1–8. [DOI] [PMC free article] [PubMed] [Google Scholar]
- 4.Foster RC, Lanningham-Foster LM, Manohar C, et al. Precision and accuracy of an ankle-worn accelerometer-based pedometer in step counting and energy expenditure. Prev Med 2005; 41: 778–783. [DOI] [PubMed] [Google Scholar]
- 5.Melanson EL, Knoll JR, Bell ML, et al. Commercially available pedometers: considerations for accurate step counting. Prev Med 2004; 39: 361–368. [DOI] [PubMed] [Google Scholar]
- 6.Yang C-C, Hsu Y-L. A review of accelerometry-based wearable motion detectors for physical activity monitoring. Sensors 2010; 10: 7772–7788. [DOI] [PMC free article] [PubMed] [Google Scholar]
- 7.Cyarto EV, Myers AM and Tudor-Locke C. Pedometer accuracy in nursing home and community-dwelling older adults. Med Sci Sports Exerc 2004; 36: 205–209. [DOI] [PubMed]
- 8.Lisa A, Simpson JJE, Tara DK, et al. Capturing step counts at slow walking speeds in older adults: comparison of ankle and waist placement of measuring device. J Rehabil Med 2015; 47: 830–835. [DOI] [PubMed] [Google Scholar]
- 9.Martin JB, Krč KM, Mitchell E, et al. Pedometer accuracy in slow walking older adults. Int J Ther Rehabil 2012; 19: 387–393. [DOI] [PMC free article] [PubMed] [Google Scholar]
- 10.Cho E, Chen R, Merhi L-K, et al. Force myography to control robotic upper extremity prostheses: a feasibility study. Front Bioeng Biotechnol 2016; 4: 1–12. [DOI] [PMC free article] [PubMed] [Google Scholar]
- 11.Dementyev A and Paradiso JA. WristFlex: low-power gesture input with wrist-worn pressure sensors. In: Proceedings of the 27th annual ACM symposium on user interface software and technology – UIST ’14, 5–8 October 2014, pp.161–166. New York: ACM Press.
- 12.Kadkhodayan A, Jiang X and Menon C. Continuous prediction ofng finger movements using force myography. J Med Biol Eng 2016; 36: 594–604.
- 13.Li N, Yang D, Jiang L, et al. Combined use of FSR sensor array and SVM classifier for finger motion recognition based on pressure distribution map. J Bionic Eng 2012; 9: 39–47. [Google Scholar]
- 14.Xiao ZG, Menon C. Towards the development of a wearable feedback system for monitoring the activities of the upper-extremities. J Neuroeng Rehabil 2014; 11: 13. [DOI] [PMC free article] [PubMed] [Google Scholar]
- 15.InterlinkElectronics. FSR® integration guide & evaluation parts catalog with suggested electrical interfaces, Los Angeles, CA, USA, 2010.
- 16.González I, Fontecha J, Hervás R, et al. An ambulatory system for gait monitoring based on wireless sensorized insoles. Sensors 2015; 15: 16589–16613. [DOI] [PMC free article] [PubMed] [Google Scholar]
- 17.Smith BT, Coiro DJ, Finson R, et al. Evaluation of force-sensing resistors for gait event detection to trigger electrical stimulation to improve walking in the child with cerebral palsy. IEEE Trans Neural Syst Rehabil Eng 2002; 10: 22–29. [DOI] [PubMed] [Google Scholar]
- 18.Jiang X, Merhi L-K, Xiao ZG, et al. Exploration of force myography and surface electromyography in hand gesture classification. Med Eng Phys 2017; 41: 63–73. [DOI] [PubMed]
- 19.Endo K and Herr H. A model of muscle-tendon function in human walking. In: IEEE international conference on robotics and automation, 2009 (ICRA ’09), 12–17 May 2009, pp.1909–1915. Kobc, Japan: IEEE.
- 20.Umberger BR. Stance and swing phase costs in human walking. J R Soc Interface 2010; 7: 1329–1340. [DOI] [PMC free article] [PubMed] [Google Scholar]
- 21.Derlatka M and Bogdan M. Ensemble kNN classifiers for human gait recognition based on ground reaction forces. In: Proceedings of 8th International Conference on Human System Interactions (HSI), 25–27 June 2015, pp.88–99. Warsaw, Poland, USA: IEEE.
- 22.Özdemir AT, Barshan B. Detecting falls with wearable sensors using machine learning techniques. Sensors 2014; 14: 10691–10708. [DOI] [PMC free article] [PubMed] [Google Scholar]
- 23.Chen X, Wang ZJ. Pattern recognition of number gestures based on a wireless surface EMG system. Biomed Signal Process Control 2013; 8: 184–192. [Google Scholar]
- 24.Den Otter AR, Geurts ACH, Mulder T, et al. Speed related changes in muscle activity from normal to very slow walking speeds. Gait Posture 2004; 19: 270–278. [DOI] [PubMed] [Google Scholar]
- 25.Dal U, Erdogan T, Resitoglu B, et al. Determination of preferred walking speed on treadmill may lead to high oxygen cost on treadmill walking. Gait Posture 2010; 31: 366–369. [DOI] [PubMed] [Google Scholar]
- 26.Nukala BT, Nakano T, Rodriguez A, et al. Real-time classification of patients with balance disorders vs. normal subjects using a low-cost small wireless wearable gait sensor. Biosensors 2016; 6: 58–79. [DOI] [PMC free article] [PubMed]
- 27.Liang S, Ning Y, Li H, et al. Feature selection and predictors of falls with foot force sensors using KNN-based algorithms. Sensors 2015; 15: 29393–29407. [DOI] [PMC free article] [PubMed] [Google Scholar]
- 28.Cover T, Hart P. Nearest neighbor pattern classification. IEEE Trans Inf Theory 1967; 13: 21–27. [Google Scholar]
- 29.Faloutsos C, Ranganathan M and Manolopoulos Y. Fast subsequence matching in time-series databases. In: Proceedings of the 1994 ACM SIGMOD International Conference on Management of Data, 24-27 May 1994, pp. 419-429. Minneapolis, Minnesota, USA: ACM.
- 30.MathWorks. Choose classifier options, https://www.mathworks.com/help/stats/choose-a-classifier.html (accessed 4 September 2017).


