Abstract
We present a novel automated approach for detection of standardized abdominal circumference (AC) planes in fetal ultrasound built in a convolutional neural network (CNN) framework, called SonoEyeNet, that utilizes eye movement data of a sonographer in automatic interpretation. Eye movement data was collected from experienced sonographers as they identified an AC plane in fetal ultrasound video clips. A visual heatmap was generated from the eye movements for each video frame. A CNN model was built using ultrasound frames and their corresponding visual heatmaps. Different methods of processing visual heatmaps and their fusion with image feature maps were investigated. We show that with the assistance of human visual fixation information, the precision, recall and F1-score of AC plane detection was increased to 96.5%, 99.0% and 97.8% respectively, compared to 73.6%, 74.1% and 73.8% without using eye fixation information.
Index Terms: standardized plane detection, eye tracking, fetal ultrasound, transfer learning, information fusion
1. Introduction
Ultrasound-based biometric measurements such as the estimation of the abdominal circumference (AC), the head circumference (HC), the bi-parietal diameter (BPD), and the femur length (FL) are essential to the monitoring of fetal growth and detection of Intra-Uterine Growth Restriction (IUGR) [1]. Such measurements are only comparable if they are taken from standardized 2D ultrasound (US) planes. Performance of sonographers in plane finding suffers from inter-observer variability. This has motivated interest in automating standardized plane detection using for instance Random Forests [2] and most recently Convolutional Neural Networks (CNNs) [3].
However, training classic CNN models requires a large amount of data (possibly millions of images), which is typically not available in medical imaging applications. In this paper we investigate the question, “Is it possible to complement image data with top-down information, such as eye movement [4], to increase learning performance when a moderate amount of image data is available?” The idea is to utilize not only the image annotations generated by the sonographers, but also their visual perception as measured by tracking eye movements to infer where did the sonographer fixate, and where did they ignore information in an US video frame.
Ahmed et al. made the first attempt to use visual heatmaps as interest operators for standardized AC plane detection [5]. This paper is inspired by that work but, to our knowledge, considers for the first time how eye tracking data can inform plane detection within a CNN framework. Specifically, this paper considers nine different models, which combine visual heatmaps and corresponding US video frames in different ways for AC plane detection.
2. Methods
2.1. Abdominal sweep US video data
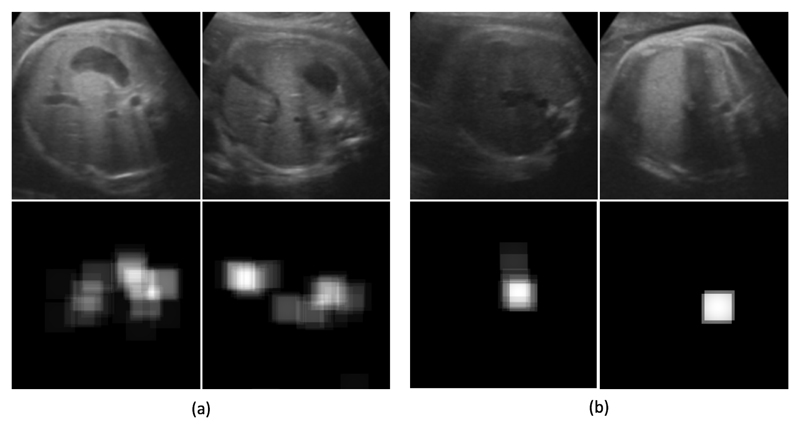
33 fetal US videos (1616 frames), each lasting 1-3 seconds, were used in this study. These abdominal video clips were manually selected by an experienced sonographer from a larger dataset of 323 fetal US videos that were acquired according to a freehand US sweep protocol. The videos were acquired on a mid-range US machine (Philips HD9 with a V7-3 transducer) by moving the probe from the bottom to top of the woman’s abdomen. The original frame size was 240×320 pixels; the fetal abdominal region was cropped out and resized to images of 240 × 240 pixels to avoid the influence of the fan-shaped border when data augmentation by rotation was performed. The dataset was separated video-wise: 1292 abdominal ultrasound video frames from 25 videos (80% of all videos) were used for training. Each frame had an image-level label yi ∈ {0, 1} indicating whether it is a standardized AC plane (ACP) (Fig. 1(a), top row) or background (BKGD) (Fig. 1(b), top row), as determined by the sonographer. The remaining 20% of ultrasound videos were used for testing.
Fig. 1.
(a) Top row shows examples of standardized AC planes and the bottom row shows corresponding eye tracking based visual heatmaps (b) examples of background frames and corresponding visual heatmaps.
2.2. Eye movement acquisition and processing
Eye movements were recorded at 30 Hz by an eye tracker (The EyeTribe) placed in front of a sonographer and under the screen. The eye-tracker was calibrated before each video was viewed. The sonographer was presented with the 33 fetal abdominal US video clips and asked to inspect each frame and find the ACP by using a keyboard to scroll through the frames. Their eye movements were tracked and recorded while they did this. Eye movements (x,y-coordinates and time t) were processed according to the protocol in [6]. In order to remove high frequency noise (due to eye tremor), a moving average filter with a window size of 3 samples was applied. Any eye movement with angular velocity below 30 degrees visual angle/second was classified as a fixation, and all the other points were classified as saccades [5]. This angular velocity threshold was translated into a pixel per second threshold by assuming that the distance between the eyes of the observer and the screen was 0.5m. Fixations less than 7.5 ms apart in time, or 0.5 degrees visual angle in space, were merged; fixations shorter than 80 ms in duration were discarded. Visual heatmaps were generated for each image using a truncated Gaussian kernel (Fig. 1, bottom rows) for computational simplicity, with a kernel size corresponding to a visual angle of 1.5 degree.
2.3. Network architecture
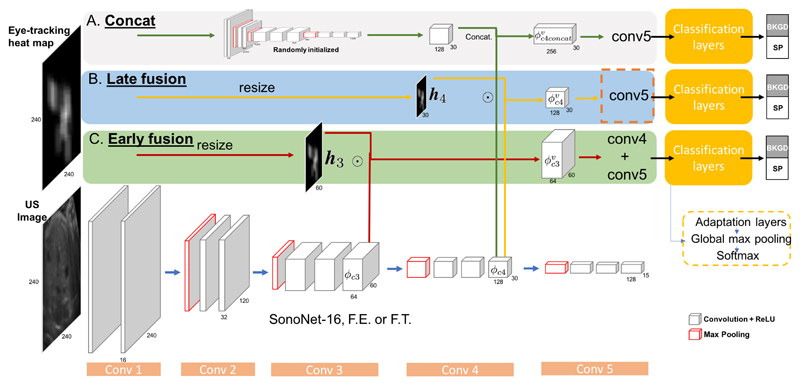
We call the family of network architectures SonoEyeNets (SENs) as they use a human eye tracking visual heatmap as an additional input to an US video frame (Fig. 2). In this paper, the US image branch used a pre-trained network, SonoNet-16 [3], as a feature extractor (FE), which utilizes 3 × 3 convolution kernels throughout its 5 convolutional blocks. Three models were built and compared by combining the feature maps from the image branch with the visual heatmap information derived in each of the following three ways of processing visual heatmaps, as indicated by different names and colour codes: (A) Concat, labelled gray: here, a visual heatmap passes through a CNN with the same architecture as SonoNet-16 but with randomly initialized weights and later fused with feature maps of the fourth convolutional block by concatenation, generating (B) Late Fusion, labelled blue: in this case, visual heatmaps are resized to 30 × 30 pixels h4 and fused with the feature maps of the 4th convolutional block ϕc4 by element-wise multiplication (Since the image branch was mainly used as a fixed feature extractor, we call this model Late FE); and (C) Early Fusion, labelled green: similar to late fusion but heatmaps are resized to 60 × 60 pixels h3 and fused with the feature maps of the 3rd convolutional blocks We call this model Early FE. The resulting is then passed through final convolutional block(s) and fed into two adaptation layers, each with 64 and two 1 × 1 kernels.
Fig. 2.
Architecture of SonoEyeNet (SEN) where three types of data fusion were investigated. The branch at the bottom takes images as input and passes it through SonoNet-16, a pre-trained model with 5 convolutional blocks. The cubes indicate the shape of feature maps after each convolutional layer. The top branch uses three different methods to process eye tracking heatmap data, as indicated by A, B, and C with corresponding color codes, each represents a distinct model named “Concat”, “Early Fusion”, and “Late Fusion”. The dotted circle ⊙ indicates element-wise multiplication.
2.4. Model fine-tuning
The 3 models Concat, Late FE, and Early FE all used SonoNet-16 as a feature-extractor in the image branch. [7] argues that fine-tuning a transferred model gives better performance, so we also considered fine-tuning the “Late Fusion” model by allowing the layers before fusion in the image branch to be updated during training. We call it Late FT. As a further variant, we removed convolutional layers after in both the Late FE and Late FT (indicated by orange dashed box in Fig. 2) to reduce the overall number of training weights. We call these 2 models Late FE truncate and Late FT truncate.
2.5. Training details
Models were trained using the adaptive moment estimation (Adam) [8] algorithm with a batch size of 256 samples, initial learning rate of 0.05, and weight decay of 0.0005. The number of epochs was set to 100, and learning rate drops 25% after every 10 epochs. Those layers that were not pre-trained were initialised from a zero-mean Gaussian distribution with standard deviation of 0.01. Batch normalization and dropout (rate = 0.5) were used for every convolutional layer before the adaptation layers. The dataset was augmented by rotating each image and its horizontal flip by 45, 90, 135, 180, 225, 270, and 315 degrees together with their corresponding visual heatmaps.
3. Results
3.1. Decision process visualization
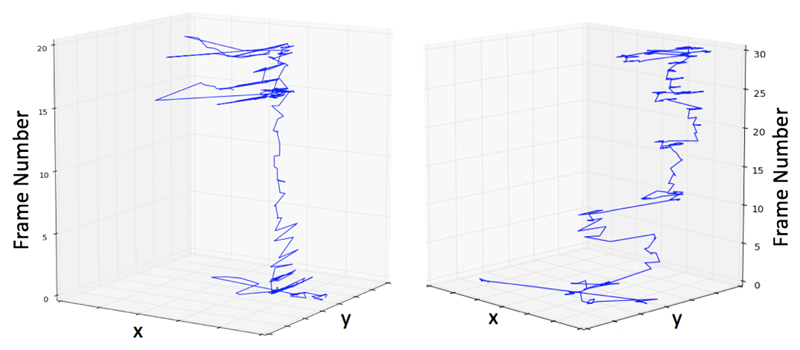
Typical sonographer eye movements during image detection are shown in Fig. 3, where the x,y plane defines each single frame of the video and the z-axis defines the frame number, starting from the bottom to the top. The blue lines represent the sonographer’s visual tracks throughout the space of the video frames. The pattern of eye movements in the ACP and background frames are notably different: after determining the contents of the initial frames, a sonographer simply skips through the majority of the background frames before they encounter frames of interests and start to explore key anatomical structures. Typically, they hesitate among several candidate ACP frames, comparing structures in them repetitively until finally making a decisions to label one frame as the ACP.
Fig. 3.
Examples of visual tracks through 2 different video clips by the same sonographer
3.2. Comparative evaluations
The first model, SonoNet-16 FE, uses only image data and convolutional layers of SonoNet-16 as a feature extractor. SonoNet-16 FT also uses only image data but it allows the weights to be fine-tuned during training. After fine-tuning an increase of precision from 73.6% to 85.1% was observed, indicating an increase in the model’s ability to classify background frames; however, there is a corresponding decrease in recall from 74.1% to 64.7%, indicating a decrease in ability to classify an ACP, as shown in Table 1.
Table 1.
Comparative Evaluation of Classification Performance. Column “Eye” indicates whether eye movement data was used. Values in bold correspond to the best results.
| Models | Eye | Precision | Recall | F1-score |
|---|---|---|---|---|
| SonoNet-16 FE | No | 73.6 | 74.1 | 73.8 |
| SonoNet-16 FT | No | 85.1 | 64.7 | 73.5 |
| SEN-Concat | Yes | 95.3 | 74.4 | 85.4 |
| SEN-Early FE | Yes | 93.8 | 76.8 | 84.5 |
| SEN-Late FE | Yes | 96.1 | 91.3 | 93.6 |
| SEN-Late FT | Yes | 96.5 | 99.0 | 97.8 |
When training with visual heatmaps in tandem with US images, an immediate classification improvement was observed for background frames, as the SonoEyeNet models all achieved precisions above 93%. However, SEN-Concat and SEN-Early FE did not improve the ACP classification as recall remained at 74.4% and 76.8%, respectively. The first improvement in recall can be observed in SEN-Late FE where recall increased to 91.3%. Best results were achieved by SEN-Late FT where the branch for image feature extraction was allowed to be further fine tuned. As can be seen in Table 1, the model’s ability to classify background and ACP is the best among all models.
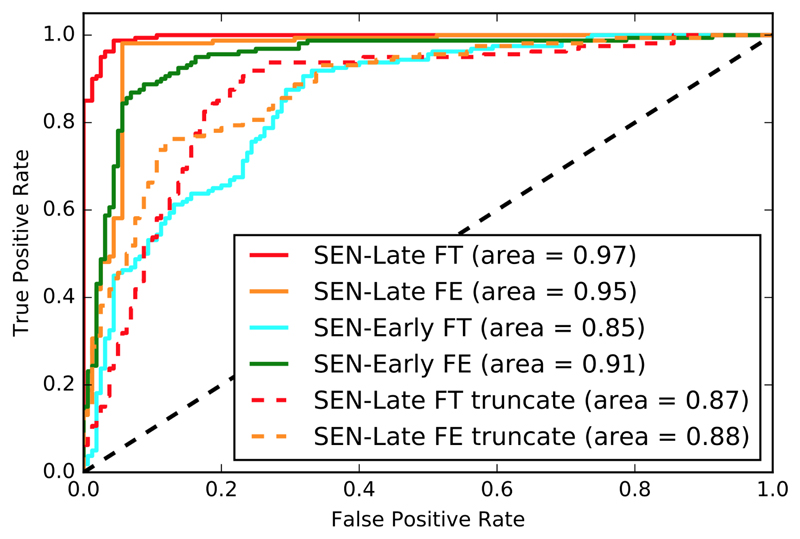
Receiver Operating Characteristic (ROC) curves for the models are shown in Fig. 4. Confirming the findings in Table 1, SEN-Late FT (red) performs best and is followed by SEN-Late FE (orange) and SEN-Early FE (green), with Area Under the Curve (AUC) of their ROC curves of 0.97, 0.95 and 0.91 respectively. The image feature branch in the early fusion model was further fine-tuned in SEN-Early FT (blue), but a dramatic decrease in performance was observed, as the AUC of the ROC dropped to 0.86. In addition, SEN-Late FE truncate (orange dash) and SEN-Late FT truncate (red dash) were further trained to see whether smaller models with fewer parameters to train perform better than larger ones. However, they were found to be inferior to their close variants SEN-Late FT and SEN-Late FE, as their corresponding AUC drops to 0.89 and 0.88, respectively.
Fig. 4.
ROC curves of selected SEN models. SEN-Late FT with AUC=0.97 is the best-performing model.
4. Discussions and Conclusions
As demonstrated in Fig. 3, the eye movement experiment results agree with the finding of [5]. Namely, two distinctive phases can be observed in the sonographers’ visual search strategy: a rapid phase where sonographers quickly skipped through the background frames followed by a slower phase where they extensively explored the abdominal area in candidate ACPs for key structures, i.e. stomach bubble, umbilical vein and spine.
Four trends are observed from Table 1 and ROC curves in Fig. 4. First, models that use both eye movement data and US image data (SonoEyeNets) achieve higher classification accuracy than models trained purely on US image data. Second, element-wise multiplication of a resized visual heatmap and image feature maps performs better (as measured by recall and precision) than concatenation of the feature maps from both image and heatmap branches. Third, fusion of image feature maps and visual heatmaps at later stages (after the 4th convolutional block) achieves better results (as measured by recall and precision) than that at an earlier stage (after the 3rd convolutional block), indicating higher level image features are more useful. Finally, fine-tuning the image feature branch during training further improves model performance.
The truncated models in the experiments over-fitted to the training set, which is mainly caused by the removal of the convolutional block immediately before the classification layer. The remaining 2 convolutional layers in the classification layer lacked descriptive power to classify fusion feature map indicating that the fusion of US image data and eye movement data needs to find a balance: a model that can sufficiently describe image data (higher level features) but at the same time allows more flexibility to handle fused feature maps, even if it means one additional convolutional block.
The results presented in this paper demonstrate a novel way to train a classification CNN for fetal US video plane finding using US video and sonographer eye movements on datasets of modest size. Note that precision, recall and F1-score results are data dependent. It would be interesting to see whether these very promising results can extend to other standardized fetal ultrasound plane definitions, and indeed other ultrasound plane finding tasks more generally.
Acknowledgments
We acknowledge the ERC (ERC-ADG-2015 694581 for project PULSE) and the EPSRC (EP/GO36861/1 and EP/MO13774/1)
References
- [1].Hack, et al. Outcomes of extremely low birth weight infants. Pediatrics. 1996;98(5):931–937. [PubMed] [Google Scholar]
- [2].Yaqub, et al. Guided random forests for identification of key fetal anatomy and image categorization in ultrasound scans. MICCAI. 2015:687–694. [Google Scholar]
- [3].Baumgartner, et al. Sononet: Real-time detection and localisation of fetal standard scan planes in freehand ultrasound. IEEE TMI. 2017 doi: 10.1109/TMI.2017.2712367. [DOI] [PMC free article] [PubMed] [Google Scholar]
- [4].Cerf, et al. Predicting human gaze using low-level saliency combined with face detection. Advances in neural information processing systems. :241–248. [Google Scholar]
- [5].Ahmed, et al. An eye-tracking inspired method for standardised plane extraction from fetal abdominal ultrasound volumes. IEEE ISBI. 2016:1084–1087. [Google Scholar]
- [6].Mathe, et al. Dynamic eye movement datasets and learnt saliency models for visual action recognition. ECCV. 2012:842–856. doi: 10.1109/TPAMI.2014.2366154. [DOI] [PubMed] [Google Scholar]
- [7].Gao, et al. Describing ultrasound video content using deep convolutional neural networks. IEEE ISBI. 2016:787–790. [Google Scholar]
- [8].Kingma, et al. Adam: A method for stochastic optimization. arXiv preprint arXiv:1412.6980. 2014 [Google Scholar]


